Waterfall Analysis
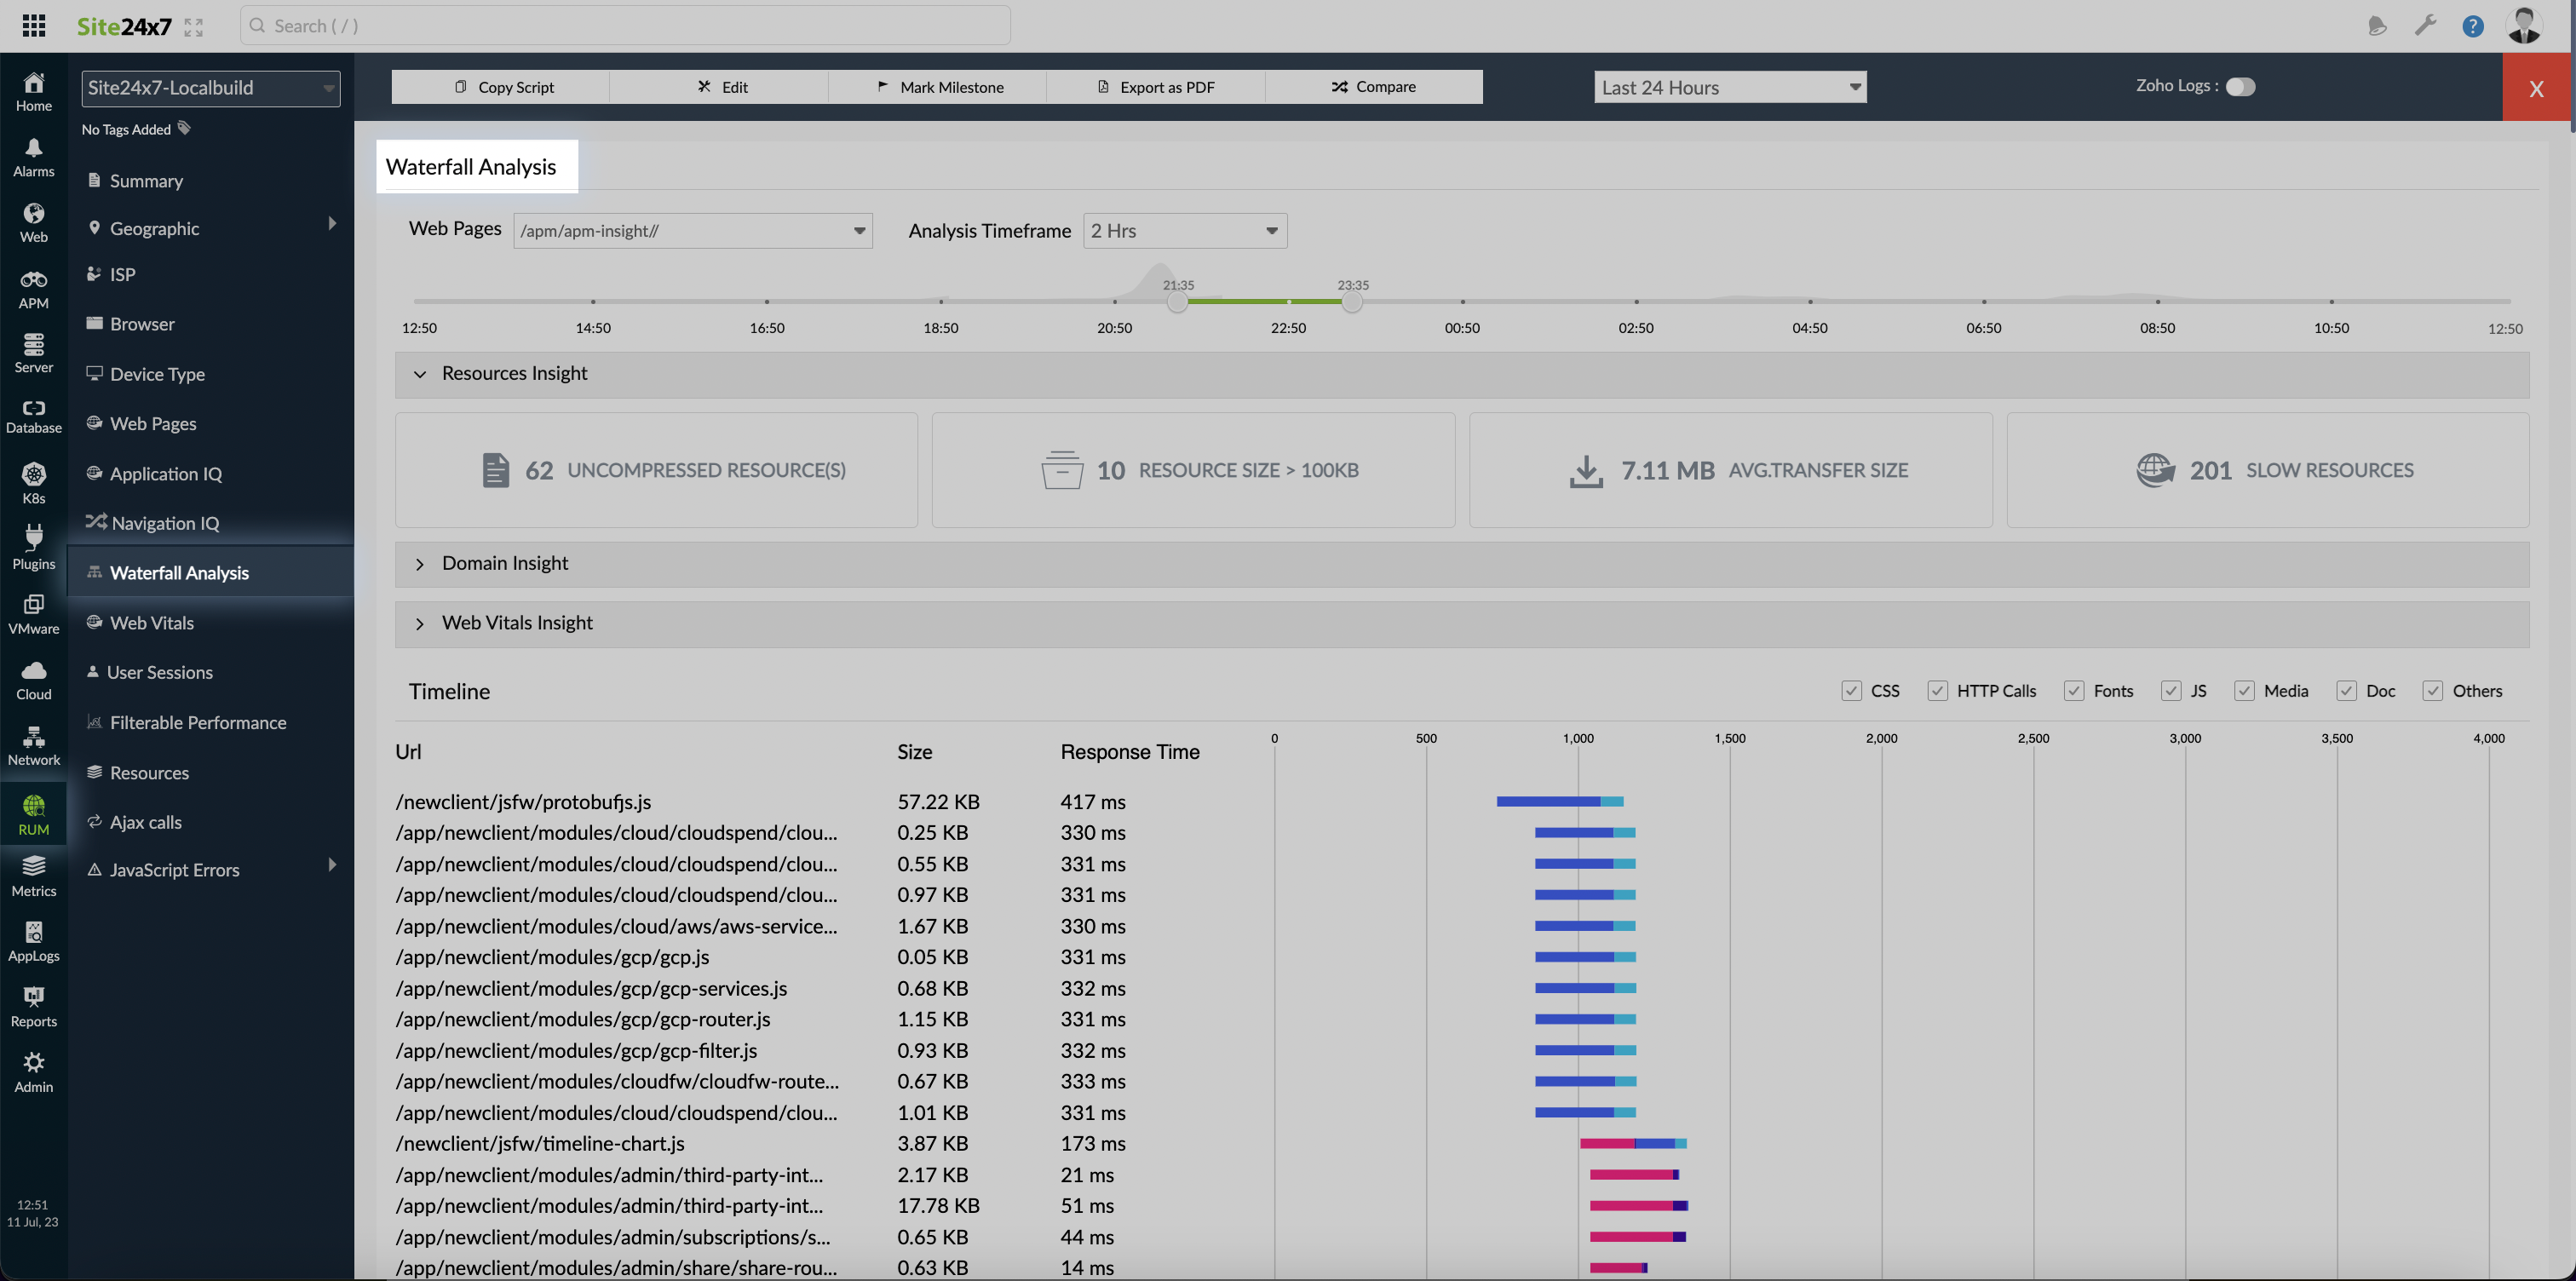
Waterfall Analysis is an excellent tool for examining all user actions in detail. The waterfall chart provides invaluable insight into the list of resources made to load a page and the time taken for each. It allows you to see how a page is loaded and which requests took the longest time, enabling you to pinpoint where to focus on performance optimization for that page.
View the Waterfall Analysis metrics
To view the waterfall analysis metrics for the selected web page:
- Log in to your Site24x7 web client.
- Navigate to RUM > your Application > Waterfall Analysis.

Filters
You can select the required webpage for analysis from the Web Pages drop-down menu and the time duration (15 mins, 30 mins, 1 hr, and 2 hrs) from the Analysis Timeframe drop-down.
Minimap
The minimap has a main timeline bar that allows you to select the exact time for which you need the waterfall metrics. To select a time frame, drag the green line across the main timeline.

Data Insights
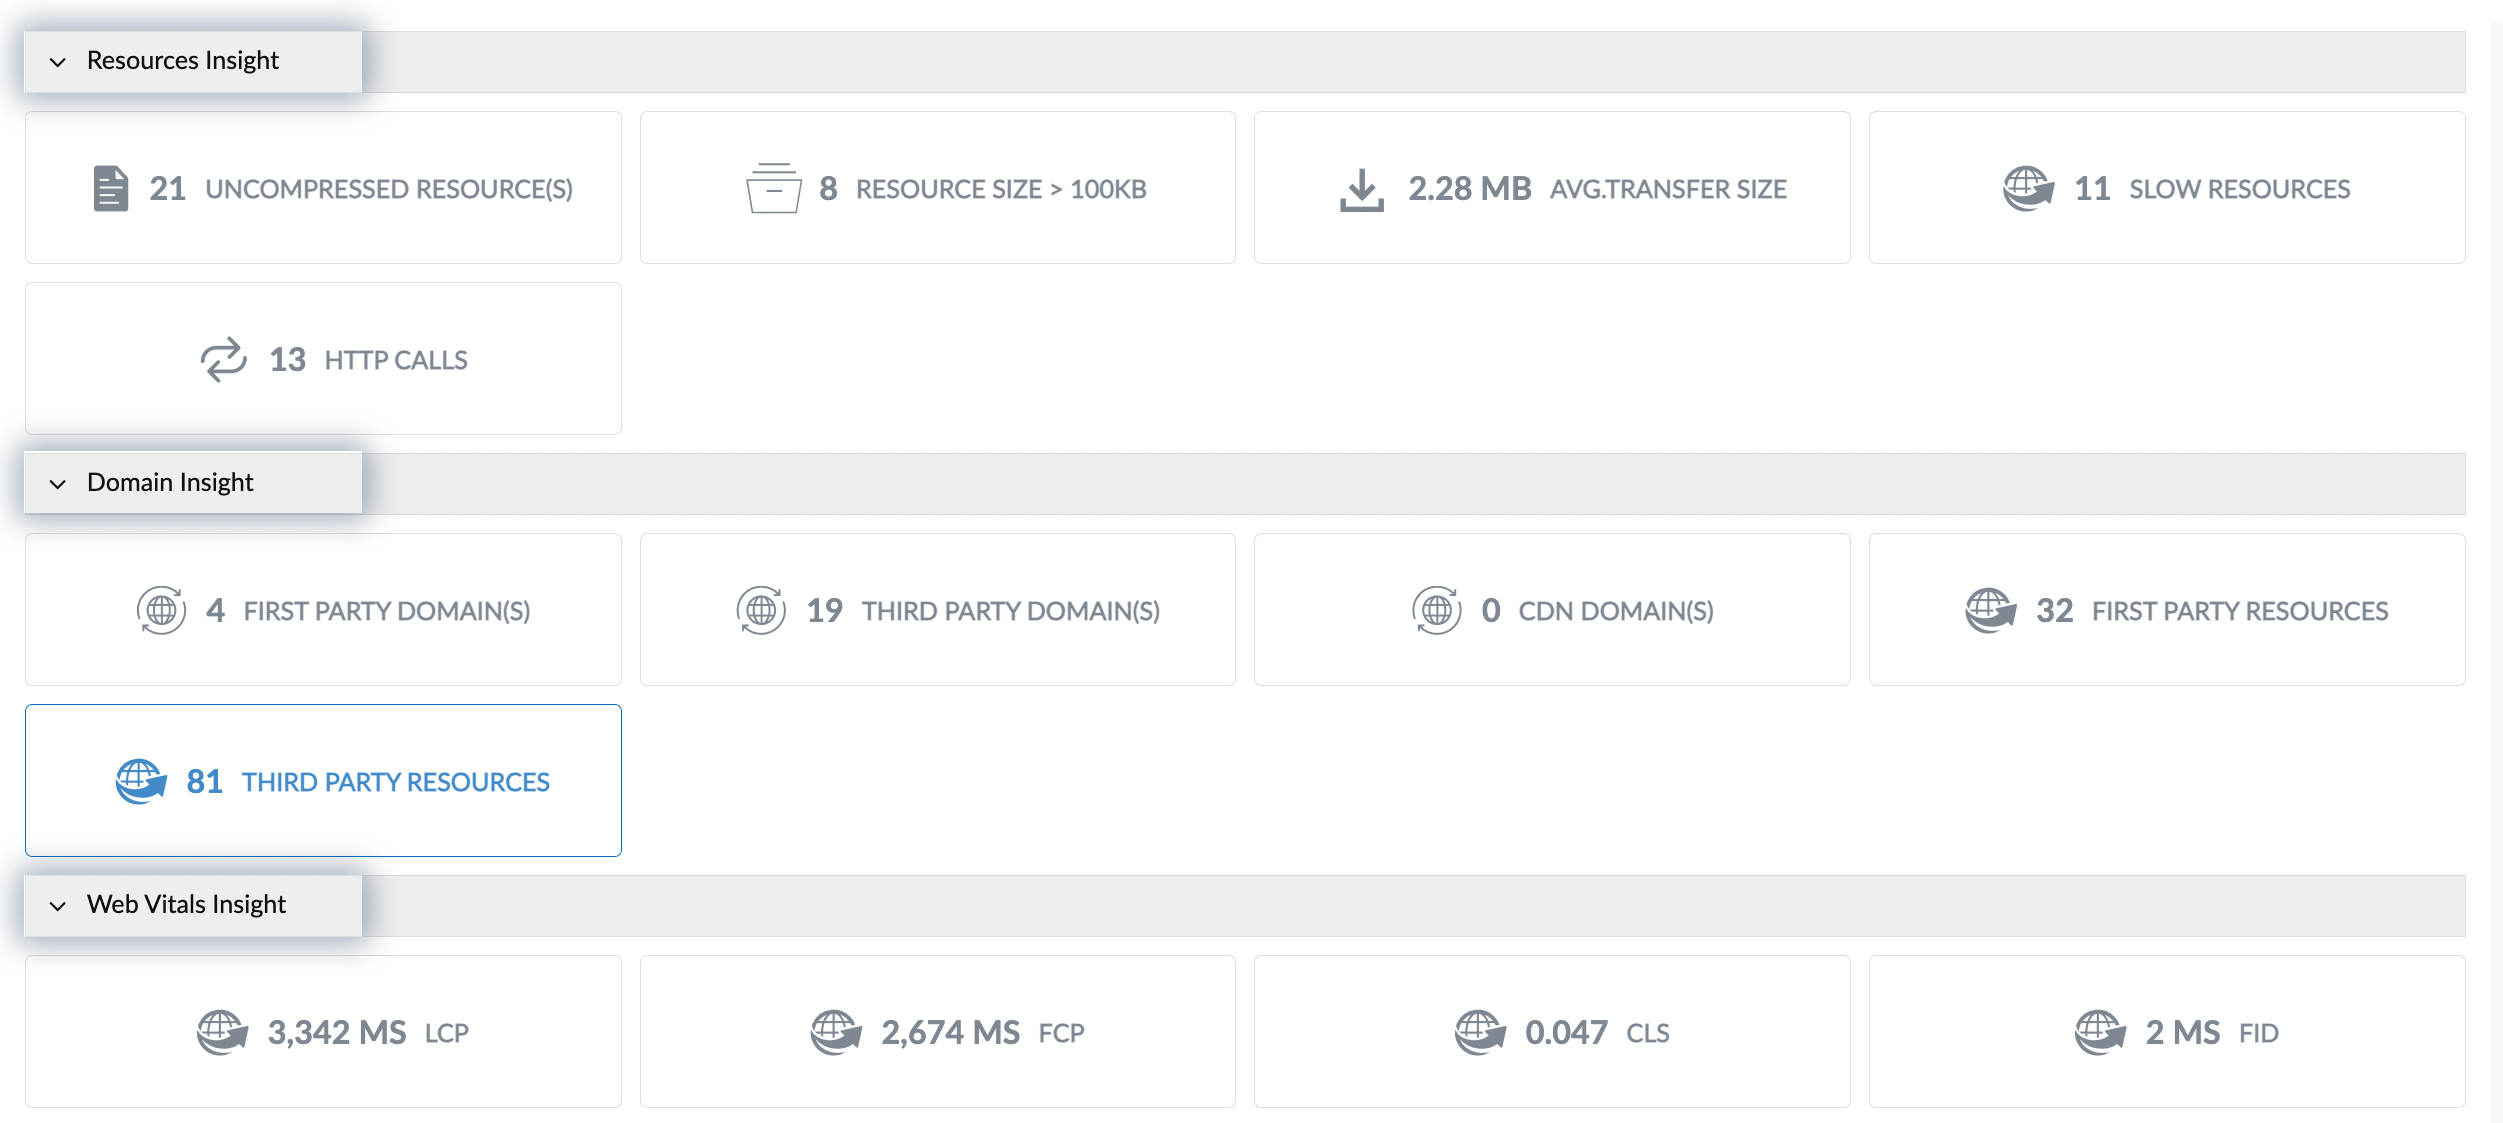
The insights captured are classified as follows:

| Insight Type | Metric | Description |
| Resources Insight | Uncompressed Resource(s) | Resources with a compression ratio of one (decoded size/encoded size). |
| Resource Size > 100KB | Resources larger than 100KB. | |
| Rarely Occurring Resourcs(s) | Resources that occur in less than 5% of page loads. | |
| Average Transfer Size | The average size of resources transferred while loading the page. | |
| Slow Resources | Resources with a response time of more than 200 milliseconds. | |
| HTTP calls | The number of HTTP calls. | |
| Domain Insight | First Party Domain(s) | The total number of first-party domains contacted. |
| Third Party Domain(s) | The total number of third-party domains contacted. | |
| CDN Domain(s) | The total number of CDN domains contacted. | |
| First Party Resources | The total number of resources collected directly from users. | |
| Slow Resources | The total number of resources collected from an external server or vendor. | |
| Web Vitals Insight | LCP | Render time of the largest image, text, or other DOM (Document Object Model) node in the viewport. |
| FCP | Render time of the first image, text, or other DOM (Document Object Model) node in the viewport. | |
| CLS | The sum of layout shift scores used to assess the visual stability of the page. | |
| FID | The browser's response time to user interactions like clicking and tapping. |
Main Timeline
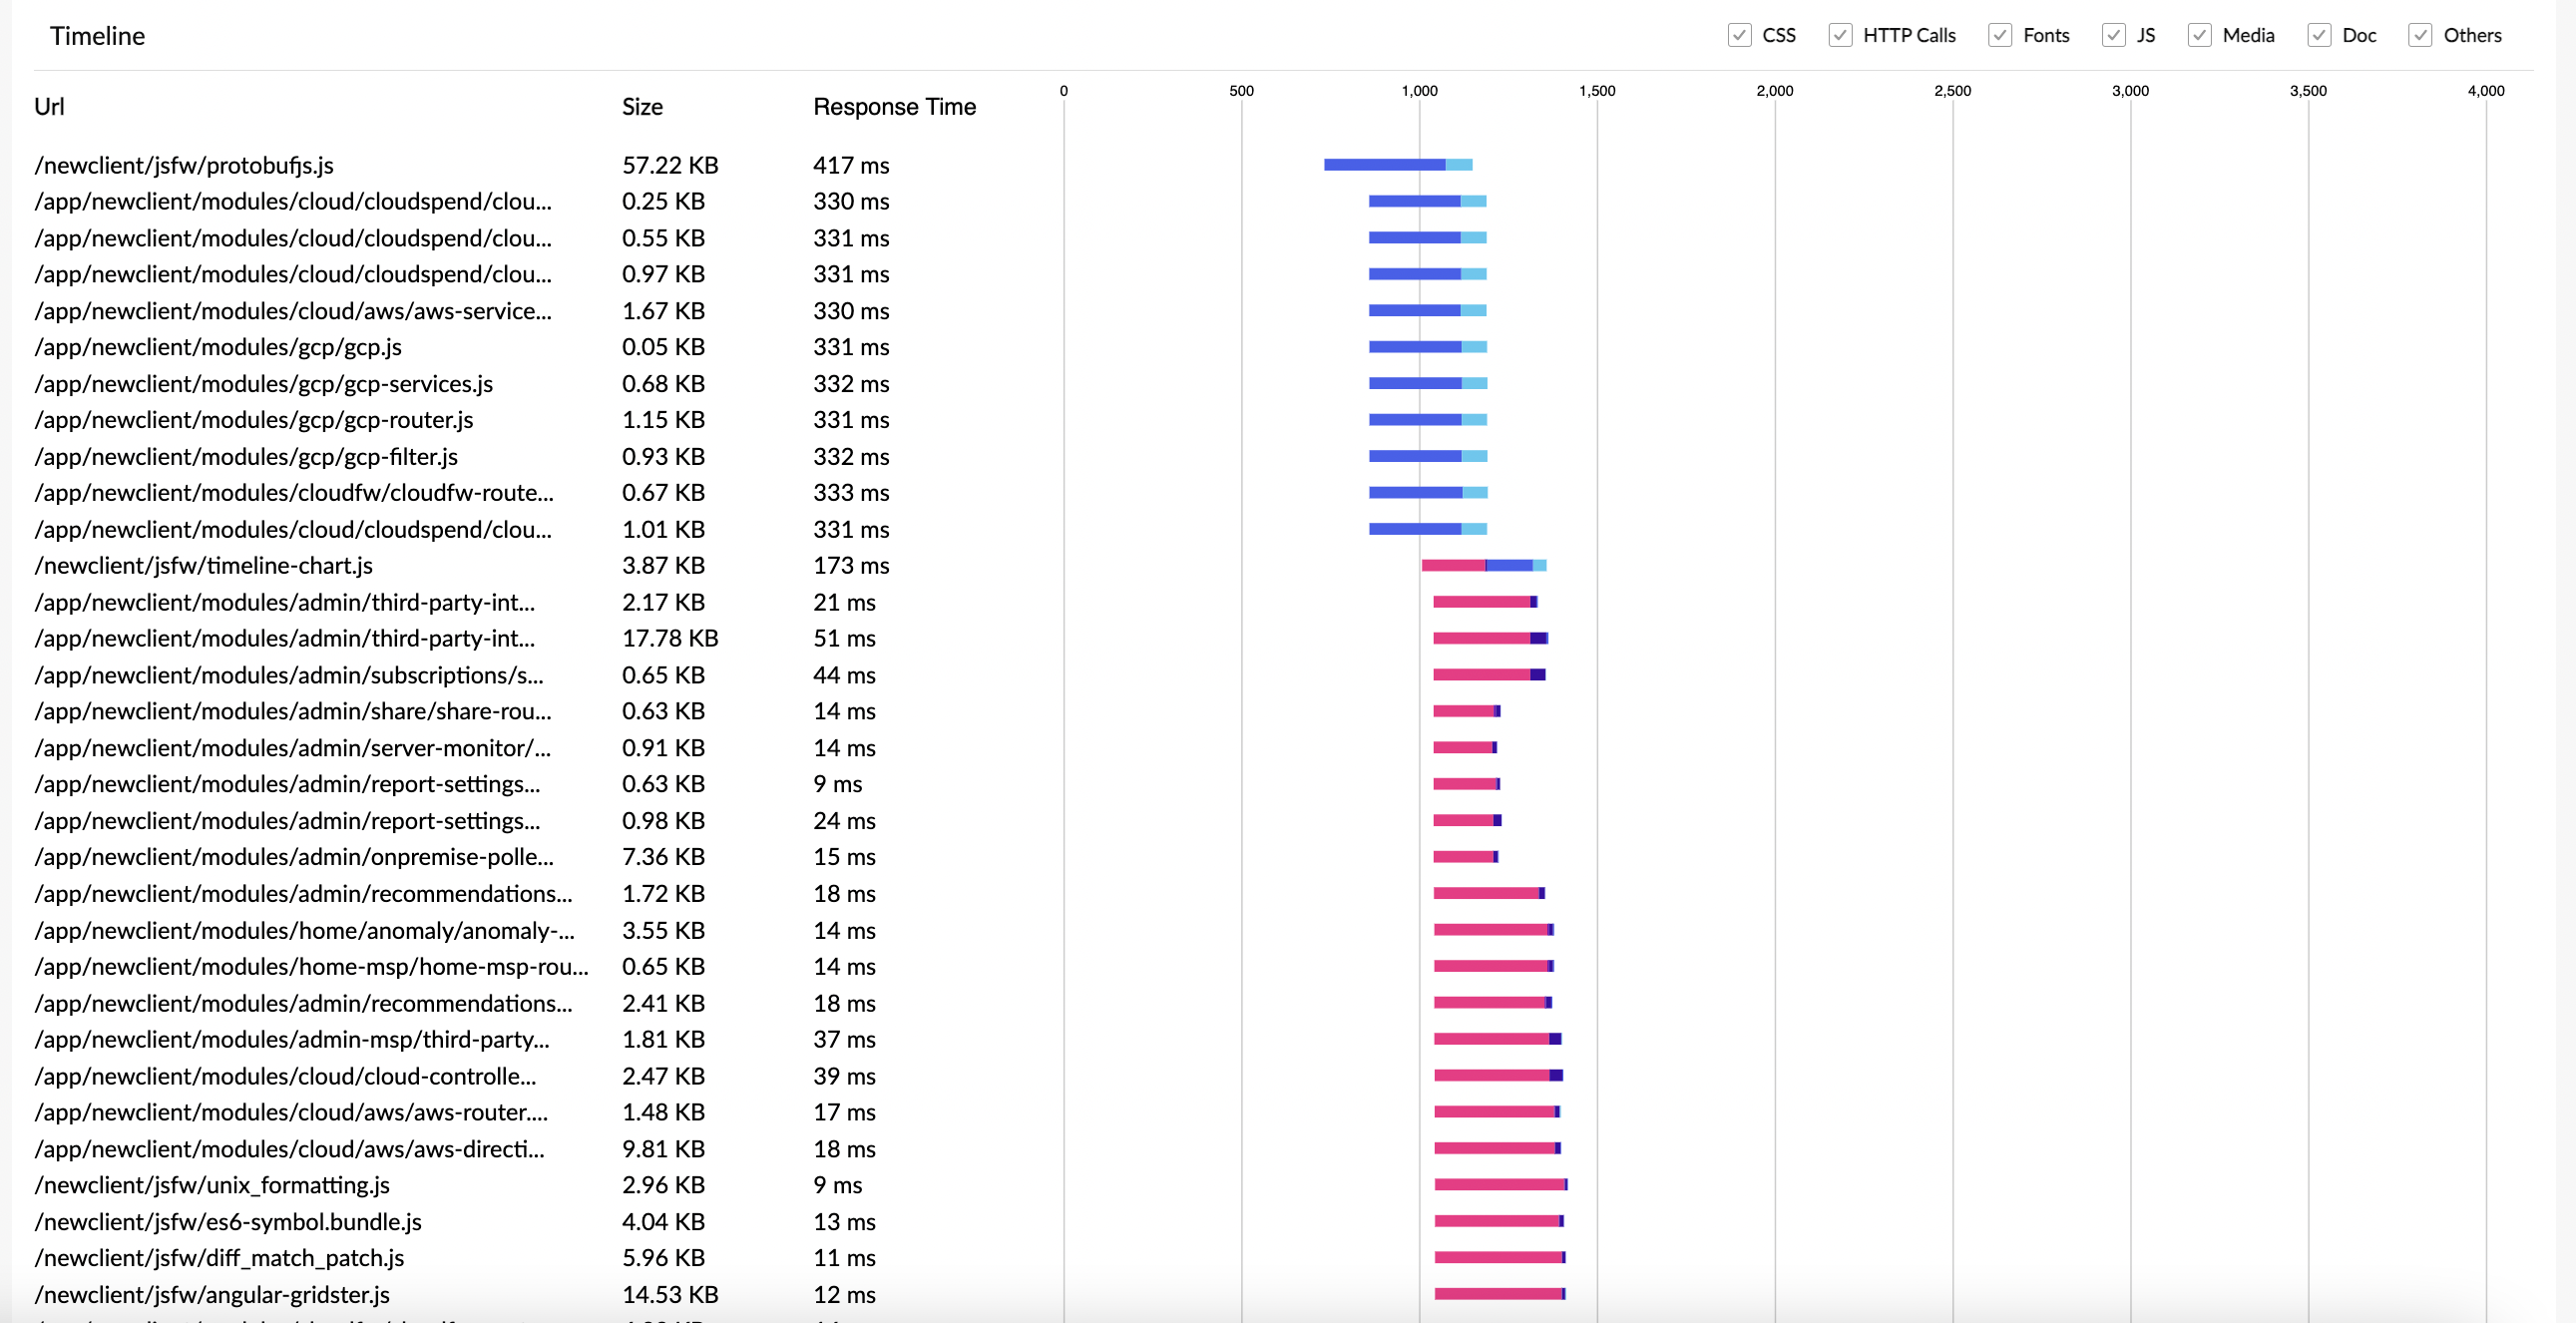
The waterfall chart displays a list of the requests made to load a page and the time taken by each request. With these timeline bars, you can easily identify the request that took the most time.

Url: The requests are displayed in the order in which they were called.
Size: The size of each request.
Response Time: The time taken by the request to respond to the user's action.
- By default, all requests are displayed. You can manage this by checking or unchecking the required request type at the top, such as CSS, HTTP Calls, Fonts, JS, Media, Doc, and Others.
- The color-coded bars indicate the time split-up. Each color has a meaning.
 Blocking Time: The amount of time the request waited before being sent.
 DNS Time: The time it takes to complete a domain lookup for the requested resource.
 SSL Time: The amount of time the request spent performing the SSL handshake.
 Connection Time: The time it takes to establish a transportation connection.
 Server Time: The time it takes the application's backend to serve the requested resource.
 Download Time: The time it takes to download the requested content. Reducing the total number of bytes transferred would have an immediate impact on download time.
 Others: The time it takes for other resources from third-party domains to load.
Cross-Origin Resource Timing Limitations
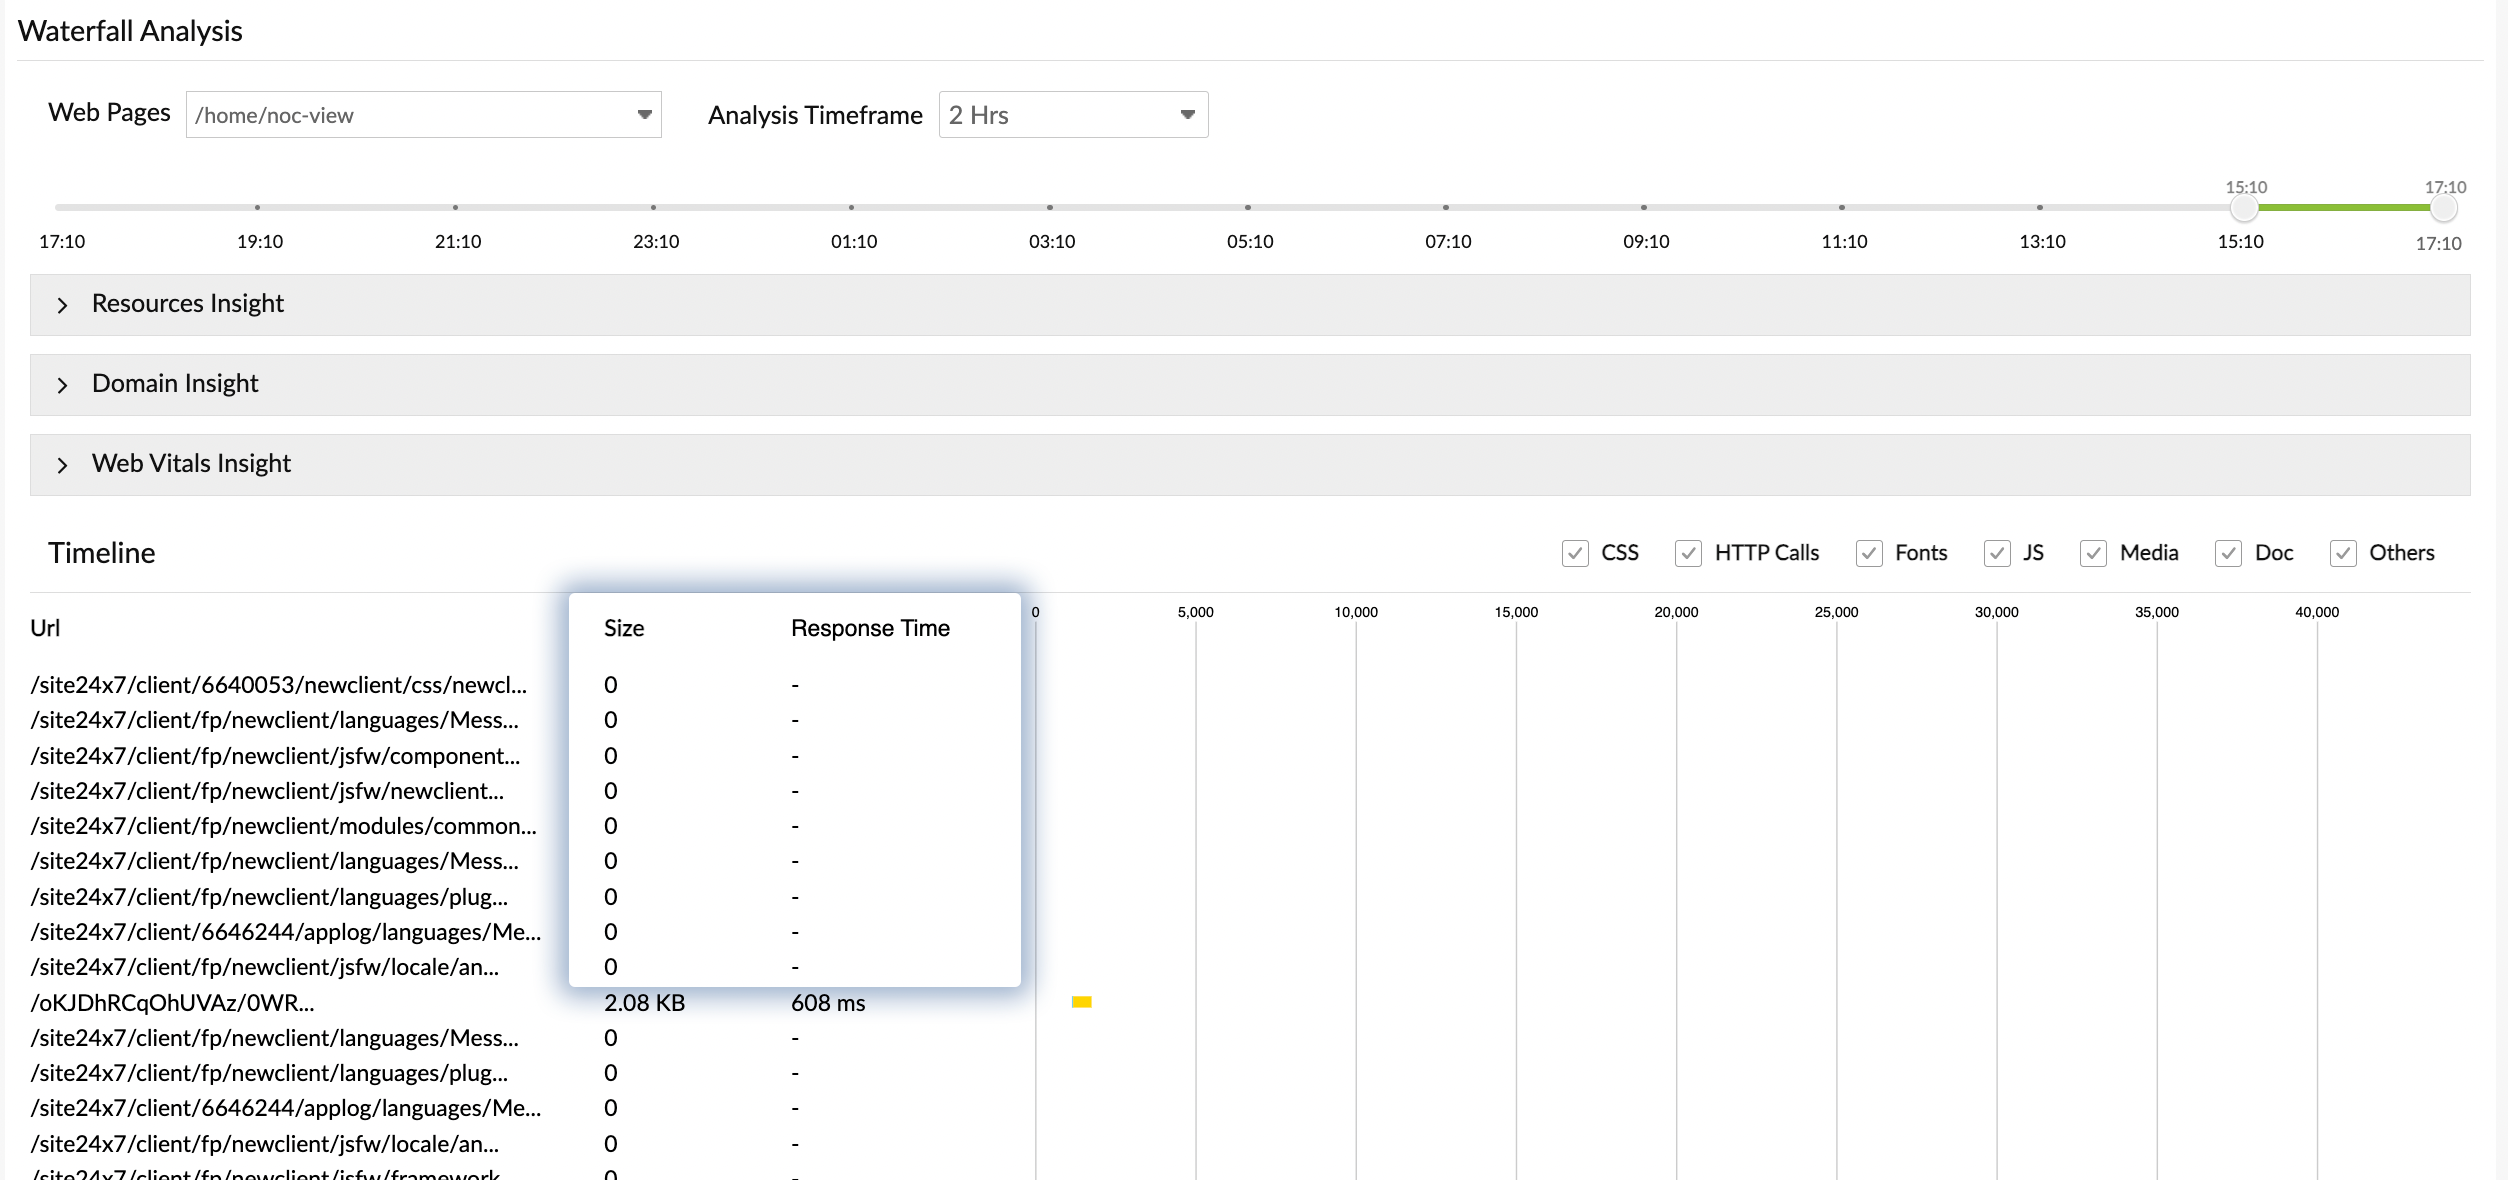
The Resource Timing API collects data on the loading times of a website's resources. However, it has restrictions on collecting data from other websites due to the cross-origin security limitations that web browsers enforce on scripts.
For example, if your web application is hosted at www.zylker.com and it uses videos from videos.zylker.com, the timing information (Size and Response Time) will only be available for resources loaded from www.zylker.com by default and not for resources loaded from videos.zylker.com
As a result, you will not get data for these requests, as shown in the screenshot below.

How to resolve this?
To overcome this limitation, you can enable data collection for cross-origin resources by adding a specific header called Timing-Allow-Origin to the HTTP response header of those resources.
For example, if you want to allow access to the resource timing from any website, you can use Timing-Allow-Origin: *.
If you want to learn more about CORS on the MDN Web Docs, click here.