Custom attributes
A custom attributes monitor can be created for certain key metrics of Site24x7's Data Lake monitor for which you need alerts. Each custom attributes monitor is considered a basic monitor.
Table of contents
Add a custom attributes monitor
Follow the steps listed below to create a custom attributes monitor:
- Log in to the Site24x7 web client.
- Navigate to Metrics > Custom Attributes and then click the (+) icon.
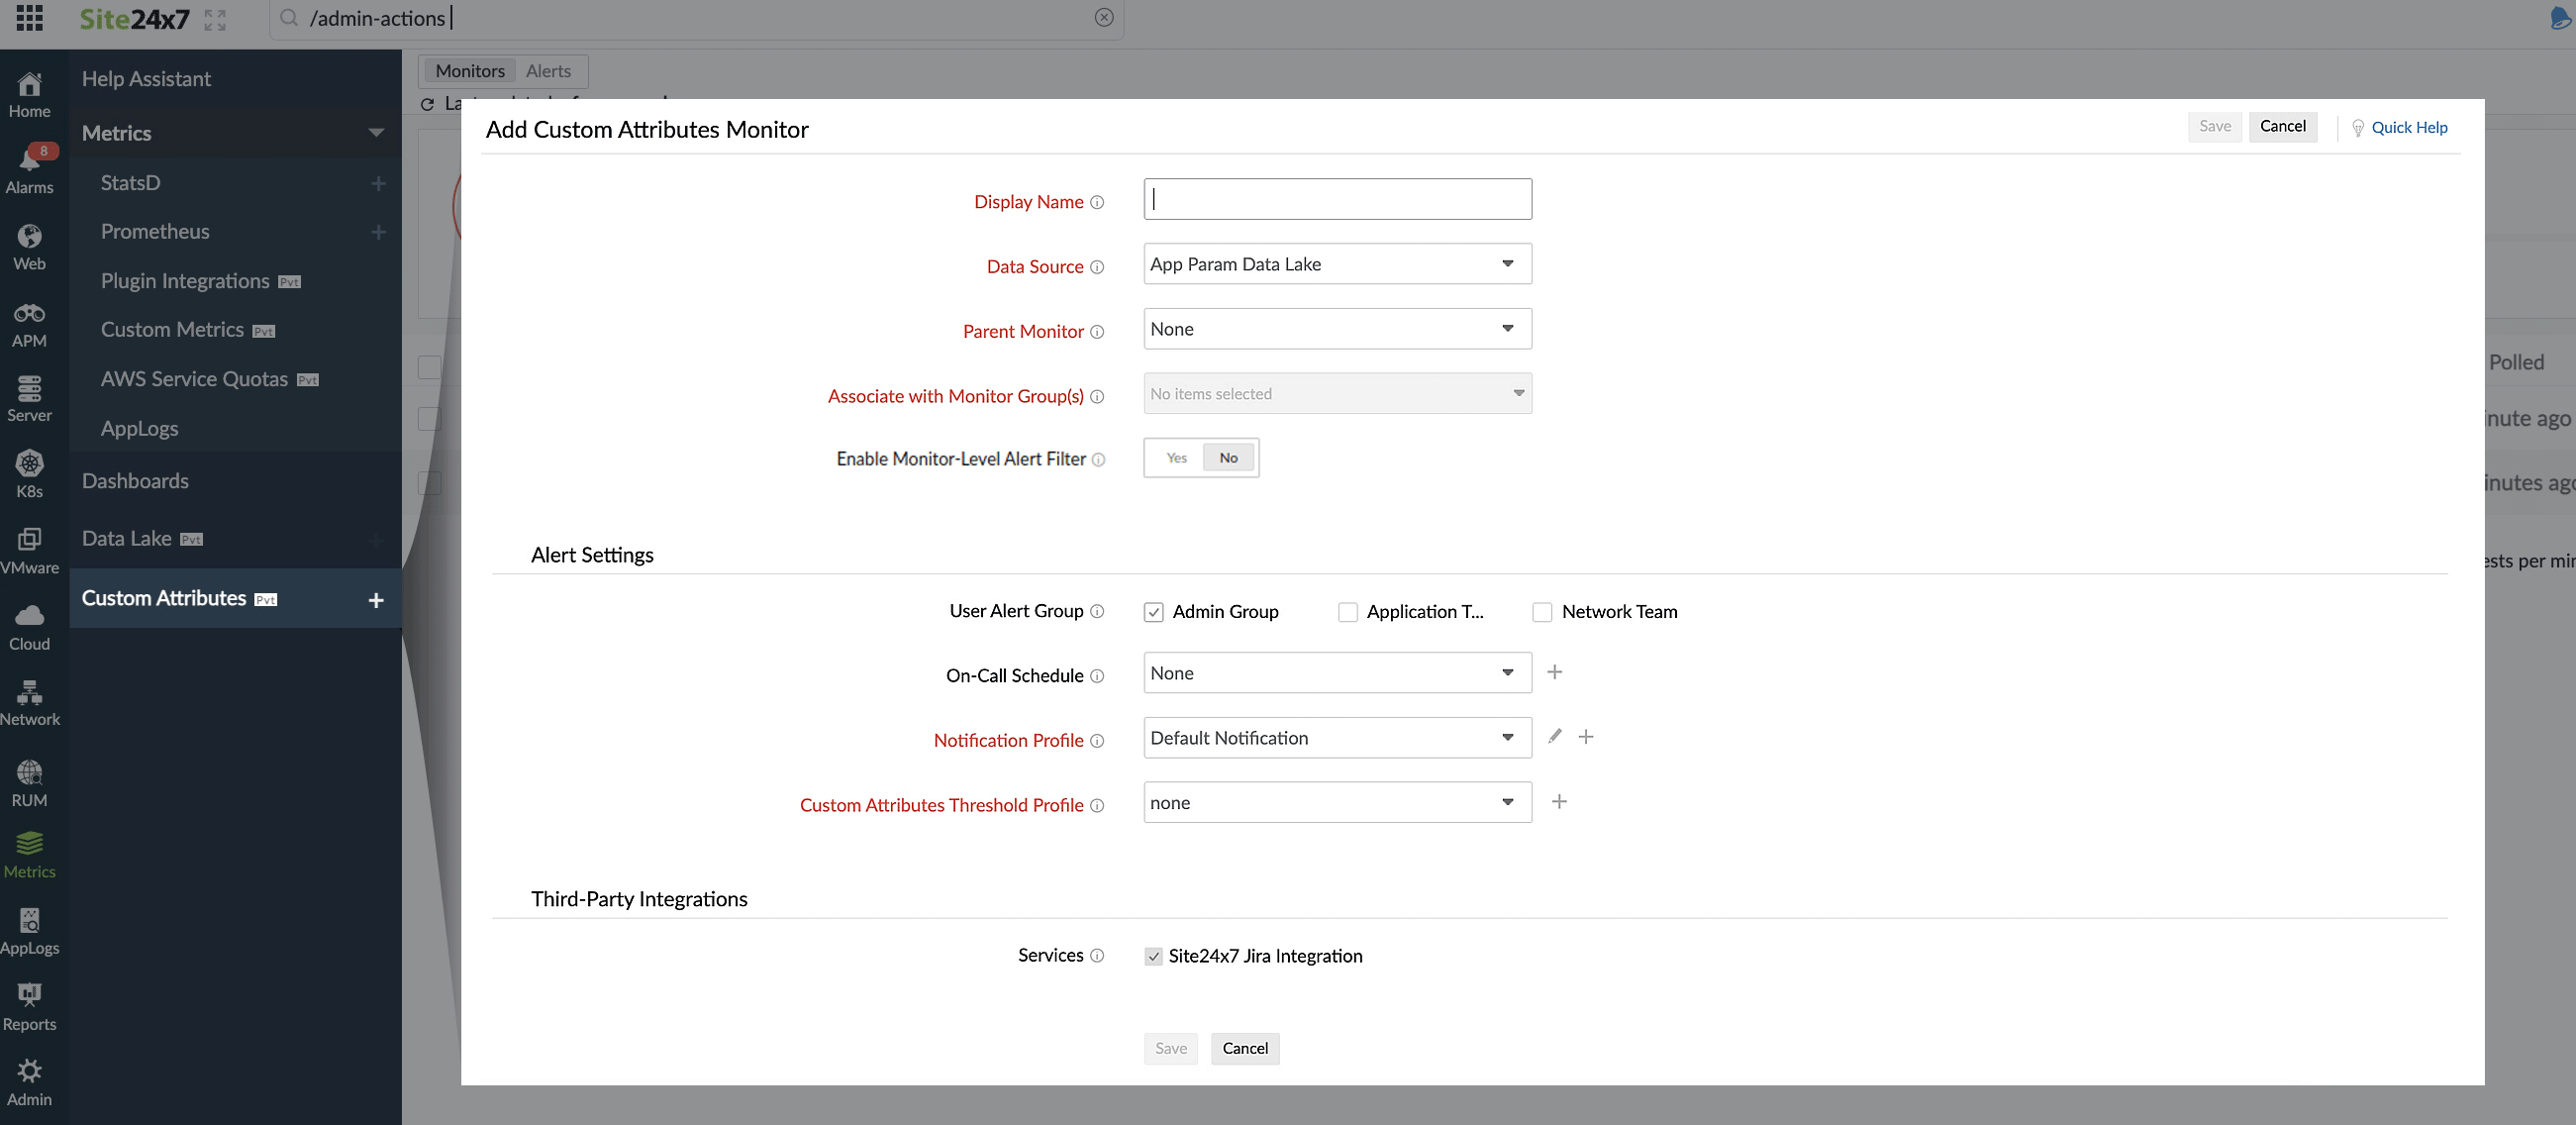
- Specify the following parameters:
- Display Name: Provide a name, which will be the name of your custom attributes monitor.
- Data Source: Choose a data lake monitor from the drop-down menu, whose fields will be used to create a custom attributes monitor.
- Parent Monitor: Select a parent monitor for which the configured alerts must be escalated.
- Associate with Monitor Group(s): The custom attributes monitor will be automatically associated with the monitor group(s) of the selected parent monitor.
- Enable Monitor-Level Alert Filter: If you want to create common filters to all attributes in the monitor, set this option to Yes.
 You can have a maximum of two monitor-level alert filters.
 - User Alert Group: Users in the selected groups will be notified when there is an alert. Learn more.
Notification medium can also be configured for each user separately. Learn more. - On-Call Schedule: The On-Call Schedule option helps to ensure that the notifications are sent to assignees during specific shift hours, allowing them to respond to alerts or incidents quickly. Choose an on-call on your preference from this drop-down.
- Notification Profile: A Notification Profile helps to configure a profile to specify whom to be notified or how to be notified.
- Custom Attributes Threshold Profile: Choose a threshold profile from the drop-down menu and get notified when the resources cross the configured threshold value. It also helps to decide if a specific resource has to be declared Trouble or Critical.
You can click on the (+) icon to add a new threshold profile.
Add Threshold Profile
Specify the following parameters and click Save to create a new Threshold Profile.
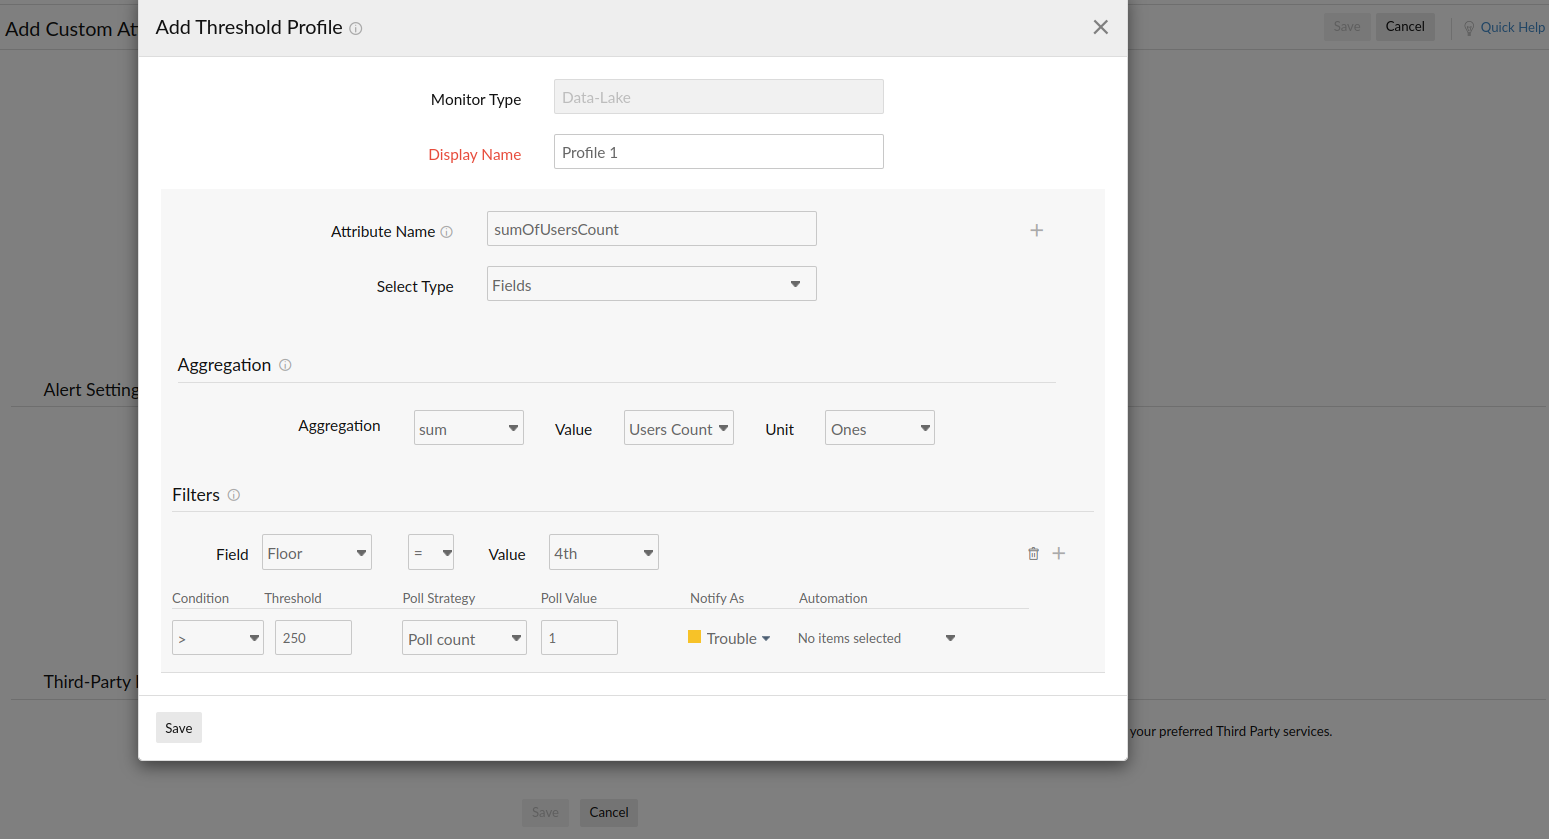
- Monitor Type: Monitor Type would be data lake by default. It can't be changed.
- Display Name: Provide a label for identification purpose.
- Attribute Name: Provide a name to create an attribute that has to be alerted.
- An attribute is a combination of an Aggregation and a Filter, where the Filter is optional.
- A maximum of 10 attributes can be created for a threshold profile.
- Select Type: Fields is the default setting for Type.
- Aggregation: Choose the aggregate condition and value to obtain the data for which thresholds need to be configured.
- Filters: You can apply multiple filters to the aggregated data before configuring the threshold conditions.
- Field: Choose a Field based on which the filter must be applied.
- Value: Choose any of these conditions <, >, =, <=, or >= to set the criteria to trigger alerts based on its operation with the input value given in the Value.
- Condition: Choose any of these conditions <, >, =, <=, or >= to validate the Threshold.
- Threshold: Set the threshold value for which the specified Condition will be applied.
The value given in the Threshold field will be multiplied by the Unit value.
For example, if the Threshold is 10 and the Unit is Billion, the threshold value should be considered as 10 Billion. - Poll Strategy: The Poll Strategy allows you to validate the threshold breach.
The monitor’s status changes to Trouble/Critical when the condition applied to any of the below threshold strategies holds true.- Poll count: The monitor’s status changes to Trouble or Critical when the condition applied to the Threshold value is continuously validated for the specified Poll Value (number of polls).
- Poll average: The monitor's status changes to Trouble or Critical when the average of the attribute values for the Poll Value (number of polls) configured continuously justifies the condition applied to the Threshold value.
- Time duration (in minutes): When the specified condition applied on the Threshold value is continuously validated for all the polls, during the time duration (Poll Value) configured, the monitor’s status changes to Trouble or Critical.
- Average time (in minutes): The monitor’s status changes to Trouble or Critical when the average of the attribute values for the time duration (Poll Value) configured continuously justifies the condition applied on the Threshold value.
- Notify As: The monitor status (Trouble/Critical) is to be set when the threshold is breached.
- Third-Party Integrations: You can integrate Site24x7 alarms to a preferred third-party service. By integrating your account with these third-party platforms, you can receive alert notifications through your preferred channels, collaborate with your team, automate tasks, and do much more. Learn more.
- Finally, click Save to create a custom attributes monitor.
- Once the monitor is created, you will be redirected to the custom attributes dashboard.
- You can see the created alerts in the respective Data Lake monitor > Alerts tab.
Custom attributes dashboard
Once you've successfully added a custom attributes monitor, you'll be directed to the custom attributes dashboard. You can also access it by navigating to Metrics > Custom Attributes.
Get a holistic view of your custom attributes monitors. The dashboard categorizes your monitors based on their status (Up, Trouble, Critical, or Down).
Monitors view
Gives an overall summary of the data lake monitor (data source), parent monitor of the data lake monitor, top two attributes and their values, and last polled time.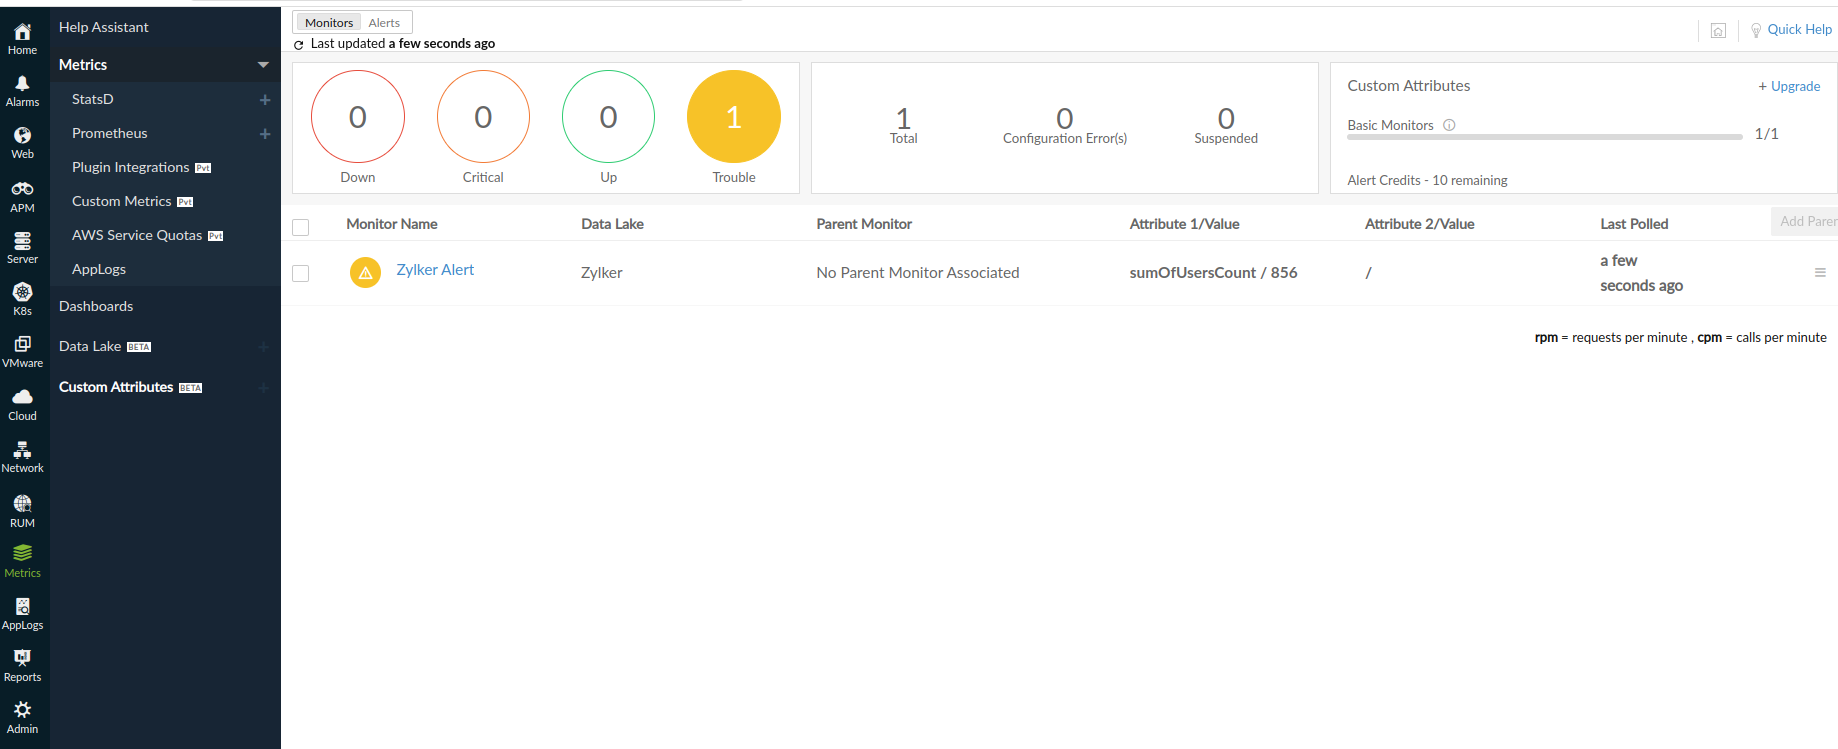
Edit monitor
You can update the configurations on the Edit Custom Attributes Monitor page.
- Click the hamburger icon (
 ) beside the monitor name. Click Edit.
 - In the Edit Custom Attributes Monitor page, you can update the required fields.
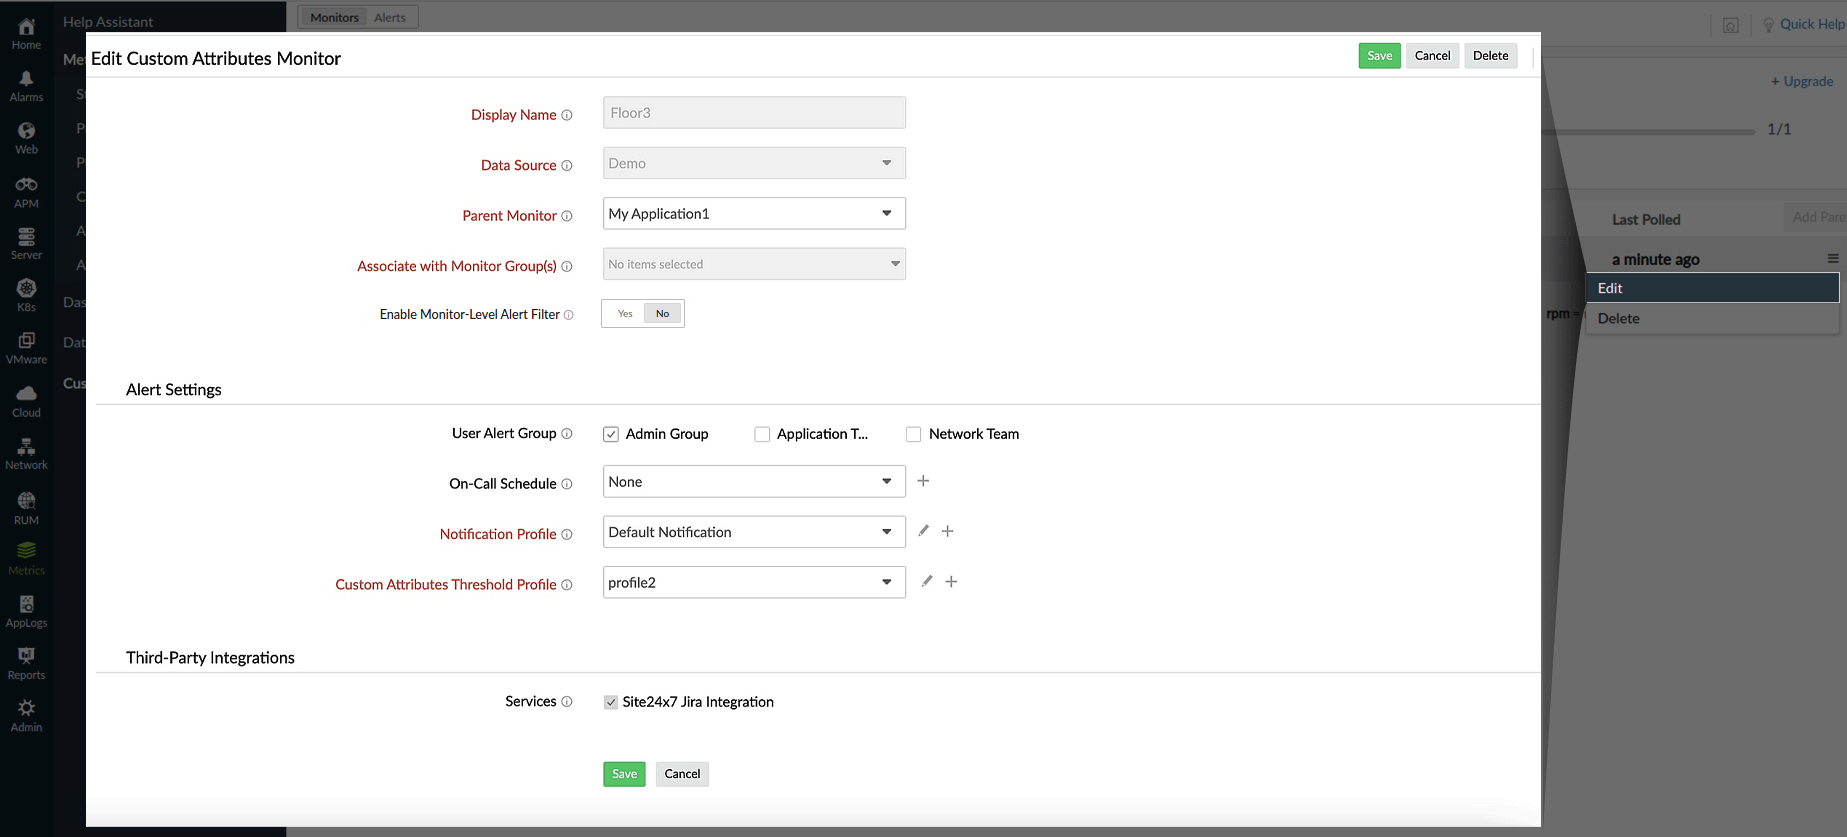
- Save your changes.
Delete monitor
You can delete any custom attributes monitor that is no longer needed.
- Click the hamburger icon () beside the monitor name.
- Click Delete.
Alerts view
Gives a comprehensive list of custom attributes configured in all monitors. You can view details like aggregated value, monitor name, configured filter, and aggregation type.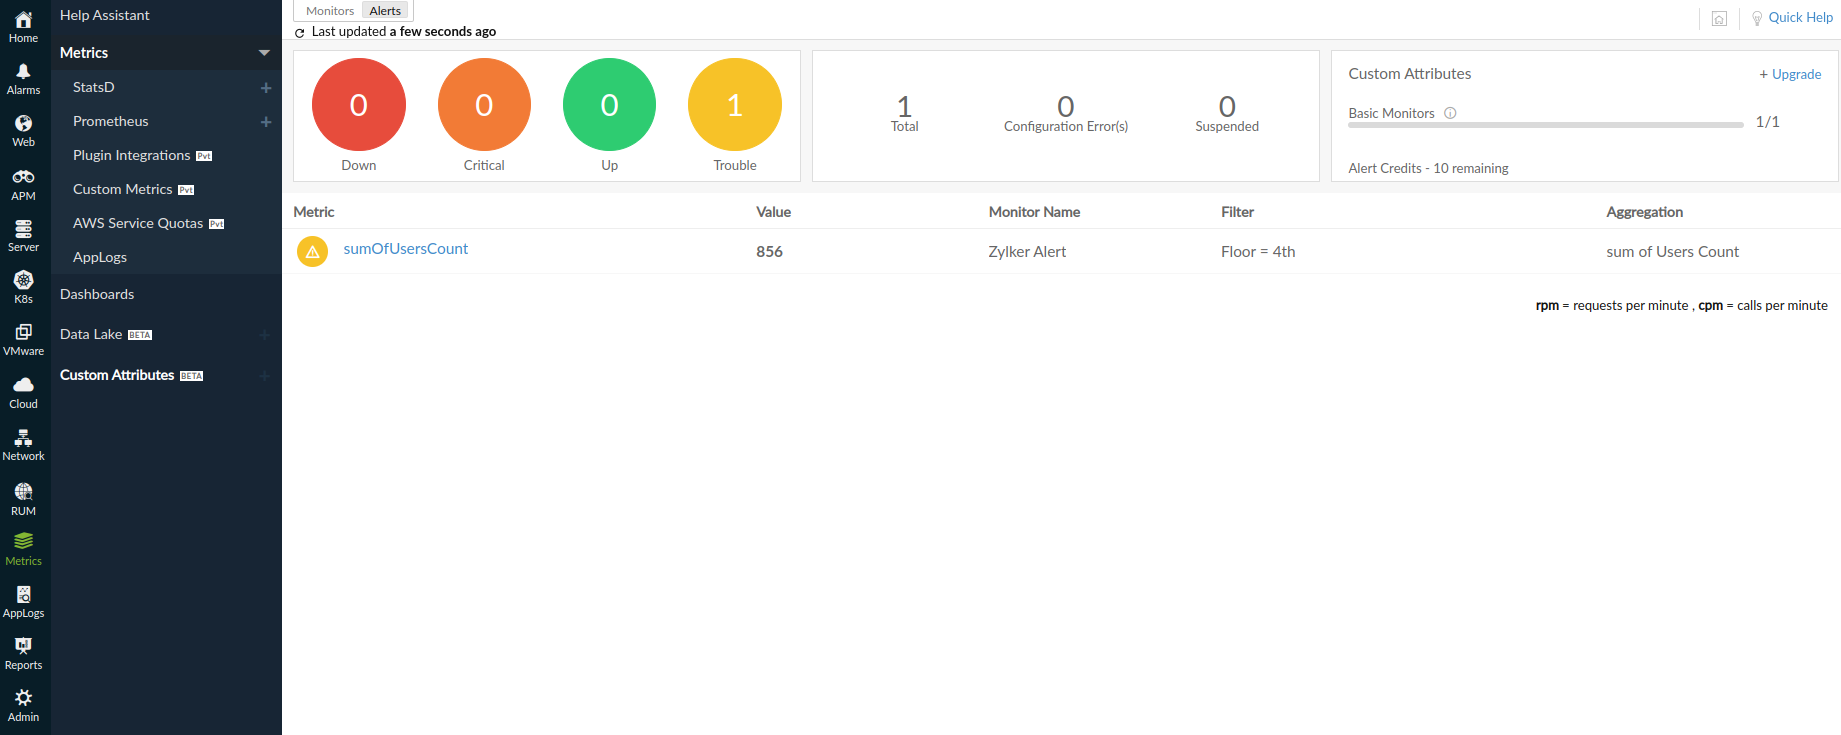
Performance metrics
You can click on the required monitor to view the performance metrics of the custom attributes added to it. On the right corner, you can also decide on the time frame for which you need the metrics.
Dashboard tab
This tab displays information such as the data source (the data lake monitor from which the fields are taken to create the respective custom attributes monitor) and the parent monitor of the data source monitor. You can also view the numeric widgets and single-line charts for all custom attributes.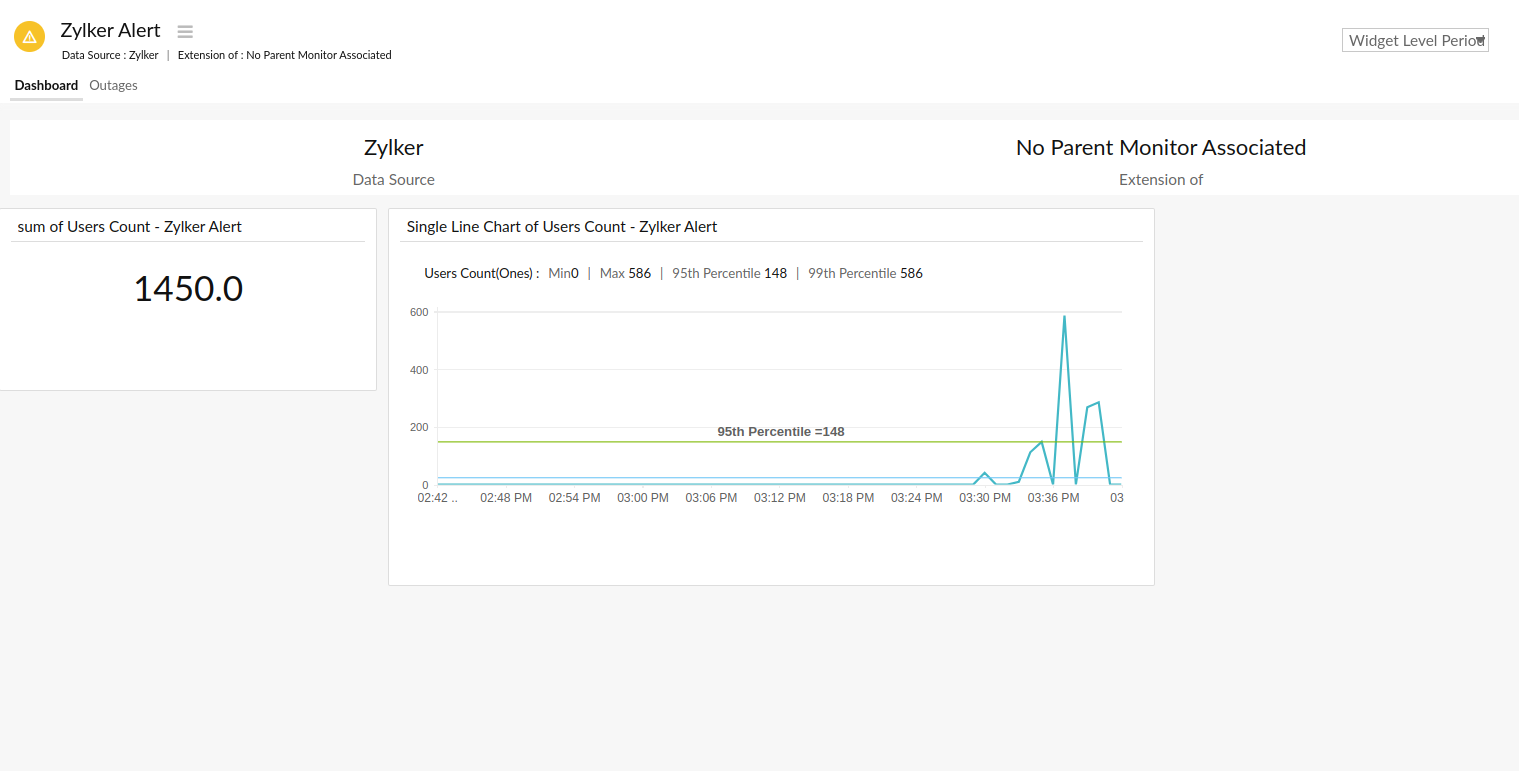
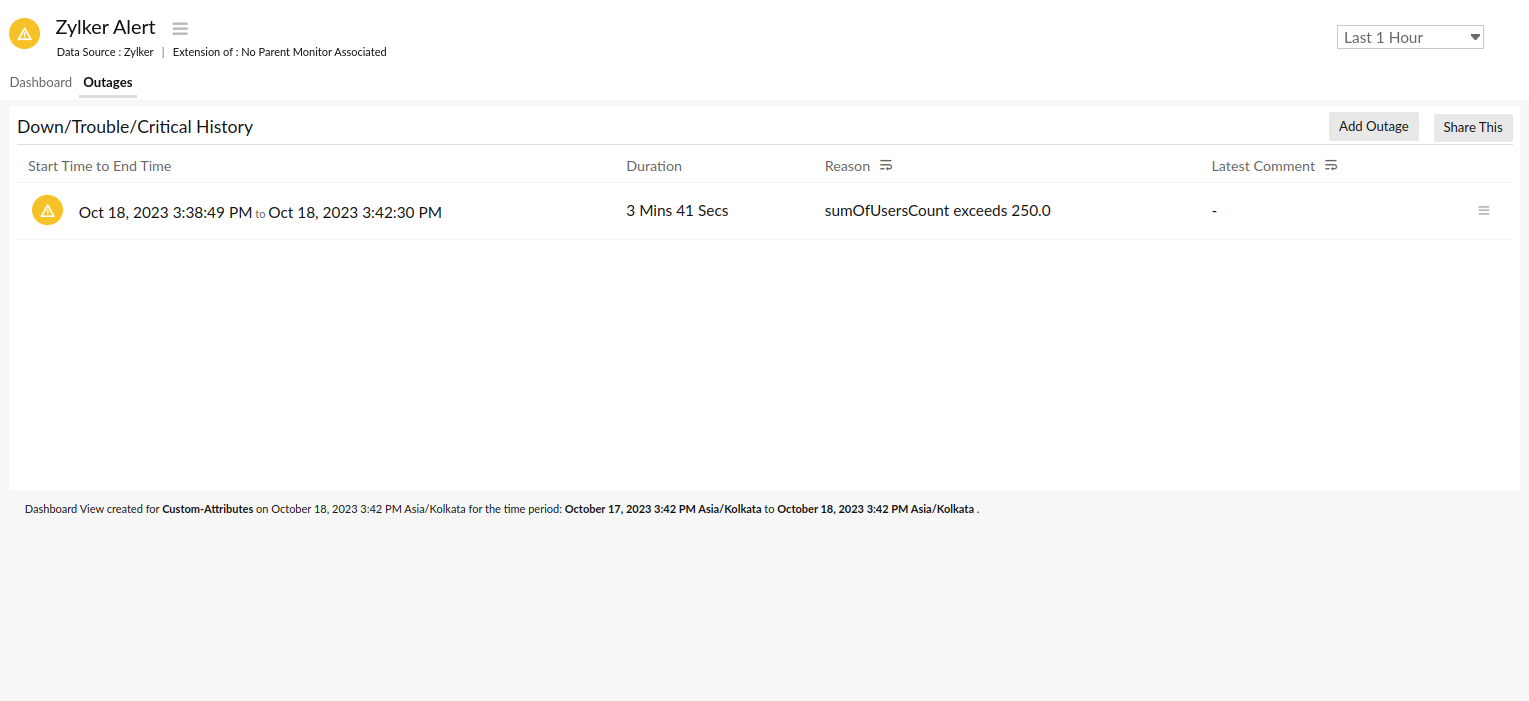
Outages tab
Gives an overall summary of the Trouble/Critical history of the selected monitor with information on Duration, Reason, and Latest Comment.
You can click the hamburger icon (![]() ) to Add/Edit Comments, or even Delete any outages if it is irrelevant.
) to Add/Edit Comments, or even Delete any outages if it is irrelevant.