Network Health Dashboard
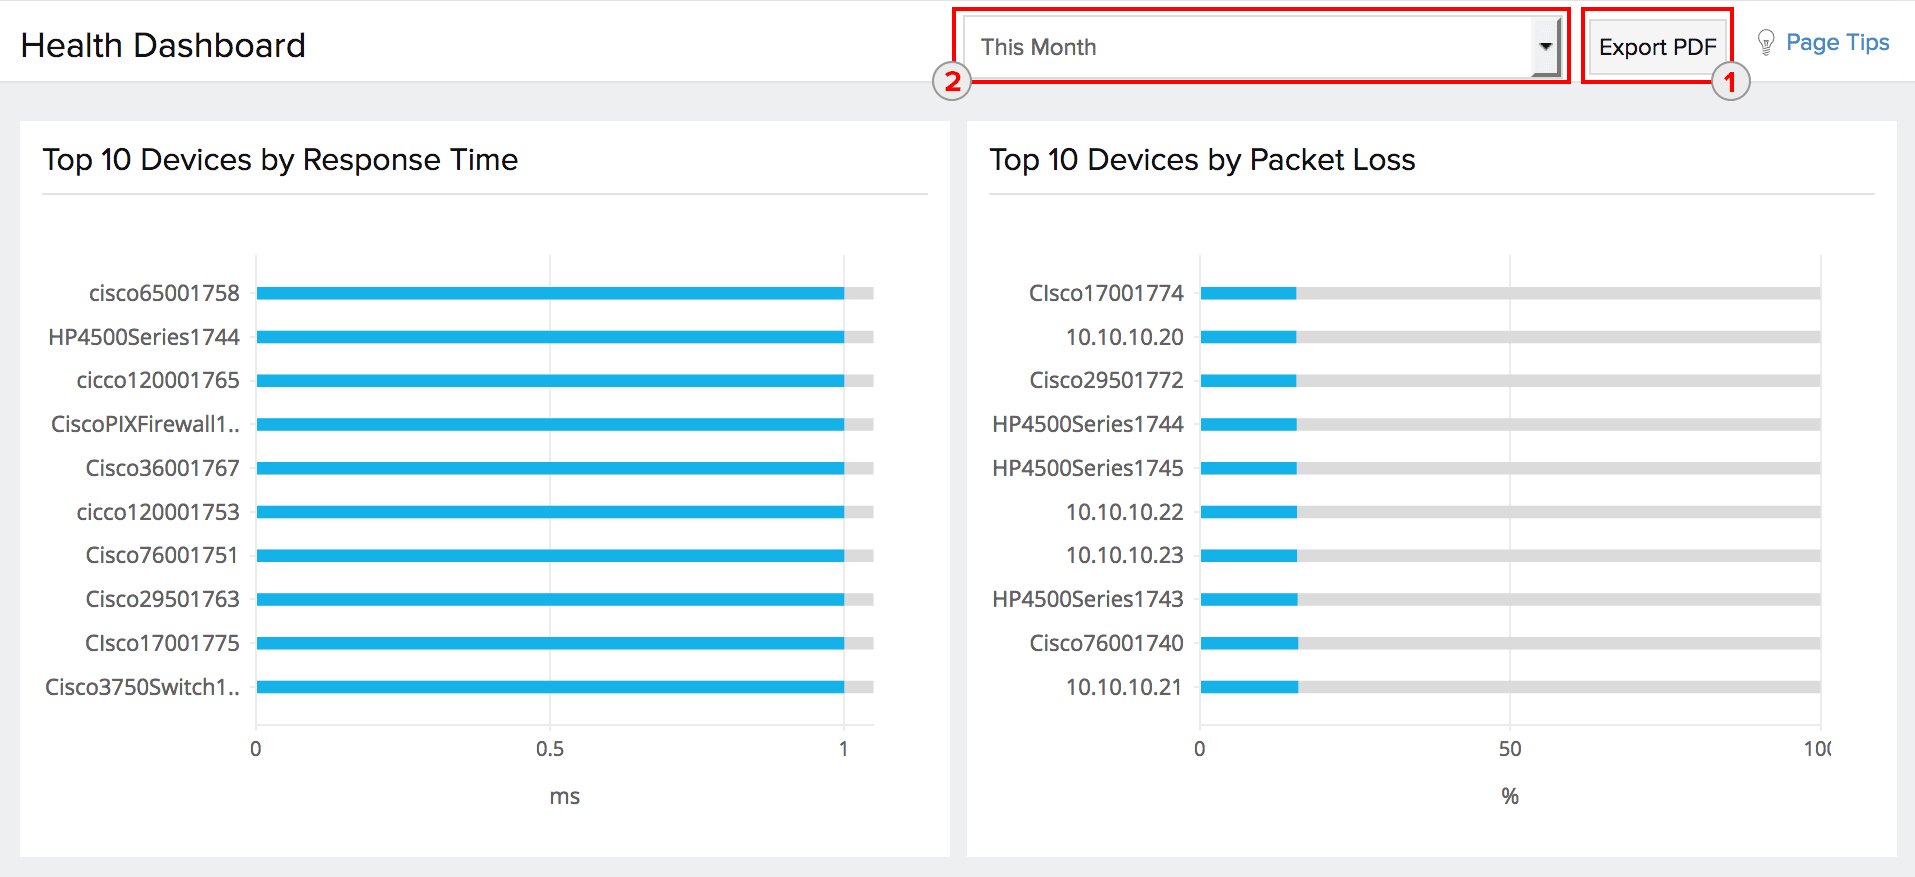
Get a clear picture of your network performance with stats on the top performing network devices and interfaces. With Site24x7's Health Dashboard, you can analyze the top network devices based on response time and packet loss. You can also display the top 10 network interfaces under each of the following categories: out traffic, in traffic, transmitting bandwidth utilization, receiving bandwidth utilization, out errors, in errors, out discards, and in discards.
How can I access the Health Dashboard?
- Log in to your Site24x7 account.
- Go to Network > Health Dashboard.
How can the Health Dashboard help me?
In an environment with thousands of network interfaces, a slow network is a common problem. Identifying which interfaces are using the most bandwidth can help you manage your network.
What can I see on the Health Dashboard?
- Top 10 devices by response time (in milliseconds).
- Top 10 devices by packet loss (as percentages).
- Top 10 interfaces by out traffic (in bits/second).
- Top 10 interfaces by in traffic (in bits/second).
- Top 10 interfaces by transmitting bandwidth utilization (as percentages).
- Top 10 interfaces by receiving bandwidth utilization (as percentages).
- Top 10 interfaces by out errors.
- Top 10 interfaces by in errors.
- Top 10 interfaces by out discards.
- Top 10 interfaces by in discards.

What else can the Health Dashboard do?
- Click on the Export PDF button to export your health dashboard in .pdf format.
- Use the drop-down next to the export button to choose a time period. You can pull data from the last hour, the previous day, this week, last week, this month, and last month.

Related articles:
- Visualizing network monitoring
- Adding a network monitor
- Understanding network metrics
- Performance metrics of a network monitor