Best practices for database performance optimization

Proactive database performance monitoring is essential to maintain resource utilization and system performance. As data volumes grow, it is critical to monitor databases properly to deliver a seamless enduser experience, and lower IT infrastructure costs.
Pinpointing database issues as they occur can assist in faster troubleshooting, and keeping the health of the application intact. Without monitoring, database outages may go unnoticed, and lead to loss of business reputation and profit.
However, performance fine-tuning requires significant expertise to find out which SQL statement among the large volume of SQL statements in a database needs tuning. The process to determine this can be very time-consuming.
Regardless of the complexity, here are some best practices to follow to solve issues that accompany database performance tuning.
1. 100% database availability
The first step is to ensure all databases are online during business and non-business hours. This includes checking all nodes in a cluster to avoid a single database node handling the entire load.
Whether a stand-alone SQL server or a SQL cluster, Site24x7 SQL Monitoring provides the availability status, the number of downtimes, and cache hit ratio for your entire SQL database, including the status and performance of all the active and passive nodes.
2. Optimal resource consumption
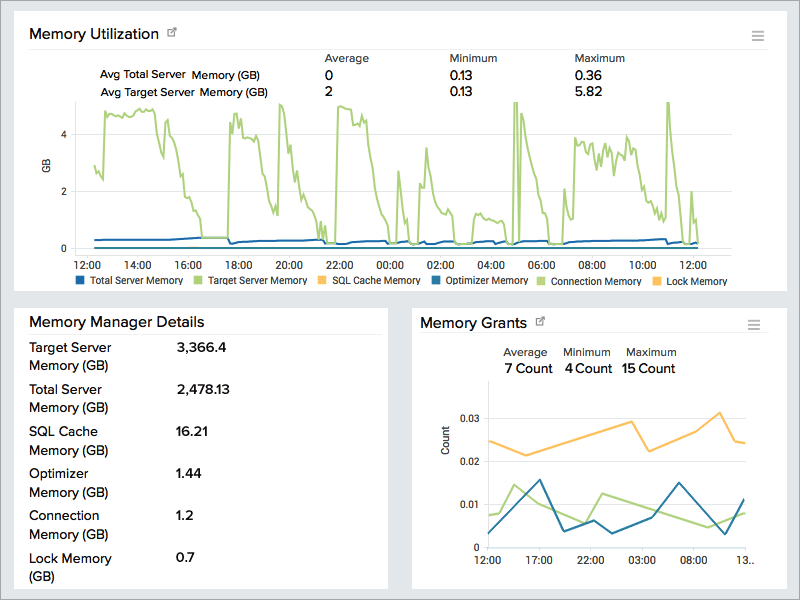
An important aspect of performance tuning is monitoring the resources utilized by the SQL servers. A deep understanding of the various infrastructure-related metrics, including page reads, page writes, memory and buffer manager details, and DevOps-related metrics like locks and latches is required for optimal capacity planning.
Site24x7 SQL Monitoring provides, in a single dashboard, details about the dynamic memory used by the server for cache, query optimization, and maintaining connections to the number of pages in the buffer pool, among other performance metrics.
3. Operational metrics
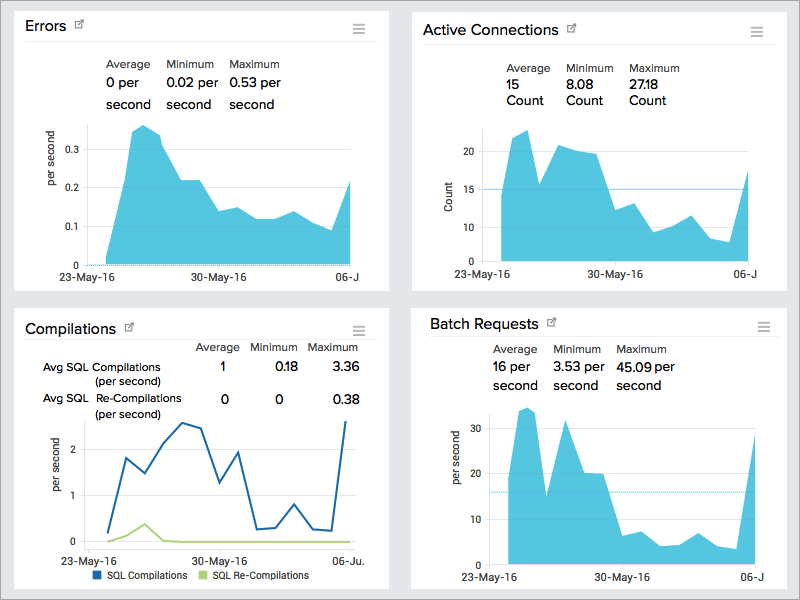
How much work your database is accomplishing can be determined by the number of active connections, throughput metrics including replications, errors, and transaction statistics. But, there is no definitive baseline for throughput measurement. The value from today can be used for comparing values for tomorrow.
For example, if the number of active connections is 30 during normal hours, and some action is required when it exceeds 50, an alert from a monitoring tool would provide a great head start to resolve the issue.
Site24x7 SQL Monitoring provides performance details of SQL databases, including errors, replications, SQL compilations, and longest transaction time of SQL instances with threshold settings for each of these metrics.
Site24x7 IT Automation enables you to automate actions, such as restarting an active node in the SQL service.
4. Inefficient and slow queries
Experiencing poor database performance in spite of optimal resource consumption and 100 percent availability? That may be due to slow queries, missing indexes, and more.
Site24x7 Application Performance Monitoring (APM) provides the total number of SQL queries executed for an application. APM also analyzes the time between a database query request and its response, and identifies where the wait is happening so you can determine which methods yield slowly executed queries.
5. Database Insight
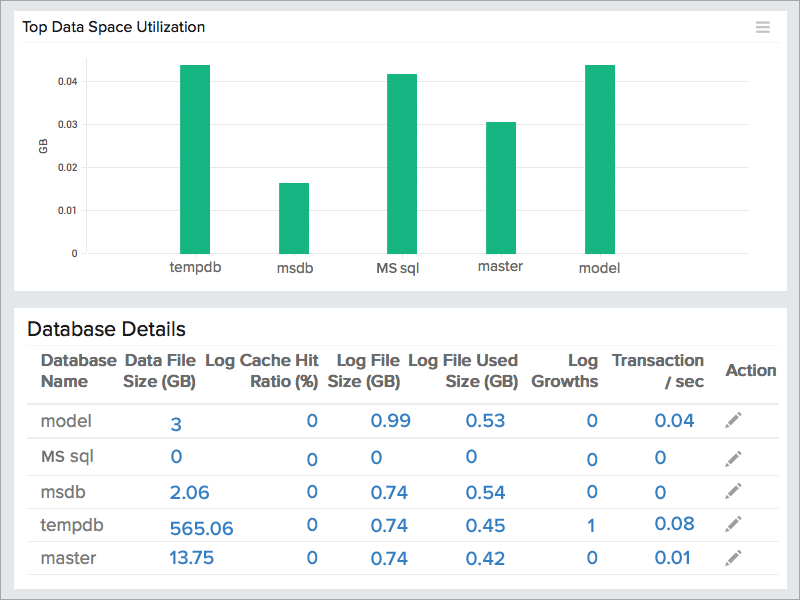
Any changes made to an application might add, modify, or remove database objects that could add millions of rows in a table. Any incorrect optimization might add an extra index to the table, leading to query delays. Monitoring changes in database schema can help prevent any potential performance impacts.
Capture database attributes, like data file size used, log file size, log cache hit ratio and more with Site24x7.
Not just SQL Databases
Site24x7 monitors, in addition to SQL databases, MySQL, Postgres, Cassandra, Oracle, and cloud databases hosted in Amazon Web Services (AWS), Microsoft Azure, and Google Cloud Platform (GCP). Similar to SQL databases, you can also set thresholds for various metrics that are provided for monitoring these databases and be instantly notified on any database outages.
Get Started
Site24x7 monitors all of the above and more with a single agent. Download the Site24x7 Server Monitoring agent to get your entire SQL cluster auto-discovered and added to Site24x7 for monitoring. Sign up for a 30-day free trial and start monitoring your enterprise's IT infrastructure from a single console.