Introducing DynamoDB and Application Elastic Load Balancer (ELB) monitoring
When you are running a complex business application on a dynamically changing cloud environment like AWS, things can get a little tricky. With multiple interconnected components powering your application, failure in any one can cascade and result in poor application performance ? leading to user frustration. Moreover, with the sheer number of services running, poor app performance can be attributed to any number of factors. From traffic spikes, instance resource constraints, to uneven ELB distribution and database bottlenecks, you have to keep your eye on a lot of things.
At Site24x7, we recognize this very well. To provide the user with more visibility into the AWS ecosystem, we have expanded our integration with the CloudWatch API, by including monitoring support for two new services ? Application Elastic Load Balancer and DynamoDB.
Getting to know the two AWS services
Application Elastic Load Balancer (ELB)
The functionality of any good load balancer is to sit in front of the application and route incoming client request to back-end servers. Even if one of the servers go down, high availability should be ensured by redistributing the requests to other servers. The Application ELB can achieve this and a whole lot more. Operating at the layer 7 of the OSI model, it can intelligently route requests to different back-end servers by using the URL path of the HTTP requests. If you are using containers to power micro services, then this feature can come quite in handy. Instead of running multiple copies of the same application on different EC2 instances, you can break down the functionality of your enterprise application into loosely coupled micro services, and run each heterogeneous service on individual containers. So instead of running multiple ELBs, you can load balance your application using a single Application ELB.
Amazon DynamoDB
DynamoDB is a fully managed, distributed NoSQL Cloud Datastore, built for high availability and scalability. It was designed initially to handle the reams of retail data, coming out of the Amazon platform and was made publicly available in the year 2012. Since then, it has evolved in leaps and bounds and has become the underlying storage technology for a number of organizations. Fast key-based access, location independence, flexible data model, cross region replication and a whole host of other factors have made it the popular choice for today's complex business application.
All these organizations, want production level visibility into their dynamically changing cloud infrastructure. Our integration with Amazon Web Services is designed to provide you the very same.
How Site24x7 collects DynamoDB and Application ELB metrics
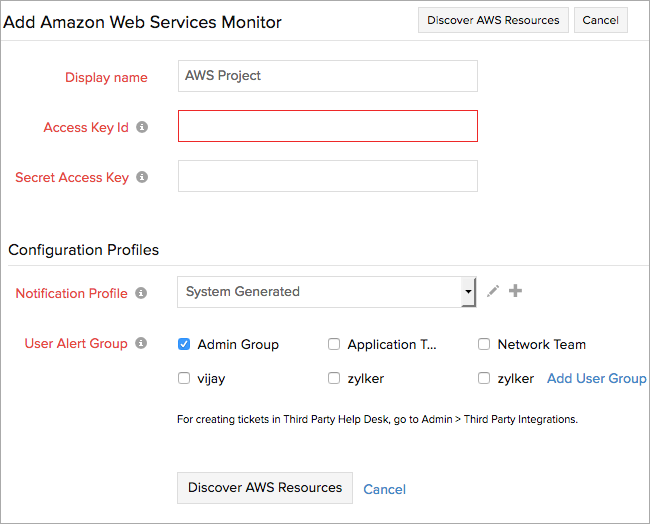
Site24x7 programmatically accesses the CloudWatch API and pulls metadata and performance metric data points for all its supported services. Our Seamless integration with Amazon Web Services lets you setup and configure monitors with ease. Our initial setup process is similar to all our supported AWS services, all you have to do is
- Create Site24x7 as an IAM user
- Assign ReadOnly permissions, by either using the default ReadOnly policy or by pasting the custom policy JSON
- Copy and paste the generated ?Secret Access Key? and ?Access key id? into the Site24x7 Client and sit back while we discover all your AWS resources.
With this integration, you can
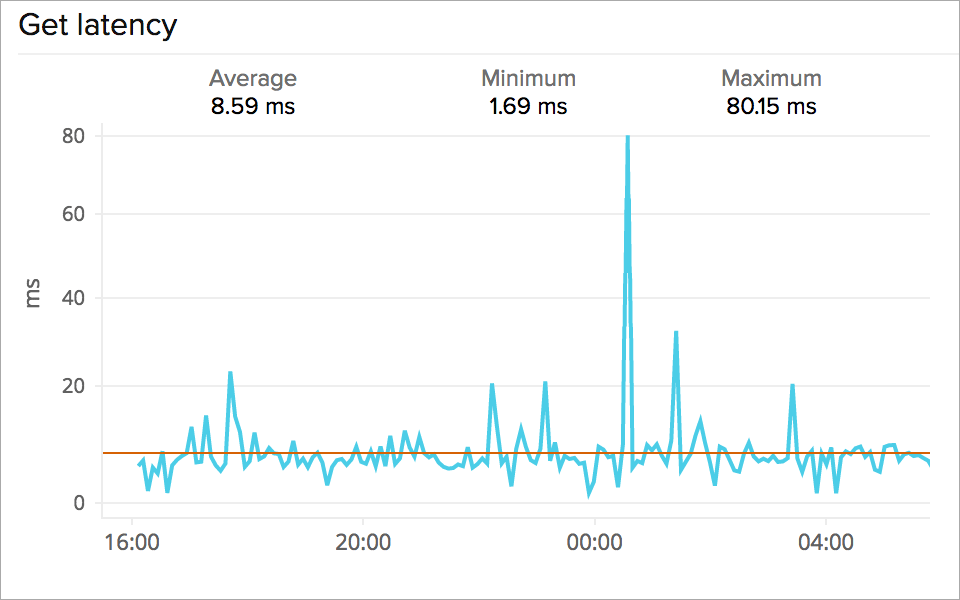
- Capture and analyze critical performance metrics, monitor them on a daily basis, identify latency issues, throughput limitations, error exceptions ? and take remedial actions to correct them.
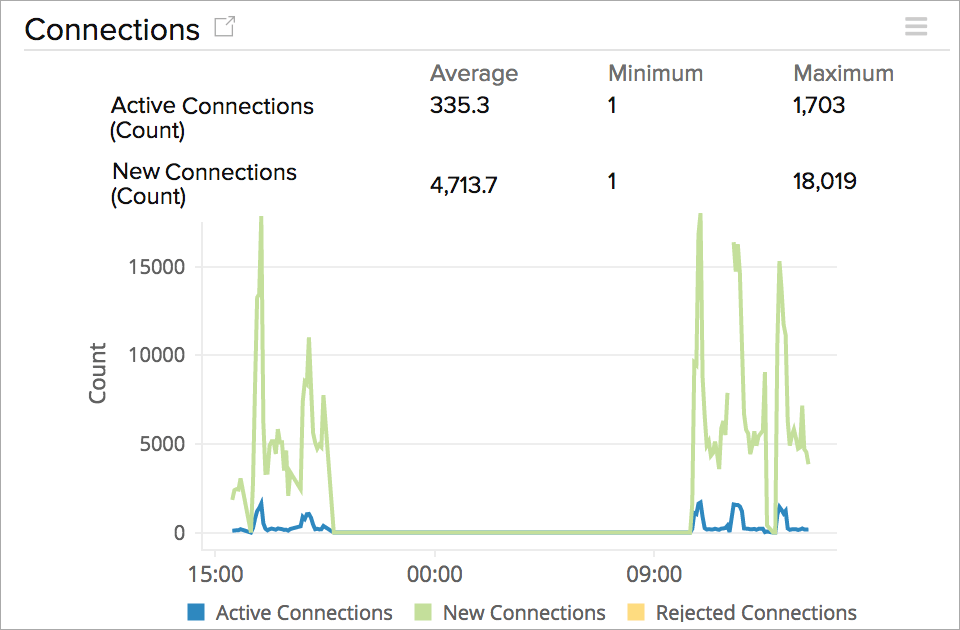
- Get our out-of-the-box pre-populated dashboards, to help you visualize all your performance metrics. So you can quickly gauge the operational health of your DynamoDB tables and Application Elastic Load Balancer nodes.
- Pair your standard CloudWatch metrics with our intelligent alerting mechanism. Set up thresholds on multiple metrics, configure alerting strategies and choose from a variety of notification channels to stay on top of performance issues.
- Get wholesome reports for your standard performance counters and a whole lot more.
Monitoring the two new AWS resources is easy, login to your Site24x7 account, (~Sign up, if you don't have one), update your policy permissions following our instructions and discover your DynamoDB tables and Application Elastic Load Balancer nodes.~If you are running other AWS services, then you can check our blog on SNS and Classic ELB to further understand your AWS environment.
Give this new integration a try, and let us know what you feel on our Forums. Happy monitoring!