Key metrics for monitoring JVM performance
It has been 25 years since Java came into existence, and it is still one of the preferred platforms among enterprise applications. As technologies evolved, Java's functionality and programming flexibility also matured in parallel, positioning it as a relevant language for over two decades. New memory management systems and garbage collection algorithms are an outstanding example of this evolution.
Even though Java has come a long way with more sophisticated algorithms that can work well with modern applications, you may still need to tweak your Java virtual machine (JVM) performance to meet your application’s needs. When it comes to scalability and performance, the needs and requirements of applications vary. That’s why you need to continuously monitor your JVM performance.
Here is a basic guide outlining key metrics that should be monitored.
1. Heap memory: Heap memory is the memory space that holds all the objects in your application. When there are more users accessing your application, performing a greater number of transactions, more and more objects containing request-specific data are created in heap memory.
Once the requests are served, these objects should be cleared or unreferenced. If they’re not, the objects will keep occupying the heap space, leaving no space for new objects. This leads to memory management issues, and your application may crash due to OutOfMemory (OOM) errors.
Heap memory issues can be split into two categories: scalability issues and improper coding practices.
Say your Java application has 2GB of heap space and you suddenly notice a spike in the number of users. This obviously increases the number of objects created in your JVM to serve these requests. This in turn consumes more heap memory, leading to application unavailability for certain users. This is a scalability issue.
When there is the usual traffic to your application but your application is performing poorly, one of the reasons could be that there too many referenced objects in storage, occupying more heap. This type of issue needs to be taken care of while developing your application, as it relates to improper coding practices.
This is where monitoring heap memory comes in handy.
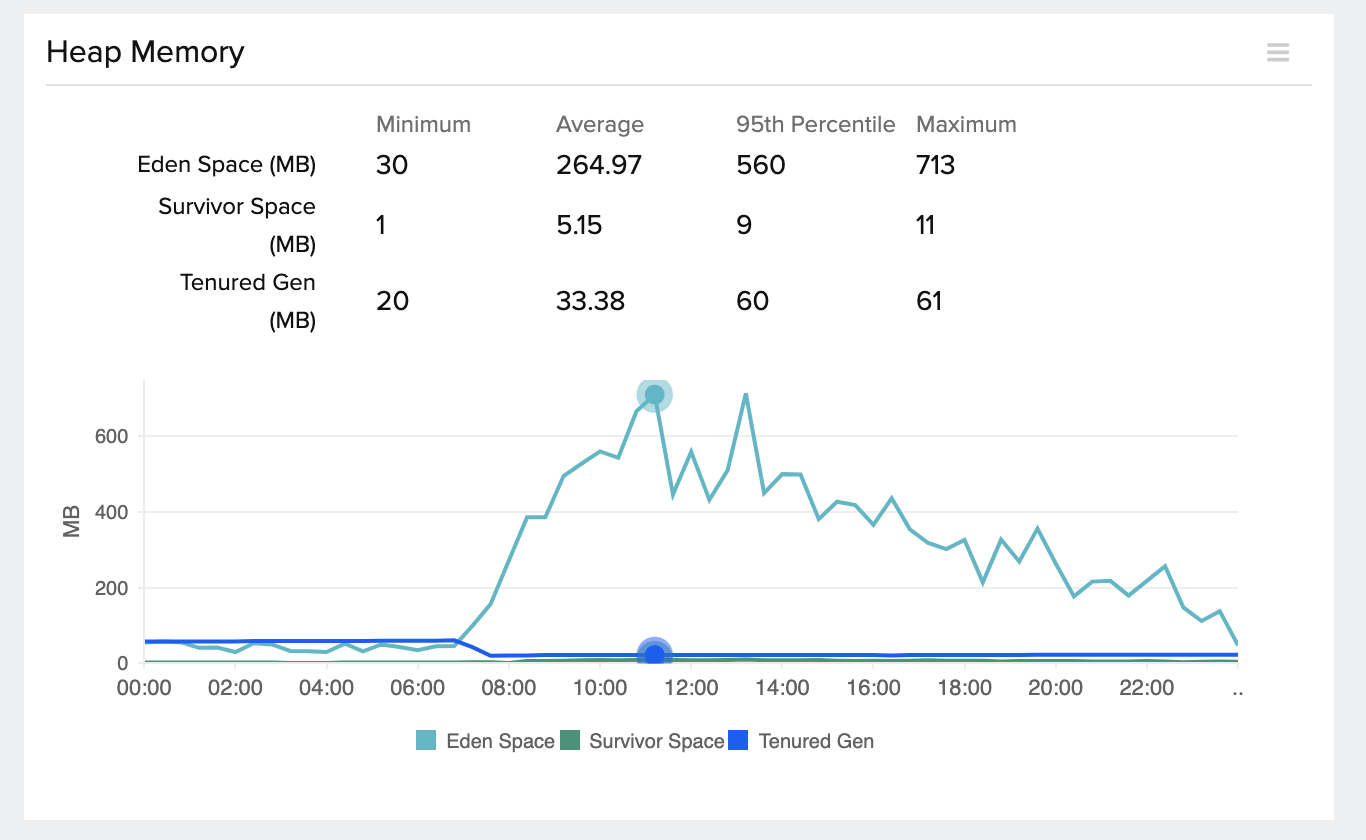
In the image above, we can see a sudden spike in the heap memory usage at a particular time. You can correlate the application response time with the number of requests and check if the spike is because of increased requests or an improper code base.
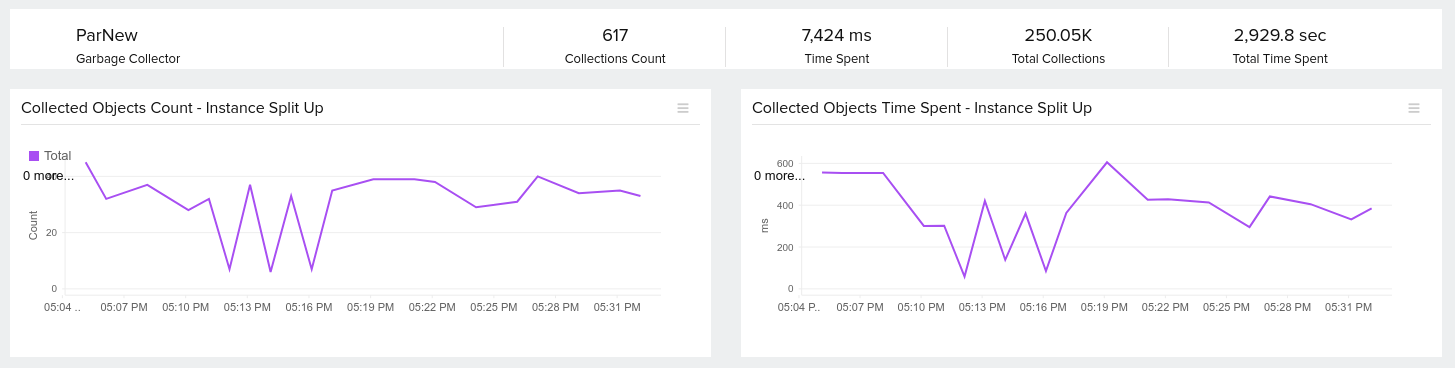
2. Garbage Collection (GC): Objects created in heap memory become unreferenced after serving their purpose. GC takes care of clearing these unreferenced objects from the heap, making space for upcoming objects.
When GC happens, Stop The World takes place—the entire application pauses till GC is complete. So when GC happens too frequently, this affects your application’s responsiveness.
From another perspective, if the time taken to garbage collect the unreferenced objects is too high, it also affects the application’s response time.
In short, too many unreferenced objects in the heap memory leads to excessive GC, and frequent exhaustion of heap memory leads to frequent GC.
These days there are a number of algorithms available to optimize the GC cycle. By monitoring the number of objects garbage collected and the time taken for GC, you can choose which algorithm works best for your application’s needs.
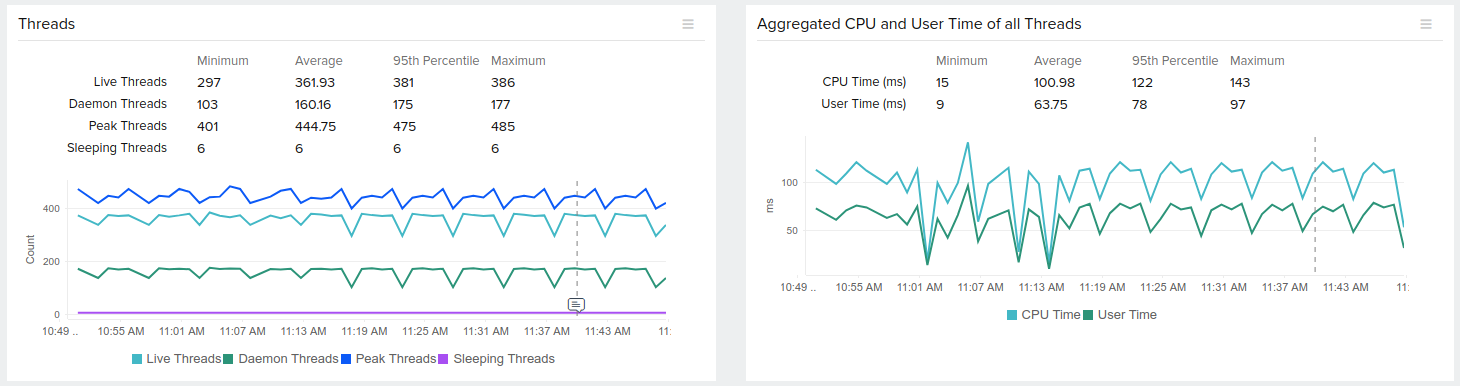
3. Threads: Threads are responsible for serving user requests. They do all the code execution to complete a request and send the response. It is important to have sufficient free threads to accept all user requests. If you don’t have enough threads, this will increase the wait time for a user request and in turn increase the application response time. When a thread takes a longer time to complete the user requests, it holds the referenced objects in the heap memory for a longer period of time. This in turn affects the memory space and may lead to OOM or GC issues.
As you can see, it’s necessary to monitor the number of busy and free threads. It is also important to monitor how much time the thread has spent in the CPU.
Even though Java provides default monitoring tools like JConsole and VisualVM, these tools only show the live data and do not come with any alerting mechanism. But with a monitoring tool like Site24x7, you can see historical data and compare metrics for two different scenarios. You can view the transaction-level metrics apart from the JVM metrics. If need be, you can also set alerts for these JVM metrics and be notified even before your users are affected.