The ultimate Kubernetes monitoring checklist
Monitoring in Kubernetes isn’t guesswork. It is a continuous process of validating that each layer, from control plane to the pod, is behaving as expected.
This Kubernetes monitoring checklist gives you specific, operational items to review so you can catch performance issues, misconfigurations, and security gaps before they escalate.
Why you need a Kubernetes monitoring checklist
Modern Kubernetes environments are dynamic, distributed, and complex. Without a clear monitoring strategy:
- Critical alerts get buried in noise.
- Resource issues go neglected until workloads crash.
- Security misconfigurations become easy attack vectors.
A proper checklist brings structure to your observability approach, ensuring that nothing falls through the cracks.
Kubernetes monitoring checklist
1. Cluster health and availability
Ensure the control plane, nodes, and namespaces remain stable and resilient to failures.
- Monitor the status and performance of control plane components: kube-apiserver, etcd, kube-scheduler, and kube-controller-manager.
- Track node readiness states (i.e., Ready, NotReady) and uptime to detect failures or reboots.
- Node conditions such as MemoryPressure, DiskPressure, and PIDPressure must be checked to preempt resource exhaustion.
- Validate namespace health by monitoring DNS resolution, service discovery, and cross-namespace communication issues. Misconfigured or failing namespaces can block workloads, even if the cluster appears healthy.
- Ensure core system components like kube-proxy and CoreDNS are running, stable, and not experiencing restarts or degraded performance.
- Monitor the underlying infrastructure—VM health, host network connectivity, and disk performance—to ensure the platform running Kubernetes remains stable.
2. Resource utilization
Track and optimize CPU, memory, disk, and network usage across nodes, pods, and containers.
- Measure CPU and memory usage at the node, pod, and container levels to detect hotspots and bottlenecks.
- Track disk and network I/O metrics at the node and pod levels to catch throughput limits or storage bottlenecks.
- Set up alerts for resource saturation (e.g., 90% CPU usage) at the container level to prevent noisy-neighbor issues and cascading failures.
- Compare resource requests vs. actual usage at the pod and container levels to rightsize workloads and optimize limits and quotas.
- Monitor resource quotas at the namespace level to prevent over-commitment and ensure fair resource distribution across teams.
3. Workload performance
Ensure applications run smoothly by monitoring pod health, restarts, and runtime errors.
- Monitor pod life cycle events like pending, crash loops, and OOMKilled errors.
- Track container restart counts and termination reasons.
- Measure application latency and error rates.
- Use readiness and liveness probes to catch failing containers early.
- Review application logs for runtime exceptions, failed dependencies, and service-level errors that may not be captured by metrics alone.
4. Network monitoring
Maintain reliable cluster communication by tracking throughput, latency, and DNS performance.
- Measure network throughput and packet loss at the node and pod levels to detect saturation or instability.
- Track service-to-pod and pod-to-pod latency latency between pods and services to uncover bottlenecks in intra-cluster communication.
- Monitor CoreDNS resolution times DNS resolution times to ensure services are discoverable and not slowed by lookup delays.
- Detect network errors and retransmissions that may signal failing interfaces, misconfigured CNI plugins, or congested links.
- Validate Kubernetes NetworkPolicies to ensure segmentation rules are applied and not bypassed.
- Correlate network performance with Kubernetes application metrics to distinguish between infrastructure-level network issues and app-level latency.
5. Security monitoring
Protect your cluster by auditing activity, detecting threats, and enforcing secure configurations.
- Enable audit logging to capture all API interactions and cluster-level activity.
- Monitor for anomalous access patterns, failed authentications, and privilege escalation attempts at both the control plane and workload levels.
- Validate resource configurations with the help of Guidance Reports regularly to detect insecure defaults, exposed ports, or privileged workloads.
- Track changes to RBAC roles, bindings, and service accounts to pinpoint unauthorized privilege grants.
- Detect violations of PodSecurityPolicies and flag non-compliant workloads.
- Monitor control plane components (e.g., kube-apiserver, etcd, kube-scheduler, kube-controller-manager) for configuration drifts, unauthorized access attempts, and certificate or credential expiration.
- Use a Kubernetes change tracker to audit configuration drifts and detect unauthorized or unexpected changes in real time.
Security tip: Regularly validate your environment against a Kubernetes security best practices checklist to ensure consistent hardening across clusters.
6. Logging and tracing
Centralize logs and traces to accelerate root cause analysis and performance troubleshooting.
- Aggregate logs from all application pods, system components, and namespaces into a central location.
- Correlate log entries with metrics, events, and alerts to improve root cause identification and resolution time.
- Implement log retention policies to meet audit, forensic, or compliance requirements.
- Standardize log formatting (e.g., JSON with labels like pod, container, namespace) to enable efficient search and filtering.
- Implement distributed tracing across services using tools like the Site24x7 Distributed Tracing tool to analyze request paths, service latency, and failure points in microservice architectures.
7. Events and alerting
Stay proactive by monitoring critical events and configuring meaningful alerts.
- Watch Kubernetes events in real time for failed mounts, eviction warnings and other critical events.
- Configure alerts for high-impact scenarios like failed deployments and node drain.
- Set alert thresholds based on historical trends, not just static values.
- Group-related alerts are used to avoid noise and alert fatigue.
8. Service discovery and networking
Monitor service endpoints, traffic flow, and ingress performance for reliable connectivity.
- Gain insight into the service endpoints and DNS lookups.
- Trace intra-cluster traffic and identify latency hotspots.
- Envision service-to-service dependencies.
- Detect network policy violations or service disruptions.
- Monitor ingress controllers and service meshes to ensure reliable routing, enforce policies, and detect TLS handshake or routing failures.
9. Cost visibility
Link cluster efficiency to business outcomes by analyzing usage, waste, and spend.
- Break down resource usage by namespace, service, and team to track ownership and accountability.
- Identify idle resources and overprovisioned pods to optimize cloud spend.
- Correlate cost with performance metrics to inform scaling decisions and prevent overspending on underutilized capacity.
- Extend monitoring to include business KPIs, such as cost per transaction, per customer, or per request, to connect cluster efficiency with business outcomes.
- Use these insights to drive FinOps practices, ensuring both engineering teams and finance have visibility into Kubernetes spend.
Kubernetes security checklist: Highlights
Security is tightly linked to monitoring. Make sure your checklist includes these key practices:
- Use RBAC with the PoLP.
- Disable anonymous access to the API server.
- Regularly rotate certificates and credentials.
- Enable network policies to control pod-to-pod traffic.
- Enforce image provenance and only allow trusted registries.
Automate Kubernetes monitoring with Site24x7
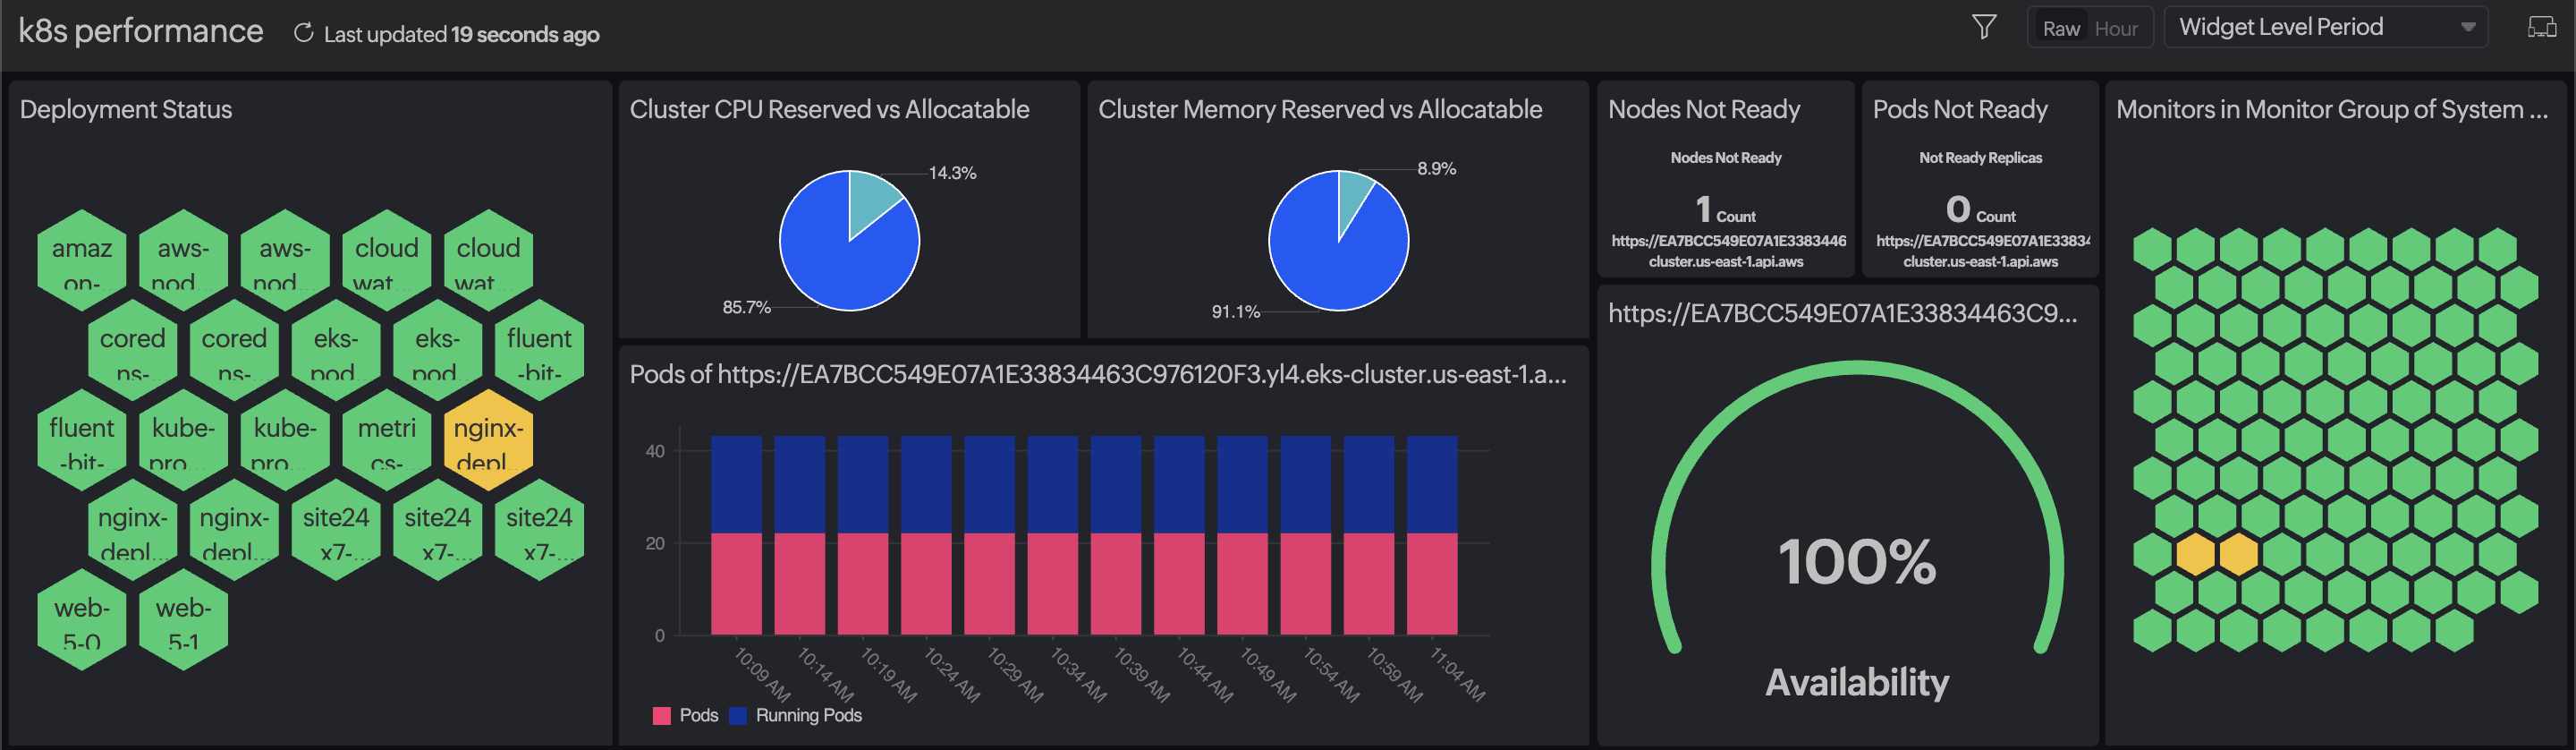
Manual checks only go so far. Site24x7's Kubernetes monitoring helps you:
- Automatically discover and monitor all cluster components.
- Get full-stack visibility into control plane, workloads, and nodes.
- Receive alerts on resource saturation, pod failures, and node issues.
- Track real-time Kubernetes events and logs.
- Enforce security guardrails through configuration insights and policy checks.
Final thoughts
A structured Kubernetes checklist is more than a to-do list—it’s your blueprint for reliable operations and secure deployments. Build it into your CI/CD workflows and monitoring pipelines to keep your clusters healthy and your teams productive.
Looking for automated Kubernetes monitoring with built-in security alerts and smart dashboards? Try Site24x7 Kubernetes monitoring today!