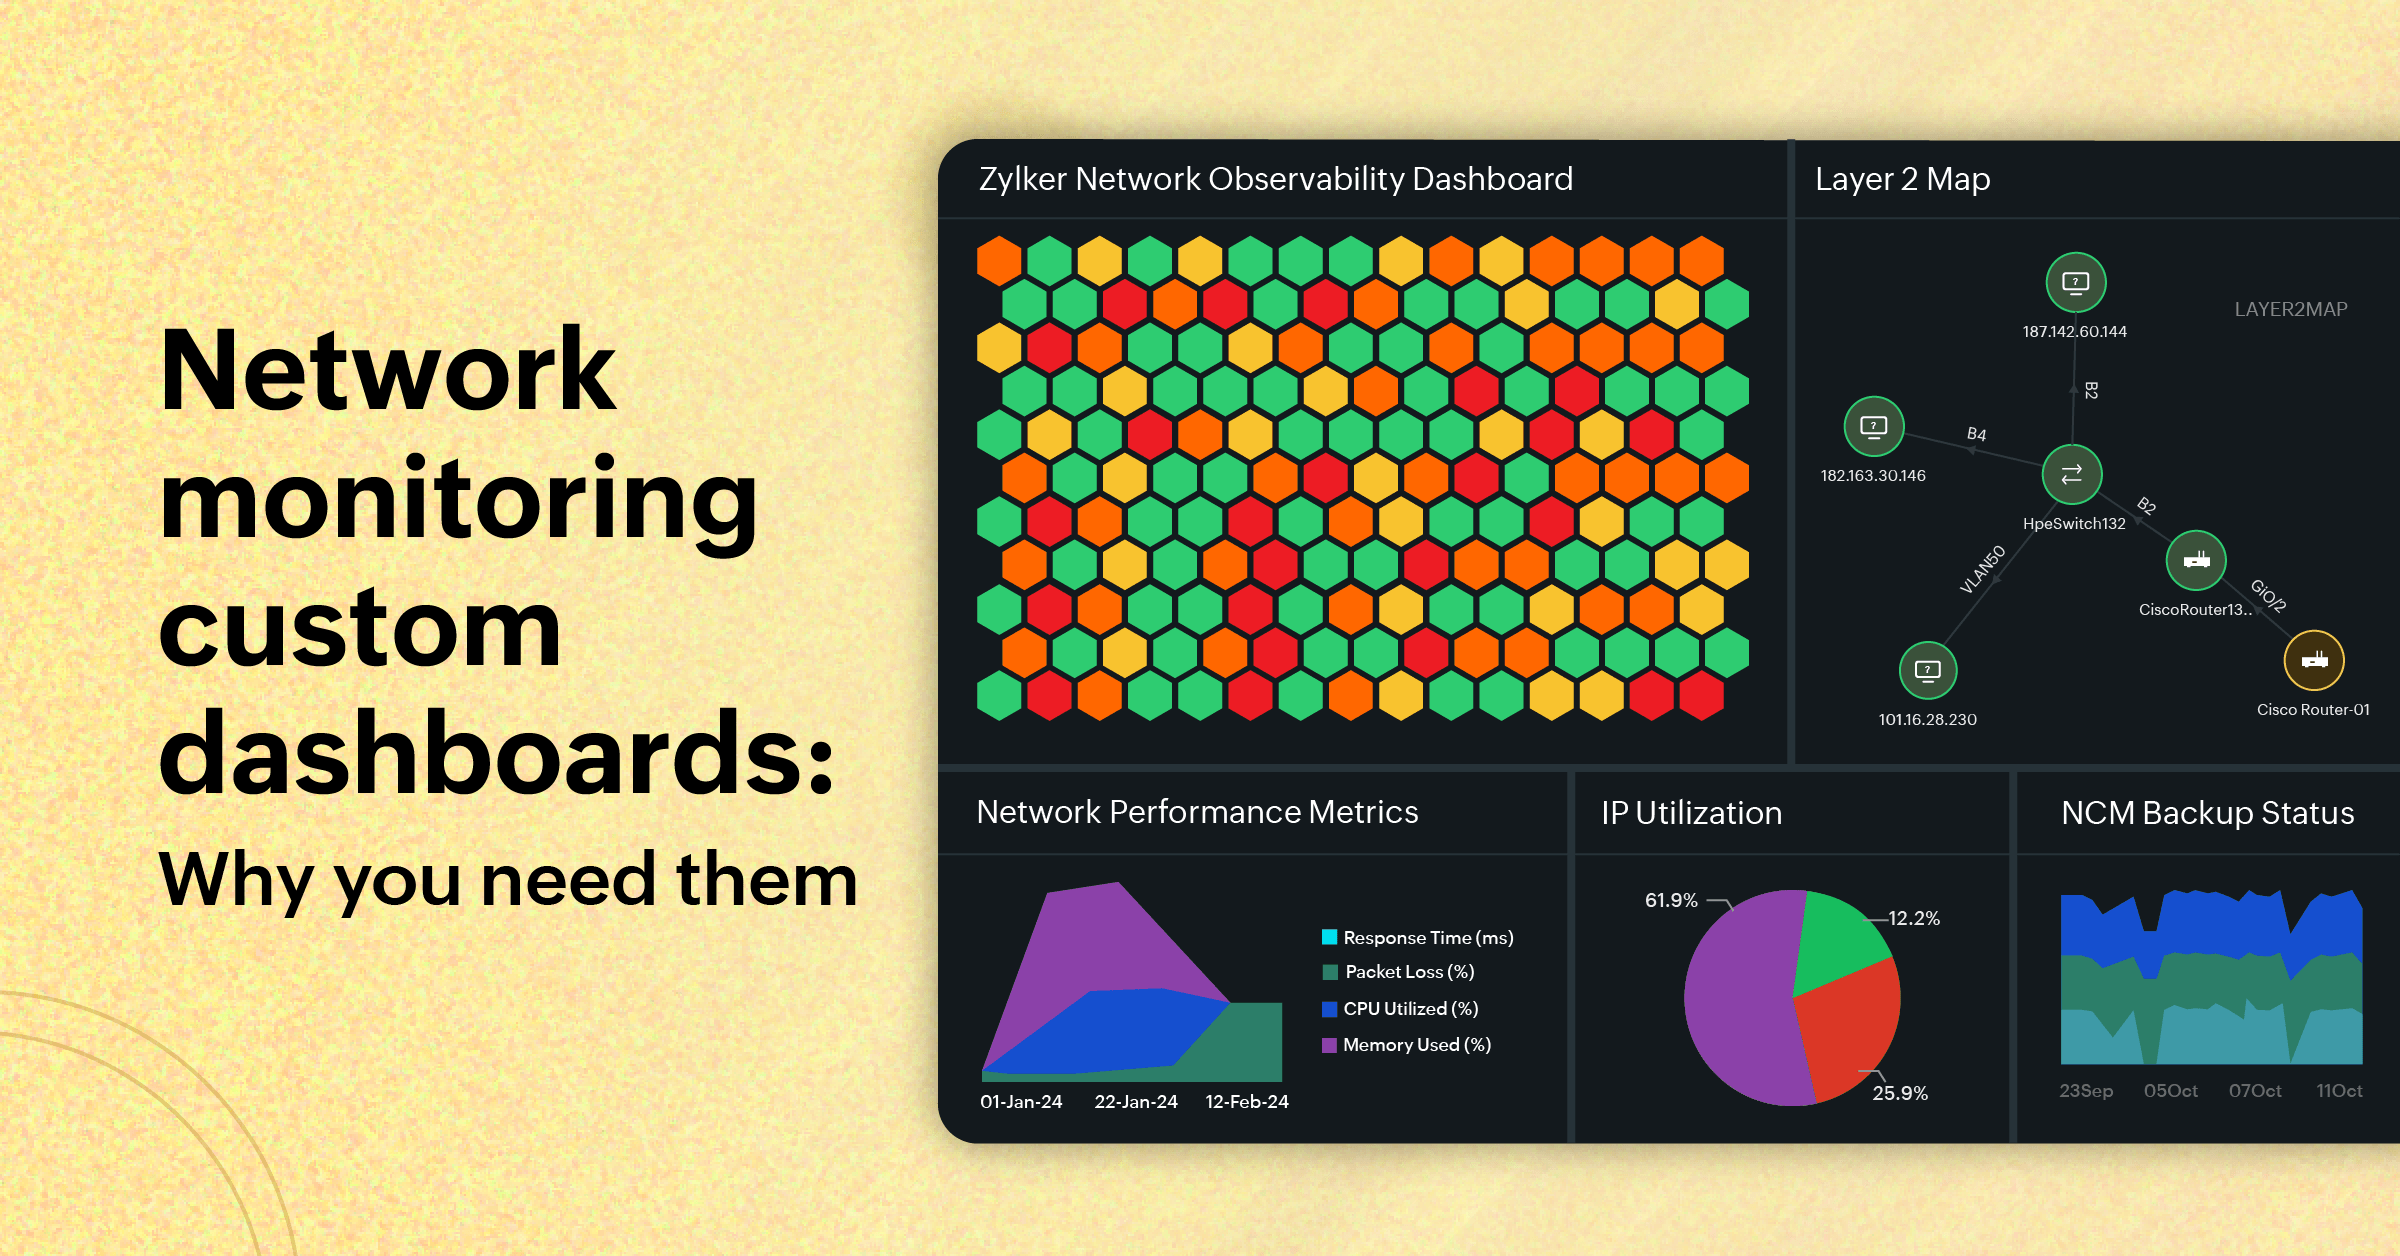
Creating custom dashboards for network monitoring with Site24x7

Instead of sifting through mountains of metrics across different network types, what if you had an AI-powered tool that could display all the necessary insights in an easy-to-understand format?
Visual analytics can help enterprises make informed, data-driven decisions. With Site24x7, organizations can break free from generic monitoring and design custom dashboards tailored to their unique operational needs. Whether it’s tracking bandwidth utilization, ensuring network uptime, or tracking configuration changes, custom dashboards help enterprises visualize and act on what truly matters, thereby helping them make significant cost reductions and process improvements across their central functions. In this blog, we’ll explore how you can leverage Site24x7’s powerful customization features to build impactful dashboards to improve network observability.
Why custom dashboards matter while monitoring networks
Network monitoring dashboards are often the first touchpoint for identifying performance bottlenecks, security anomalies, and operational inefficiencies. However, generic dashboards may not reflect the unique needs of an enterprise.
Custom dashboards help to:
Custom dashboards help to:
- Consolidate key metrics: Display only the data that’s most relevant to your operations.
- Enhance decision-making: Provide clear, real-time insights to help teams make informed decisions.
- Boost efficiency: Eliminate the noise by focusing on mission-critical metrics.
- Enable collaboration: Tailor dashboards for specific teams, such as network admins, security teams, and C-suite executives.
- Provide one view for all your networks: Add relevant metrics for both your on-premises networks and SDNs in one window for a holistic view.
Getting started with Site24x7’s custom dashboards
Site24x7 offers intuitive tools for creating and managing custom dashboards. Follow these steps to build dashboards that cater to your unique network monitoring needs:
- Identify your monitoring goals
Before diving into customization, determine the key metrics you need to monitor. In general, these include: - Network uptime: Keep tabs on availability across distributed locations.
- Bandwidth utilization: Monitor traffic levels to prevent overloading.
- Latency metrics: Ensure smooth WAN and VoIP performance.
- Security alerts: Identify unusual traffic patterns or potential breaches by tracking transmitting and receiving volume.
- Configuration changes: Track the backup status of a device's startup or running configuration.
- SDNs and SD-WANs: Add metrics like device availability, response time, and packet loss for SDNs and SD-WANs like Cisco ACI, Cisco Meraki, and VMware VeloCloud.
- Access the dashboard settings
Log in to your Site24x7 account and navigate to the Dashboards section. Select Custom Dashboards to start building from scratch or modify an existing template. - Add widgets to your dashboard
Widgets are the building blocks of Site24x7 dashboards. Each widget represents a specific metric or visualization. Site24x7 offers a diverse library of widgets, including: - Live NOC view
- Line charts
- Bar graphs
- Top N reports (e.g., top bandwidth-consuming devices)
- Pie charts
You can drag and drop the desired widgets into your dashboard canvas. Each widget can be configured to display data from specific devices, applications, or time ranges. Additionally, you can also include your maps in the network monitoring dashboard by using iFrame widgets and providing the map link. - Customize widget settings
Tailor each widget to your specific needs by: - Adjusting timeframes to match your operational monitoring windows
- Adding any widget as needed
- Design for user accessibility
Your dashboard should be intuitive and easy to interpret. Keep these design tips in mind: - Group related metrics: Place similar metrics, such as CPU and memory utilization, side by side.
- Track using color coding: Site24x7 highlights critical values in distinct colors (i.e., red for down, orange for trouble, green for normal, etc.).
- Share dashboards across teams
Once your dashboard is ready, use Site24x7’s sharing options to collaborate with your team. You can: - Share a direct URL link.
- Export the dashboard as a PDF or image.
- Set user permissions to control who can view or edit the dashboard.
Real-life use cases of custom dashboards
- Proactive bandwidth monitoring
Consider an enterprise using Site24x7’s custom dashboards to track bandwidth utilization across its global offices. By visualizing traffic spikes and bandwidth consumption patterns in real time, the team can optimize resource allocation and prevent network slowdowns during critical business hours. - Monitoring network latency in financial services
Suppose a financial services company leverages Site24x7 to monitor WAN round-trip time across its trading platforms. A custom dashboard can highlight WAN-related metrics and display irregularities, if any, thereby ensuring seamless transactions and compliance with stringent industry standards. - Enhancing uptime in e-commerce
For an e-commerce business utilizing Site24x7’s custom dashboards to monitor the uptime of its website and payment gateway, creating a network performance monitoring dashboard is a valuable strategy. This helps to reduce downtime, ultimately enhancing customer satisfaction during peak shopping seasons.
Best practices for effective dashboards
- Regularly review metrics: Ensure that your dashboard remains aligned with evolving business priorities.
- Leverage AI and automation: Use Site24x7’s AI-powered insights to identify trends and anomalies.
- Integrate with other tools: Connect your dashboards to ITSM platforms, such as ServiceNow or Jira, for streamlined workflows.
Transition to an evolved view of your networks
For many years, enterprises have had to meticulously track each network separately. Site24x7 changes all that by providing a single pane view for any enterprise.
Custom dashboards are more than just a visualization tool—they’re a strategic asset for enterprise network monitoring. With Site24x7, businesses can create dashboards that not only monitor but also empower teams to act proactively.
Custom dashboards are more than just a visualization tool—they’re a strategic asset for enterprise network monitoring. With Site24x7, businesses can create dashboards that not only monitor but also empower teams to act proactively.
Ready to build your custom dashboard? Sign up and take your network monitoring to the next level.
Comments (0)