Never Give Up: Introducing Custom Instrumentation for APM Insight .NET agent
There is no excellence without persistence and it holds true for every developer. In continuation to my previous musings as a developer, I am delighted to share another such incident.
When I had joined the company, the Java agent was already in the final stages of development. My interview was kick-started by the then team lead who wasn't an expert in the space of .NET, the exact technology for which I was being recruited for. After having to face some clichéd interview questions initially, my interview headed towards a more serious note where my technical know-how was evaluated, and I was tasked with solving some not-so difficult tech problems, which I managed to breeze through.~
As my interview progressed and reached its final stages, I was given a project description with a proposed code, asking if I could implement the same. One quick glance and I understood that the project detailed about how .NET profiler works and how it can instrument code at runtime to almost any method. I never knew that a profiler existed in .NET (duh!) but still managed to nod my head in acceptance. With that, I presume my interviewer was convinced and I was employed to implement the task. All this happened roughly 5 years back (truly feeling nostalgic here).~
It took us sometime to bring out the first version of the .NET agent that year. Then a tonne of features followed. However, one elusive feature that we couldn't do was the custom instrumentation, i.e instrumenting 3rd party or custom code at runtime. Great effort was involved in understanding the IL code, how the assembly code worked and the CLR translated the code at runtime, and how it was handled by the .NET compiler. The process was complex, unlike for Java which already had a 3rd party library.~ Nevertheless, we continued to explore and find ways to crack the code.
It was after great effort and perseverance that we finally launched the custom instrumentation feature in .NET agent. After much dedication and thought, we have put together a well versed, efficient and usable code that will enable tracking of errors in your application. With the custom instrumentation feature, you can bid adieu to the wild goose chase of tracing errors in your application, without having to change massive blocks of your code.
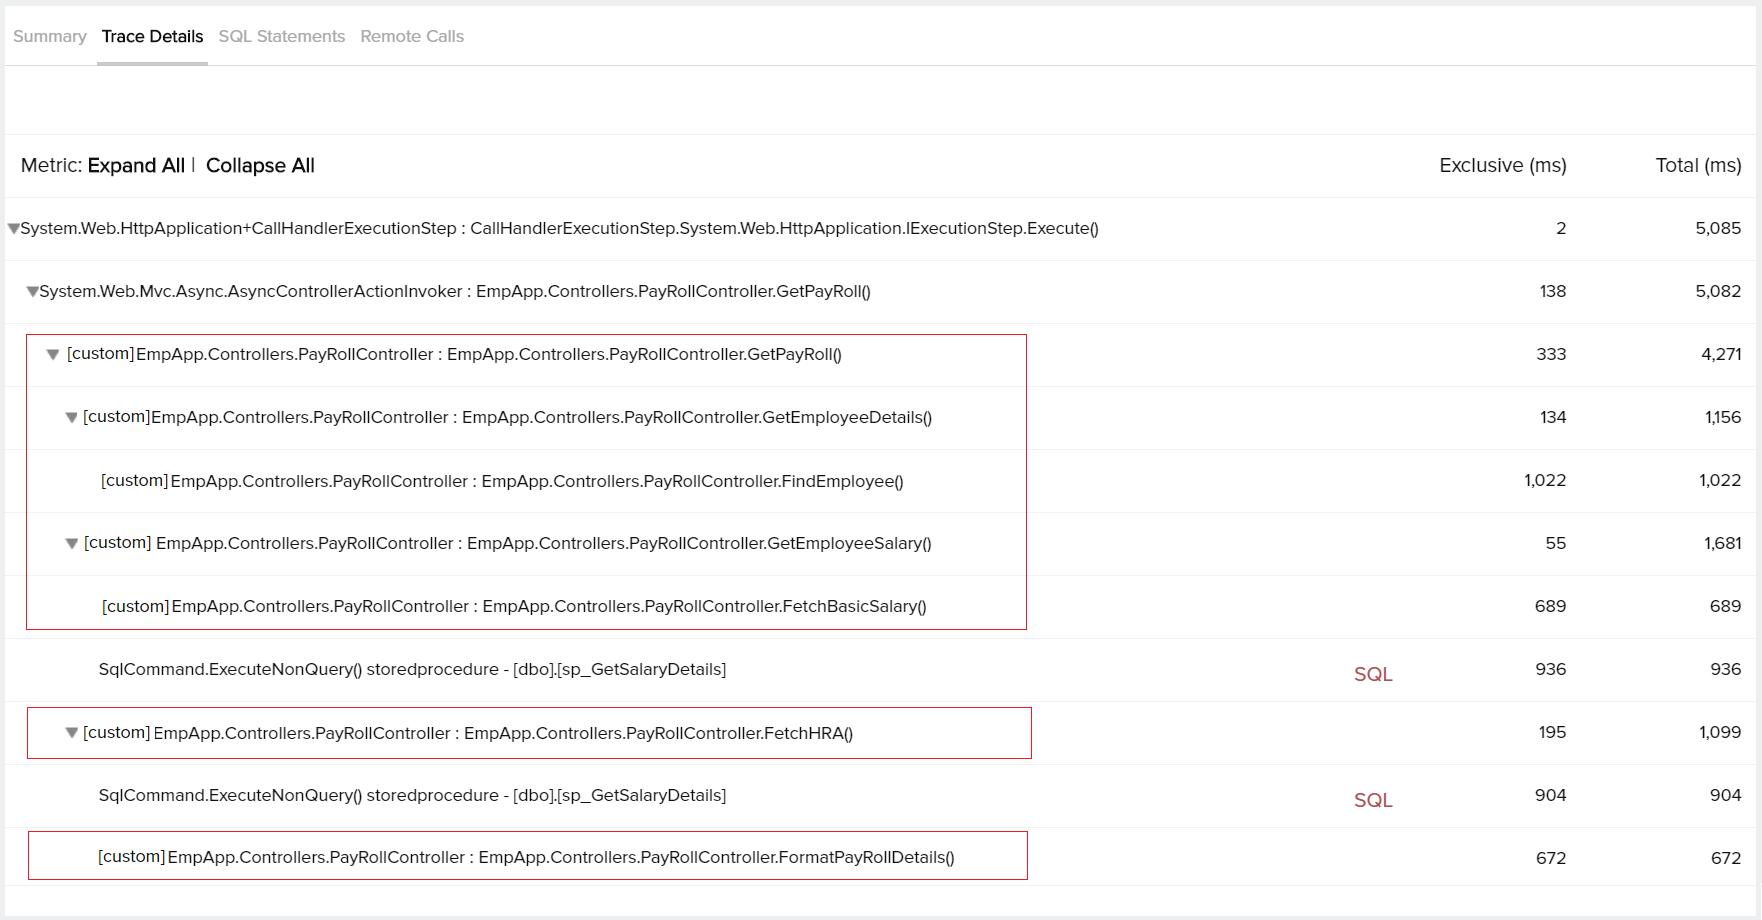
One can implement this feature either manually or by using our API manager tool. With the help of this feature,~ one can add or remove application specific methods that need to be tracked, recycle running application pools and can gain visibility into application DLL's necessary classes and its methods. In short, custom instrumentation helps you to identify the root cause of your performance issues at code level.~
So what are you waiting for? Try out the feature and share your thoughts. We value your feedback.~
Happy Monitoring!