i want to up time server name in custom dashboard but there is no tab , also add custom tab not work , please suggest how all the metrics, data show in custom dashboard.

Like (1)
Reply
Replies (1)
by Jenzo Thomas
Hi Shanker,
Thank you for reaching out!
I believe you want the dashboard to be added inside the monitor details page. For this, you should first create a custom dashboard and make it as a template to be added inside the server page. Please follow the steps below:
1. Go to Dashboards → Custom Dashboards → Create New Dashboard
2. Click + Add Widget and choose one of the following options based on what you need:
- NOC View (under Alarms / Current Status) — displays each server as a tile with its name and current status (Up/Down/Trouble)
- Availability Trend → Graph — shows uptime % trend per server with server names listed
- Numerical Widget (under Performance Attributes) — shows uptime % for a specific server with its name as the widget title
- Tabular Widget — lists multiple servers with their uptime % in a table format with server names
3. Once done, save the dashboard.
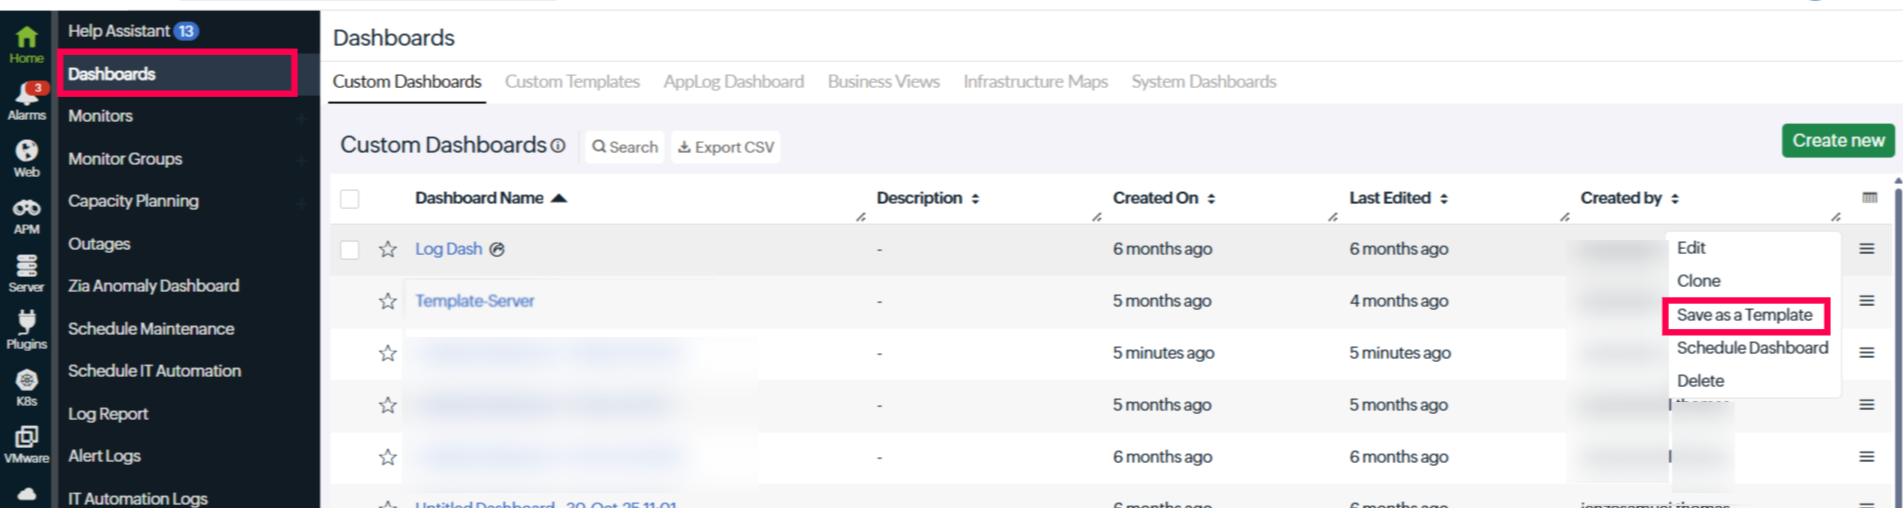
4. Now go to the Custom Dashboard list and at the right end of your custom dashboard hover over the hamburger icon, then click Save as Template.
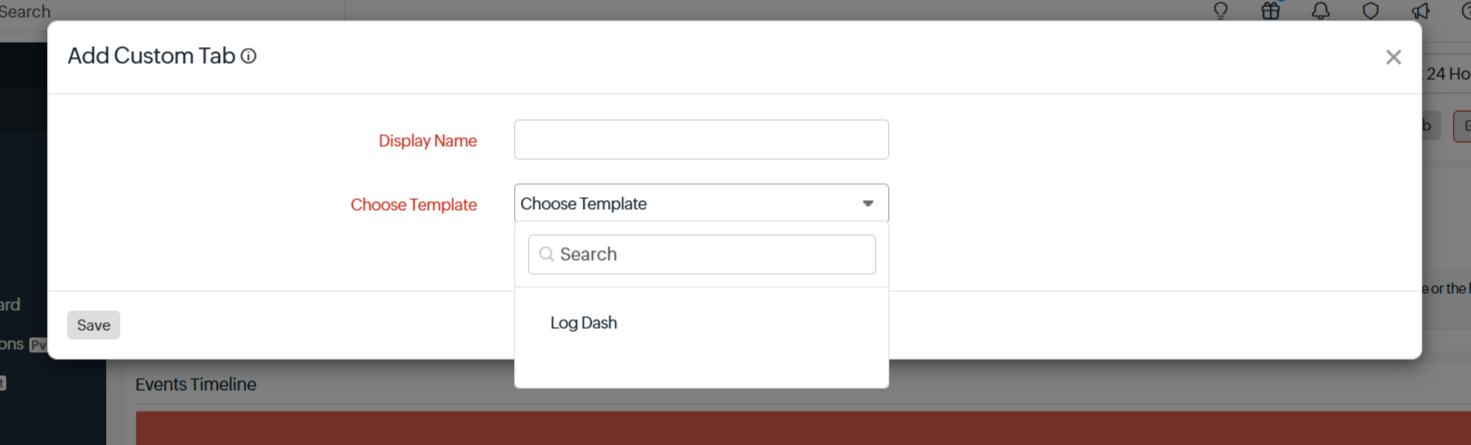
5. Now go inside the server monitor and click Add Custom Tab. Then from the Choose Template dropdown, select your custom dashboard. It will be added as a tab.
Hope this helps! Please feel free to reach out if you need any further assistance.
Regards,
Jenzo
Site24x7
Like (0)
Reply