Add the feature to get additional information in the APM exceptions , error logs alert email example details about the log path where error or exception occurred, currently we are just getting the error and exception count which is not sufficient for developers
this is basic functionality that Monitoring tool should have please add this asap
Hi,
Thank you for raising this request. We understand the importance of the feature. Bringing the exception details like the log path and the line of code, inside the alert mail itself is added to our roadmap. We will keep this space updated once we do the feature.
Regards,
Raji.
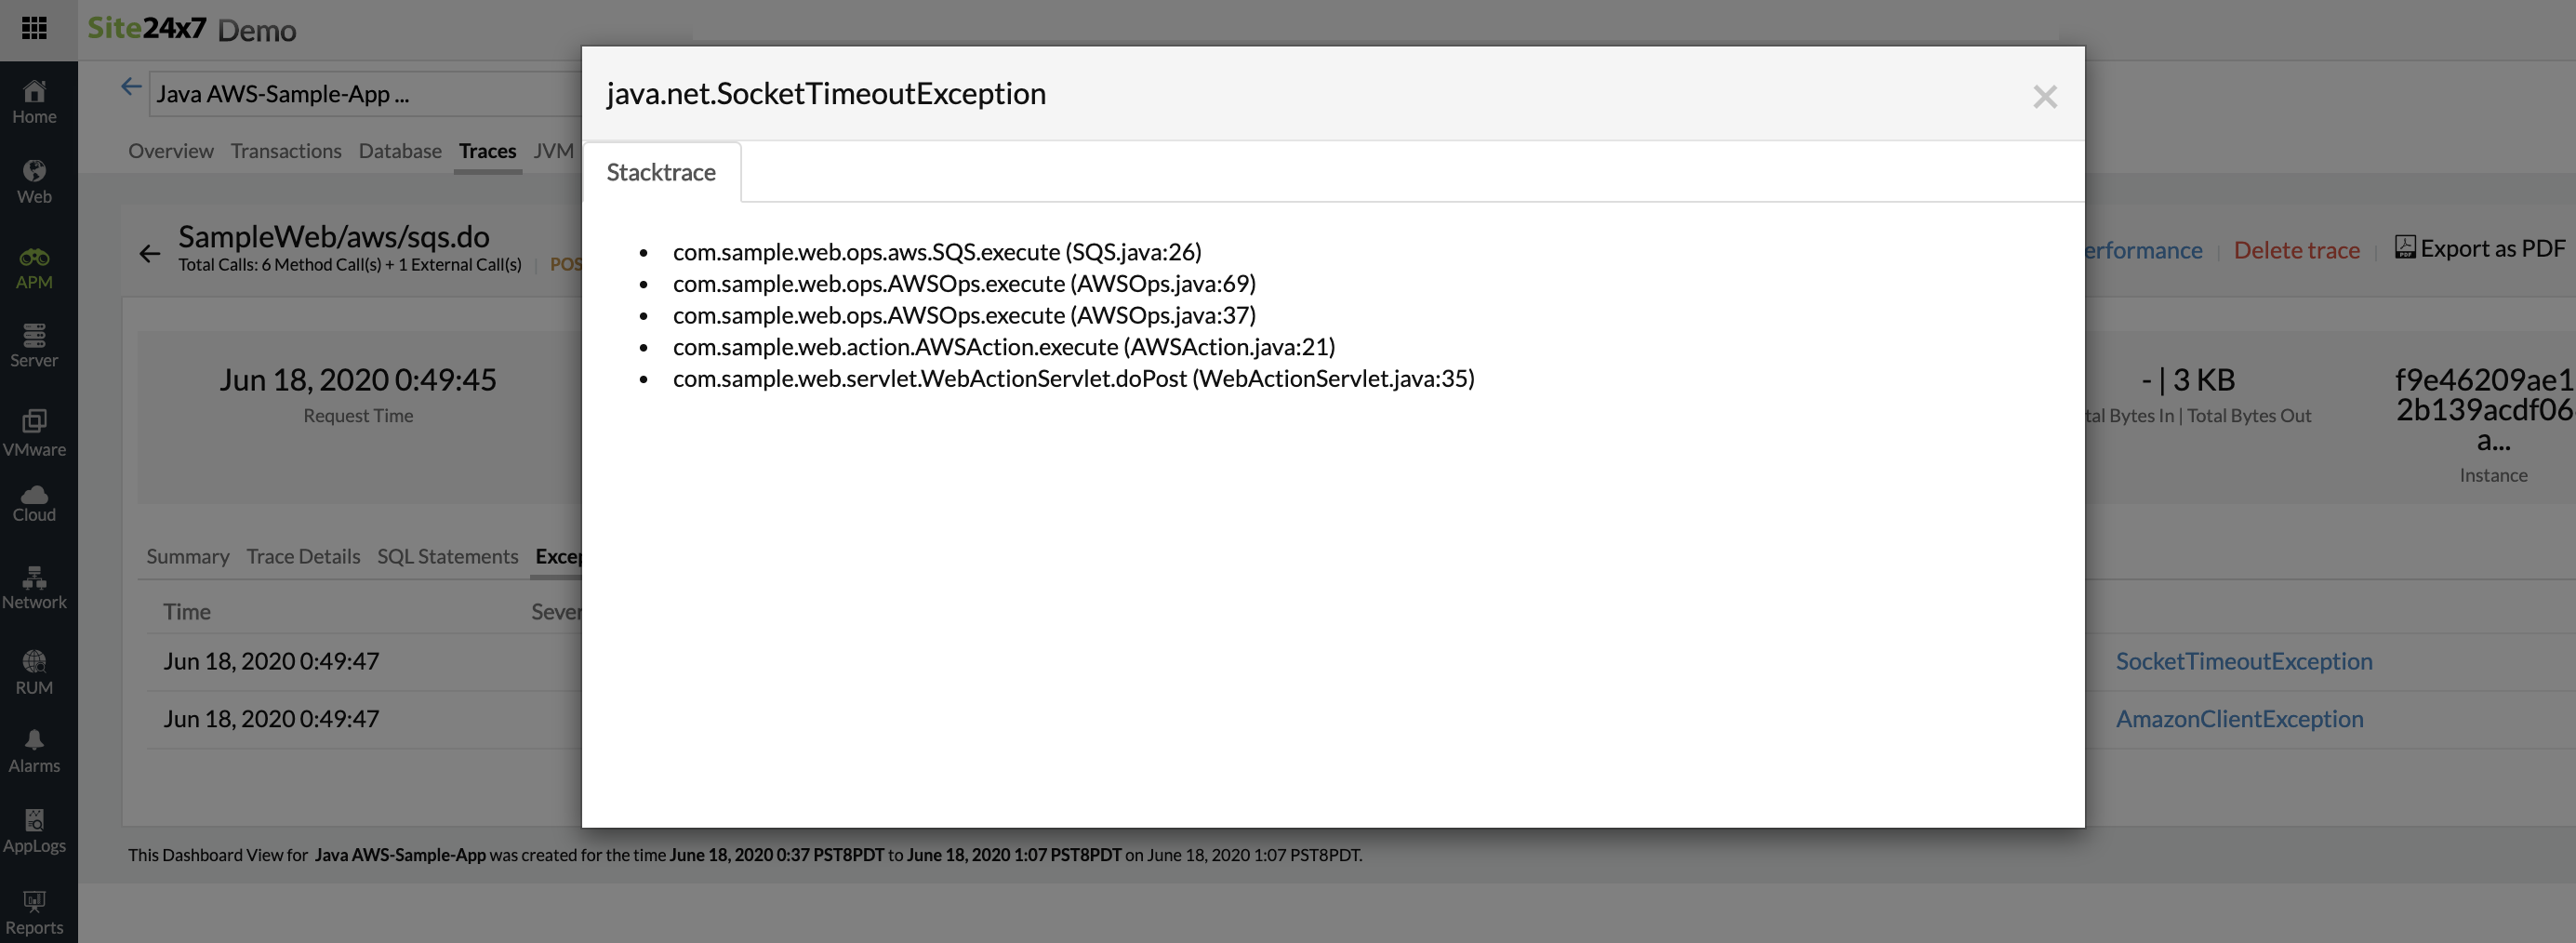
Yes. We do show the exception stacktrace with line numbers, number of occurrences of the exception and the transaction in which the exception occured, inside the webclient.
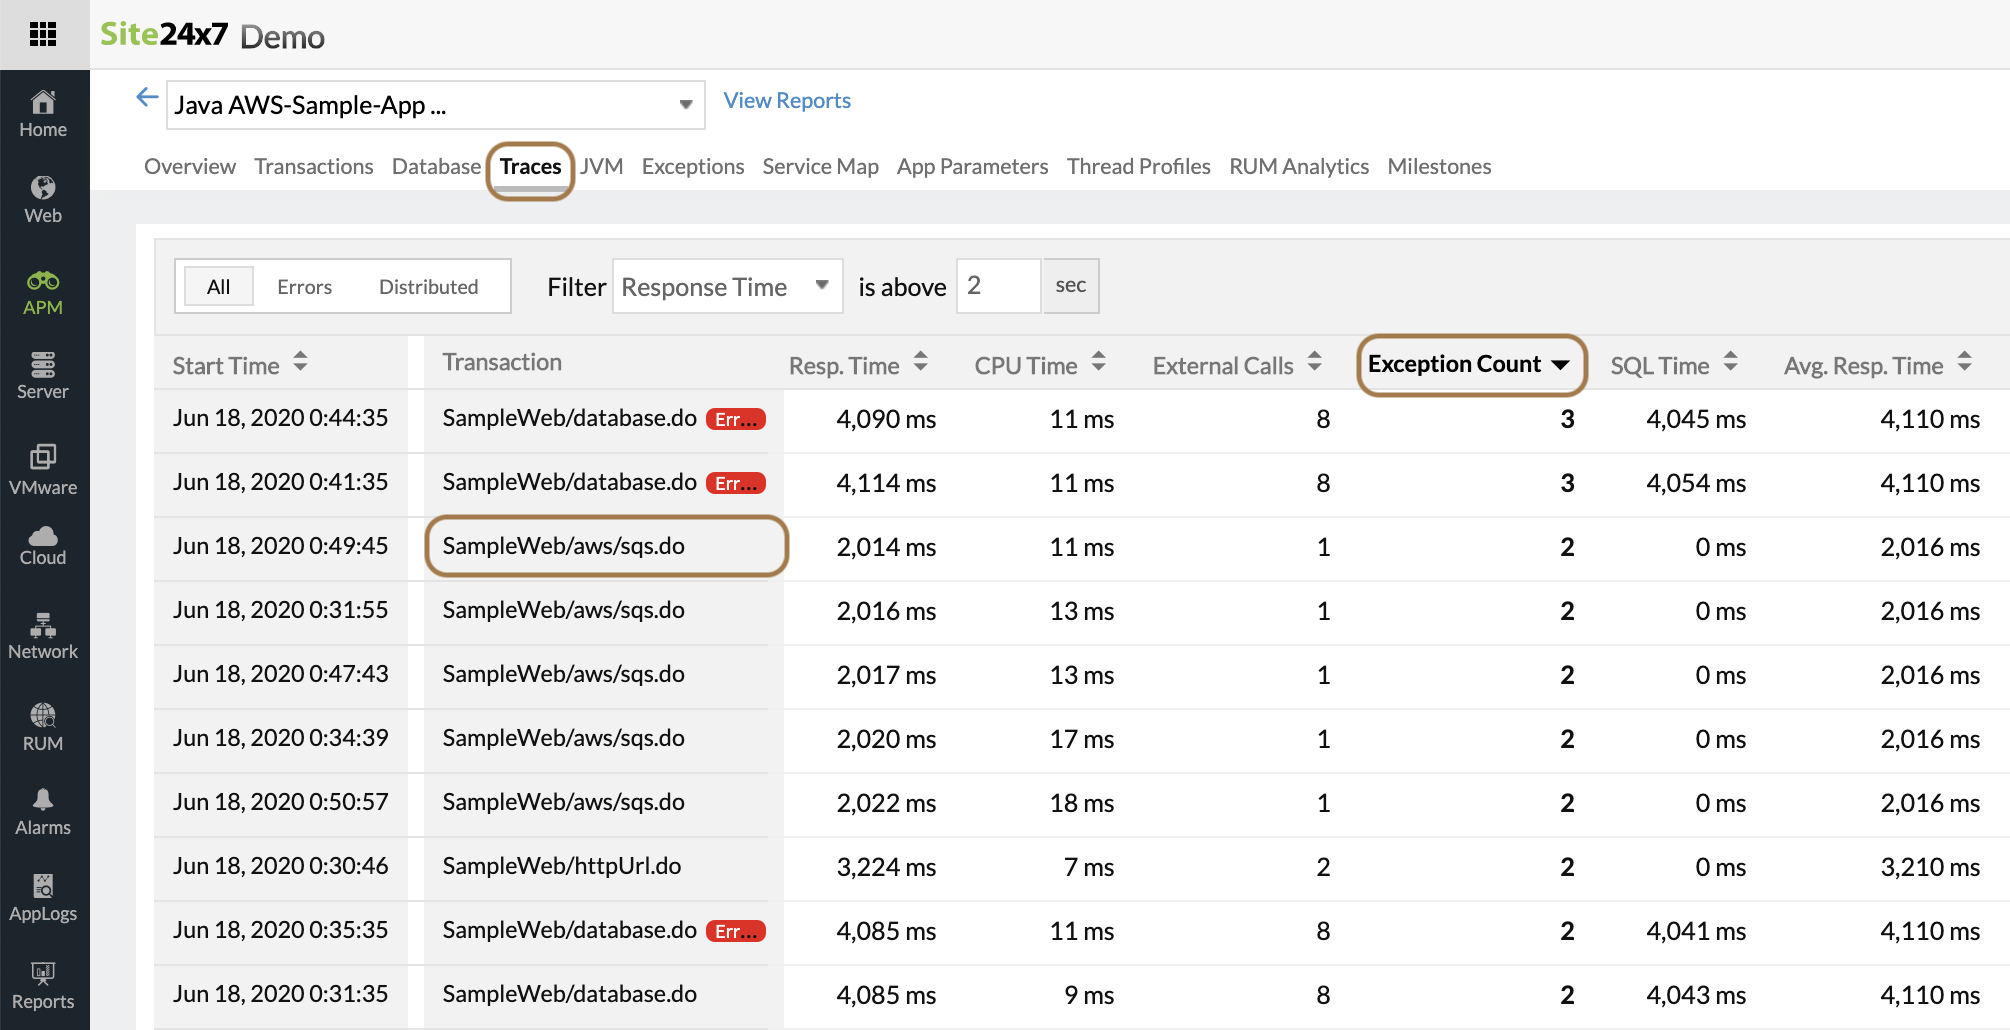
Navigate to APM -> application name -> Traces, to sort based on exception count and drill down from there, as shown in the screenshots below.
Trace page sorted based on Exception Count.
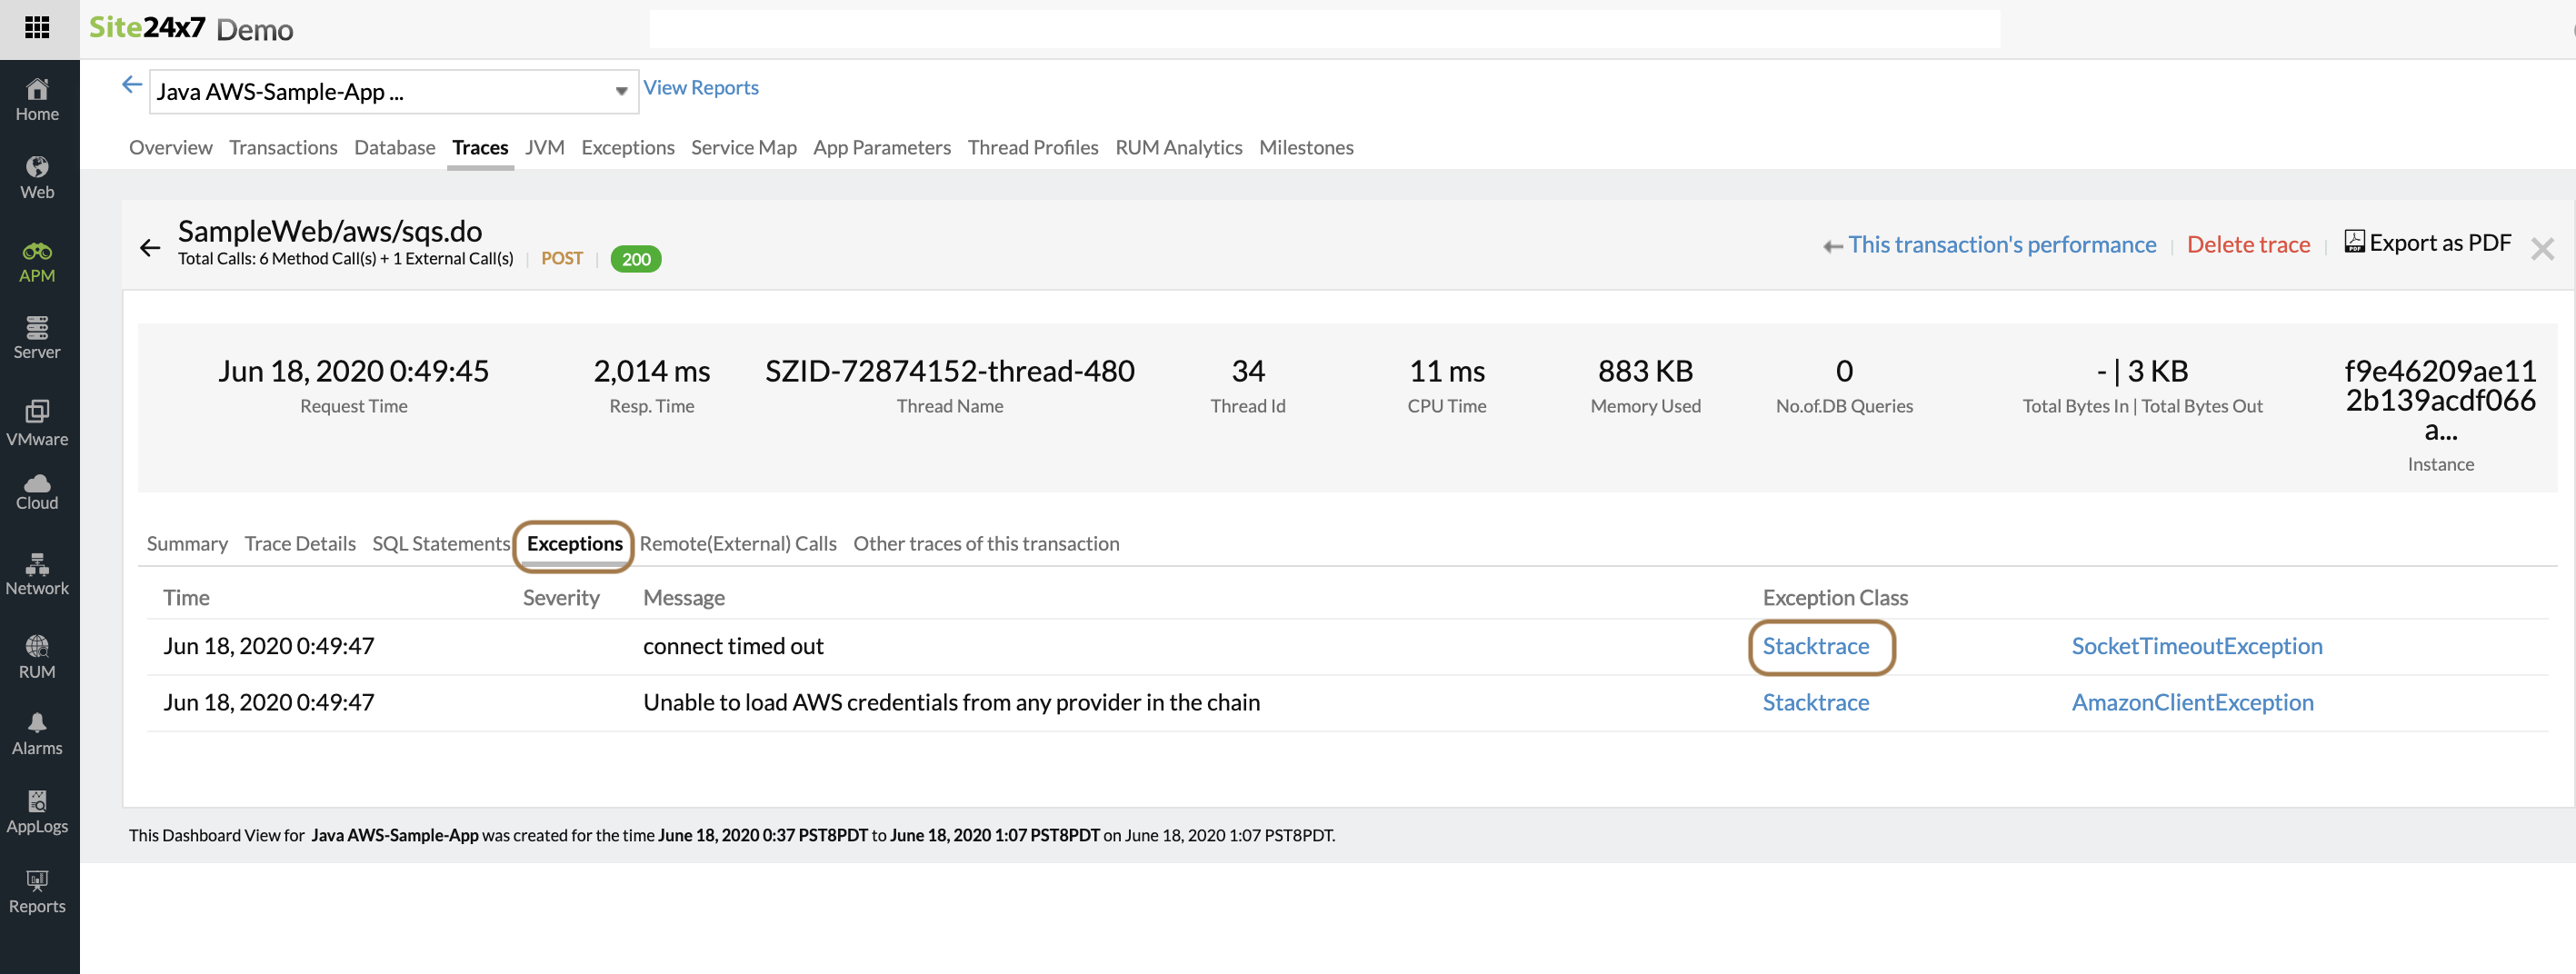
Clicking a particular transaction shows the Exceptions in that transaction and the corresponding Stacktrace.
The stacktrace details showing the lines of code.
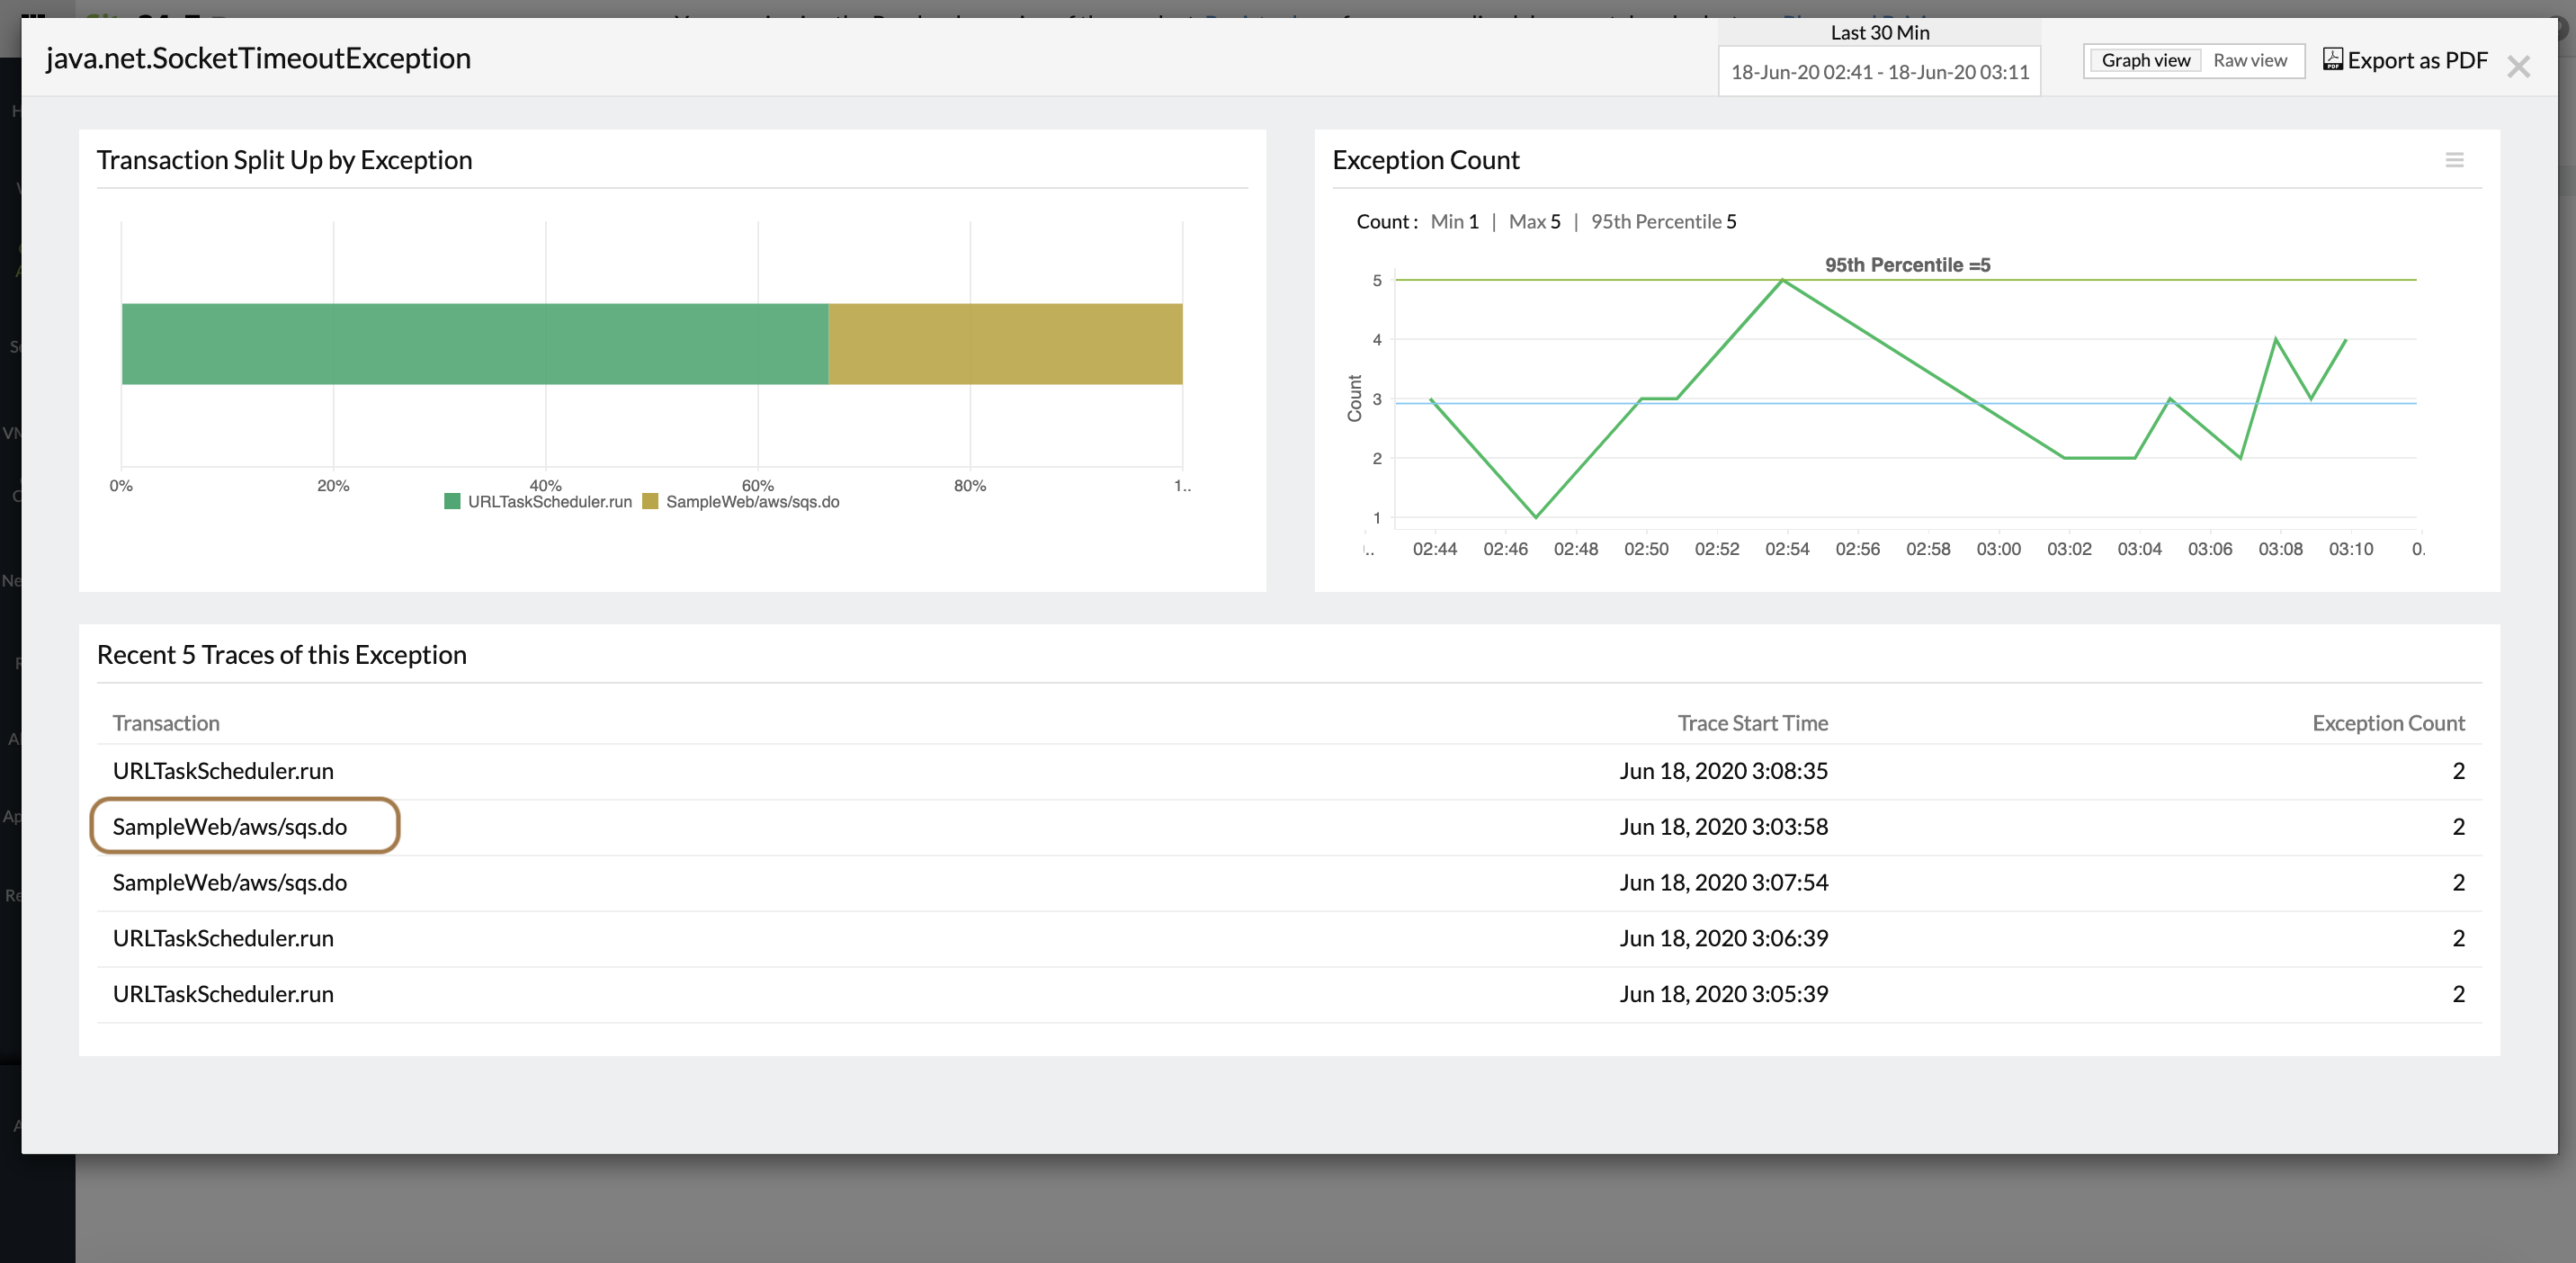
On the other hand, you can also drill down from the Exceptions tab. Click on a particular exception and go to a particular trace.
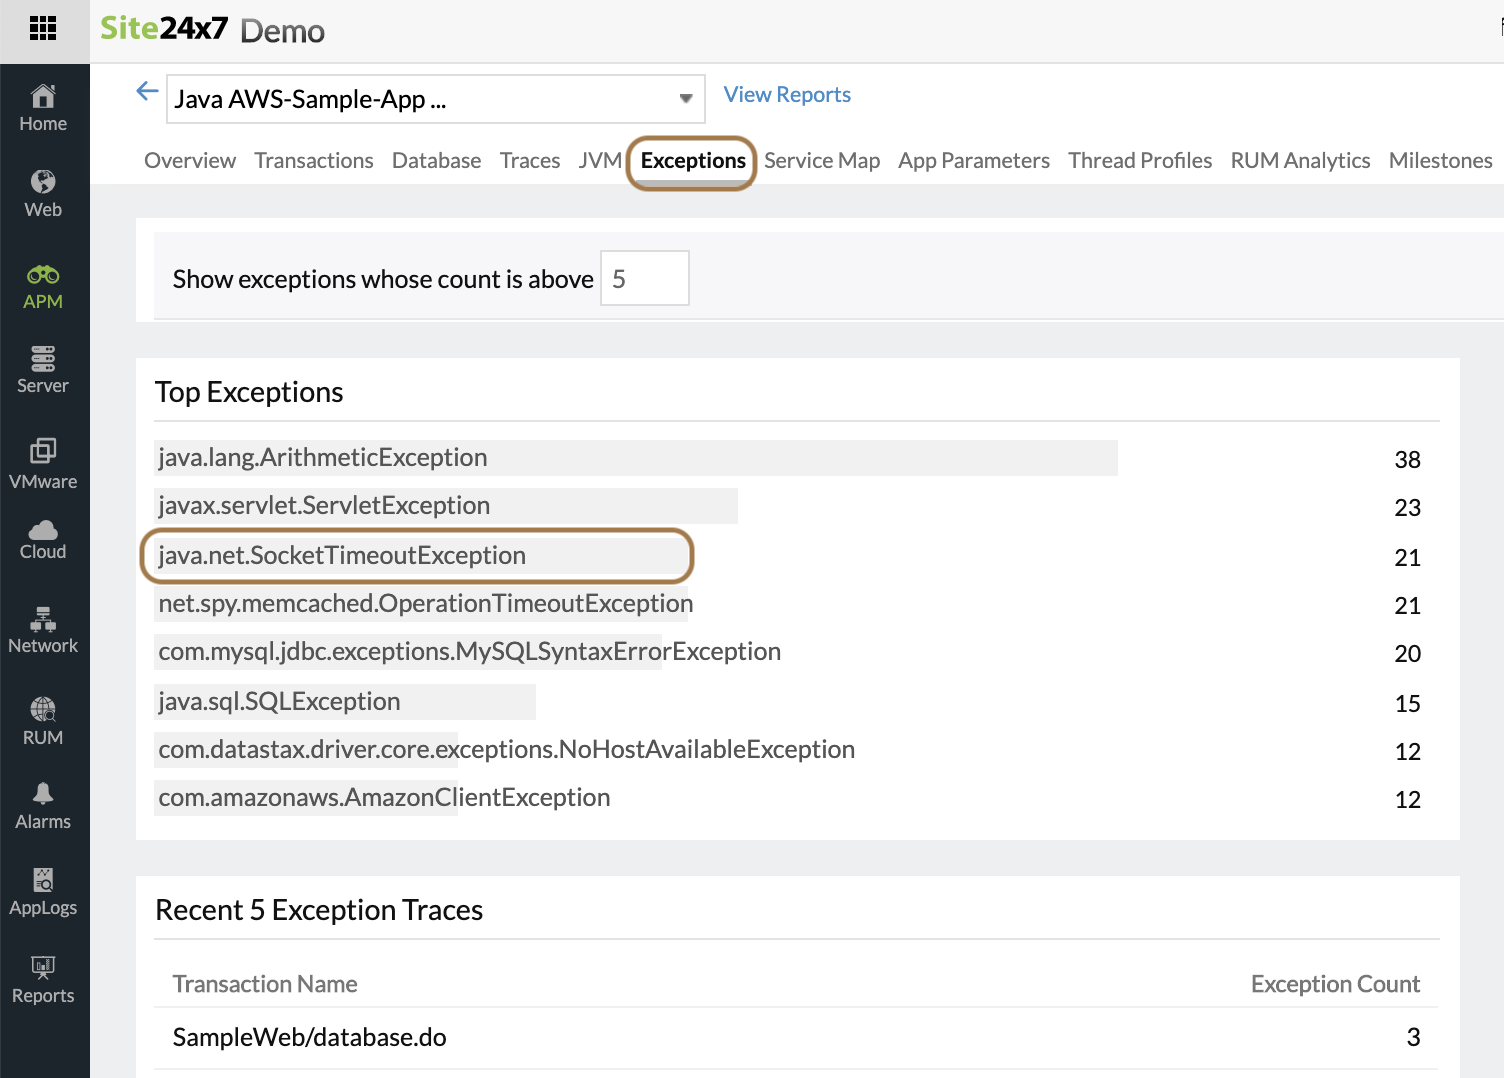
Drill down to the trace to view the exception stacktrace.
Regards,
Raji.