When monitoring a site it would be awesome to be able to see the average
response and as well as load time for the page; and in addition be able
to see the difference between each location in the graph.
Having advanced graphs would be an awesome improvement to track site performance:
1.) On the existing graph, keep average response time as is but add a line graph for each location to show how they compare and make the graph zoomable but show one hour by default. In Monitor.us they show you response time graphed by location at 6 hour increments:

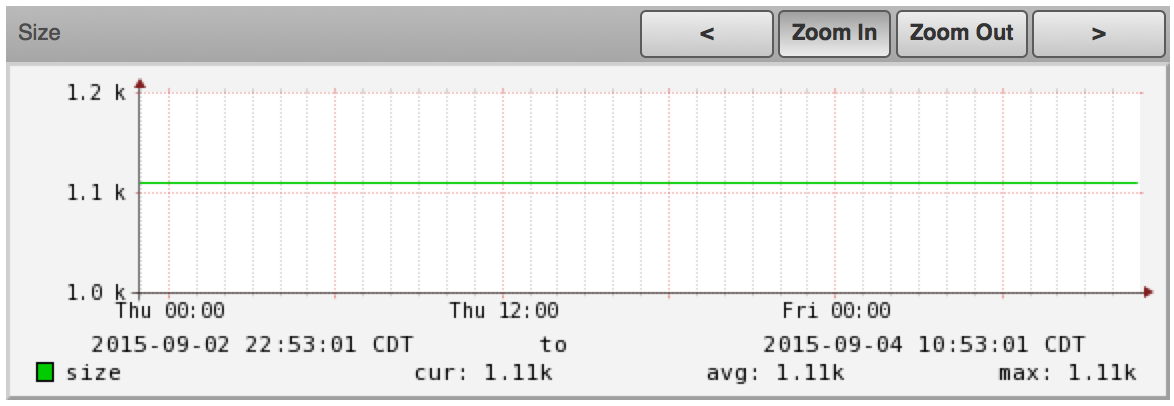
2) Needed graph: It would also be awesome if we would get another graph that shows page size, this way customers can monitor changes in page sizes and can tell if something changes, we already have the option to set page size changes by x% for alerts. In Zenoss we have a graph that shows us this information:
Having advanced graphs would be an awesome improvement to track site performance:
1.) On the existing graph, keep average response time as is but add a line graph for each location to show how they compare and make the graph zoomable but show one hour by default. In Monitor.us they show you response time graphed by location at 6 hour increments:
2) Needed graph: It would also be awesome if we would get another graph that shows page size, this way customers can monitor changes in page sizes and can tell if something changes, we already have the option to set page size changes by x% for alerts. In Zenoss we have a graph that shows us this information:
Like (2)
Reply
Replies (3)
Hi framirez,
Thanks for your feedback.
We are currently working on customizable graph section. These
requirements will be covered in it.
Feel free to share in this thread, if you need any other features
in graphs.
Thillai
Site24x7 Team
Like (0)
Reply
Hi framirez,
We had to hold this customizable graphs and reports section to fasten our new client release. After the client release, we are taking up customer requests one by one such as monitor group enhancements. We are yet to work on this request. Will update here once we have a beta version.
Thillai.
Like (0)
Reply