
- No more licensing headaches - Your terminated AutoScaling instances won't be eating up valuable licensing space anymore, instead they will get suspended in the Site24x7 console
- Site24x7 will be able to distinguish an instance termination from an instance crash
- Performance charts for all your EC2 related metrics will now be available in a single unified view - no need to toggle between tabs
- Automatic clean up - Your terminated EC2 instances will be automatically removed from the Site24x7 console.
- Reduced alert fatigue no more redundant alerts when AutoScaling instance gets terminated or when agent communication failure occurs.
- Thresholds, notifications, maintenance - now all can be set up and configured on a single monitor.
- Process and service level granularity: Identify the top process by CPU/Memory over a period of time, monitor CPU, memory, object handles and thread count for each running process and service
- System load: Analyze the load average on your system
- Analyze filesystem usage: Monitor free space usage and individual disk utilization for your attached EBS volumes
- Memory utilization: view memory breakup, assess instance memory usage, get alerted in the event of memory swap or page outs
- Check network traffic: monitor outgoing and incoming network packets for each network interface. Get alerted when error packets gets generated.
- Plugins: Open ecosystem to monitor various application services, use our out-of-the plugins or write your own.
- Root cause analysis report reduce mean time to repair (MTTR)
- Automatically collect metrics if you're running IIS and SQL server
- Heartbeat checks every 1 minute, in other words the availability of your instance is monitored every 1 minute.
- Extensive alerting for a host of new system level parameters, improved performance reports and a whole lot more.
How to enable this enhancement?
If you're already monitoring EC2 instances with the server agent, and want to try our integration, don't fret, we have got you covered. Our development team has already put in all the necessary provisions in place to seamlessly sync your existing server monitoring data with the AWS EC2 monitor. All we need is your go ahead. We believe in the popular adage of starting fresh, so when syncing is done, your outage history from the server monitor won't be ported to the newly integrated monitor. If you want the old outages to be carried over, you can get in touch with us.
(Important!) Automatic integration
Going forward, this integration will be handled automatically in the client. For example imagine a scenario, where you are monitoring a group of 10 EC2 instances standalone with our server agents. Then you decide to try our CloudWatch integration, so you connect your AWS account with Site24x7, auto discover all your EC2 instances and add them as EC2 CloudWatch monitors. Once this is done, all the agent data corresponding to the various instances will be automatically ported from the server monitor to the integrated EC2 CloudWatch monitor and your server monitor will cease to exist.
This automatic integration will also be applicable, when you are using our CloudWatch integration and decide to deploy agents on the said instances.
- All charting and graphs pertaining to CPU usage, memory, disk utilization, system load, idle/busy time, etc will be ported to the EC2 summary page present in the EC2 CloudWatch monitor
- In addition to EC2 summary, volumes and EC2 inventory tabs, the integrated EC2 CloudWatch monitor will contain additional tabs like CPU, Memory, Disk, Processes, Plugins, Checks, Network Sys logs and Process viewer
- Configuration and threshold profiles will also be ported.
Pricing and licensing details
With respect to your query on classification between the EC2 instances that are integrated and the ones that are not, we have provided the agent hosted machine name along with the agent version in the overview page at the top left corner(I have attached a sample to provide some clarity).
Regards,
We understand your concern with respect to monitor status page.
We will look into this right away.
Regards,
Ananthkumar K S
Hi Tom,
We have tried to classify the integrated instance by giving you some
classification in listing page.
Hope it helps.

Regards,
Ananthkumar K S
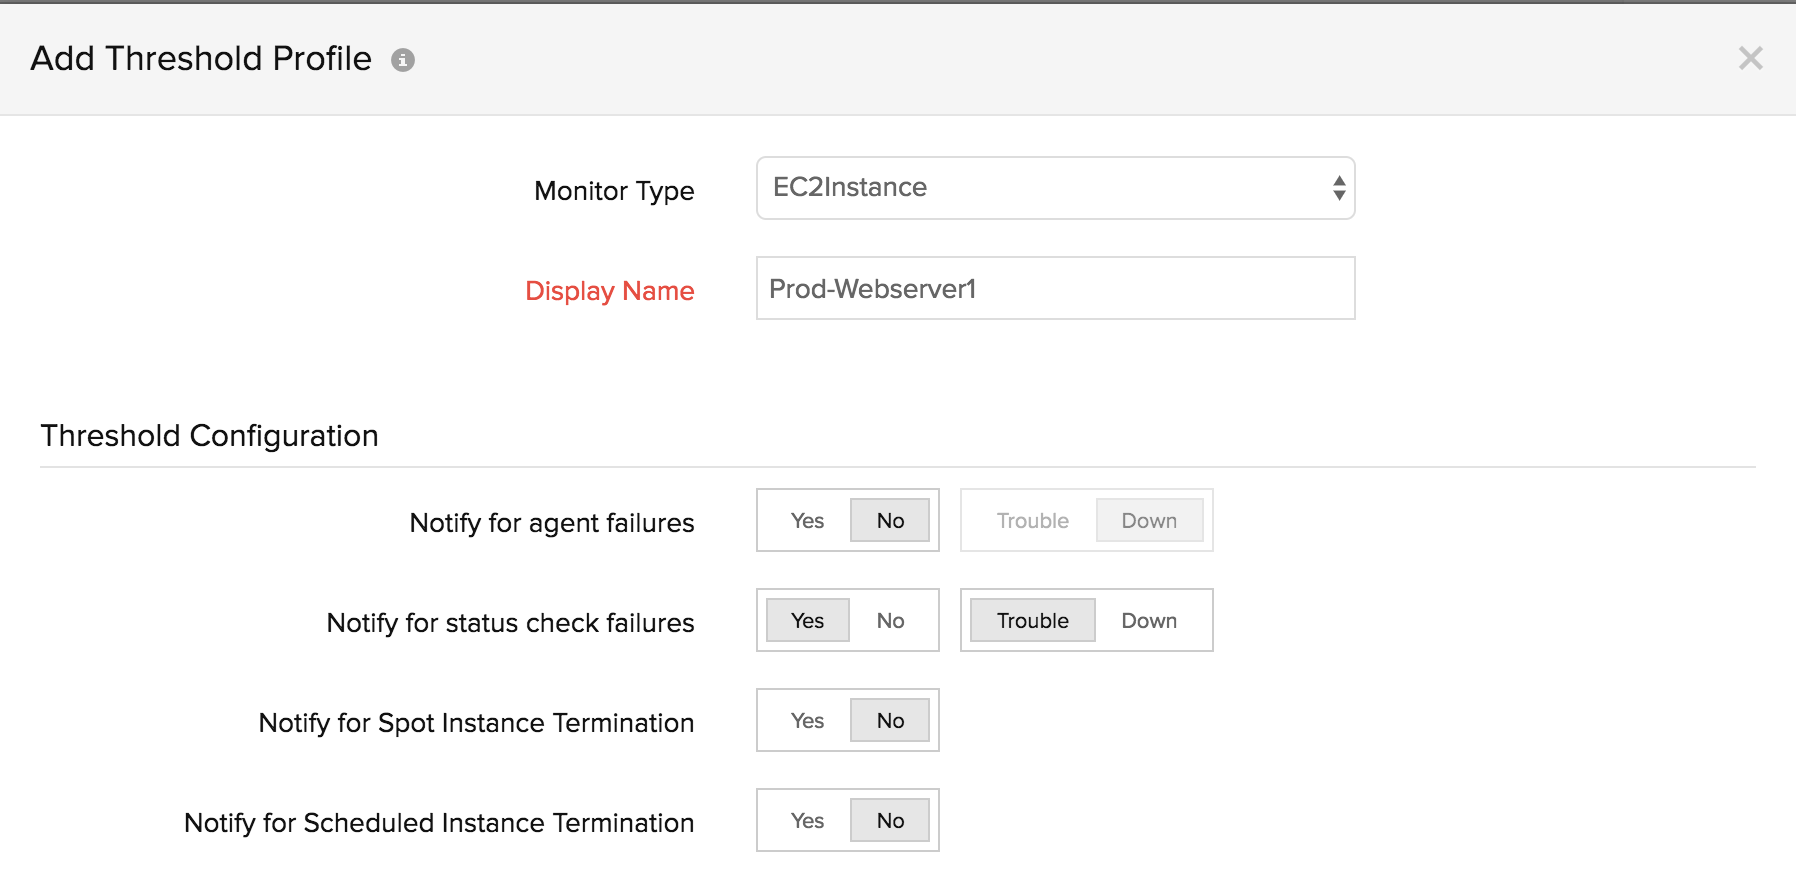
In response to feedback received from a customer, regarding constant alerting for spot instance interruptions we're adding more alert options and control to improve our signal-to-noise ratio. After today's release, you can navigate to the Edit section of a monitored EC2 instance, access the attached threshold profile, and configure whether you want to be alerted for spot instance interruptions and scheduled reserved instance termination. By opting out you neither won't be bombarded with unnecessary alerts nor would you deplete your alert credits, when instance termination occurs.
By default, the toggle will be set to "Yes" for an already discovered and monitored EC2 instance. If you don't care about these attributes, then you can switch the toggle to "No" and save the profile. However, for a newly connected AWS account, the toggle for both the attributes - "Notify for Spot Instance Termination" and "Notify for Scheduled Instance Termination" will be set to "No" in the threshold profile.
Help resource
EC2 instance threshold configuration
If you have any feedback or suggestions on how best to take spot or reserved instance monitoring forward, please get in touch with our support or reply in this forum thread.