Using sensible thresholds for alerting and investigation is a tricky facet of modern infrastructure monitoring. Since static thresholds can never adapt to a system’s dynamic behavior, they can’t learn what’s normal and what’s not, and they end up generating too many false alarms and missed alarms.
At Site24x7, we're pioneering a new era of self-learning monitoring solutions based on artificial intelligence and machine learning algorithms. With the launch of our AI-powered anomaly and outlier detection mechanisms, you can basically do away with static thresholds and distinguish between normal and abnormal trends in your metrics, forecast potential outages, and fix issues before they start affecting customers.
Using anomaly data to boost DevOps productivity
Anomaly detection involves applying a set of robust techniques and predictive machine learning models to find unusual behaviors and/or states in systems. Site24x7 uses an AI-based anomaly framework to detect unusual spikes or aberrations in your monitored critical metrics, such as response time, CPU usage, and memory usage. DevOps technicians can use the anomaly data for better operational efficiency.
Here are a few ways operations teams can leverage anomaly data for faster incident resolution based on seasonality and trends:
-
Detect abnormal metric values to find otherwise undetected issues in your stack. An example is detecting high memory usage in a server, which may lead to a potential busy or idle server in the near future.
-
Identify drastic changes in an important metric or process so you can examine the situation to find potential issues.
-
Reduce the need to set or recalibrate thresholds across a variety of different monitors.
-
Reduce the troubleshooting time required to diagnose a problem in your stack.
Anomaly detection involves three steps:
1. Mathematical modelling: The anomaly engine uses a univariate algorithm for location-based monitors. It uses the Robust Principle Component Analysis (RPCA) algorithm for more efficient, reliable anomaly reporting. The anomaly engine spots anomalous behavior in data recorded for a single metric of interest, usually the response time attribute for all Internet Services Monitors. For agent-based monitors like Server and Application Monitors, where multiple attributes are tracked, the anomaly engine uses a Matrix sketching algorithm.
2. Anomaly event generation: This step involves all the heavyweight data crunching. For the univariate algorithm, the anomaly engine uses the last four weeks' worth of metric data for training the AI algorithm. The anomaly engine collects metrics from data collection agents every 15 minutes, and compares your KPIs against the trained data.
For the multivariate algorithm, the anomaly engine uses the 95th percentile values from the last four weeks' worth of data on correlated attributes to train the algorithm. We use the 95th percentile value because it snips off the top five percent of the highest values, removing any redundant spikes from the training data. Learn more.
3. Domain scoring: Scoring is a method used to measure anomaly severity. The anomaly engine assigns unique scores to events. Based on factors like domain scores, dependencies, and increased gravity of detected anomalies, anomalies are labeled as Confirmed, Likely, or Info. Read more about domain scoring.
Anomaly reporting with graphs and flexible alerting
By accessing the time series graph in the Anomaly Dashboard, you can closely inspect the behavior of the metric in question against other metrics at a given point in time. Read this article to learn how to interpret the anomaly data. You can also share the Anomaly Dashboard as a CSV or PDF.
Alerting is an integral part of anomaly detection. When multiple anomalies occur, we send out an email notification once an hour to avoid a flood of alerts. To set up anomaly email alerts in Site24x7, log in to the web client and access Admin > Users & Alerts > Add Users > Advanced Settings; select Email as your preferred mode for alerting.
Get started now!
If you already have a paid Site24x7 monitor setup, you can head straight to detecting anomalous metrics from the Anomaly Dashboard. Anomaly detection is just the beginning; expect to see more features lining up for AIOps soon.
Feel free to leave your feedback in the comments section below. If you have any questions, please get in touch with us at support@site24x7.com.
Happy monitoring!
Thank you, Sven!
Really happy that it’s already helping you make better monitoring decisions. To answer your question, we've not been sending anomaly alerts to any third-party solutions, as yet. However, we've plans to integrate anomaly alerts with third-party softwares, including OpsGenie in the future. I'll keep you posted about such enhancements.
- Abhiram
When will we be able to use this in the Alerting Profiles for monitors?
For instance, if I have a site and I want to alert on Anomalies rather than hard thresholds, how would I set a monitor up to send a notification to PagerDuty if the load time broke normalcy based on this intelligence?
Hi framirez,
For instance, if I have a site and I want to alert on Anomalies rather than hard thresholds, how would I set a monitor up to send a notification to PagerDuty if the load time broke normalcy based on this intelligence?
As of now, users can receive anomalies only via email, SMS, voice call, and IM. We do not currently support third party integrations for reporting anomalies.
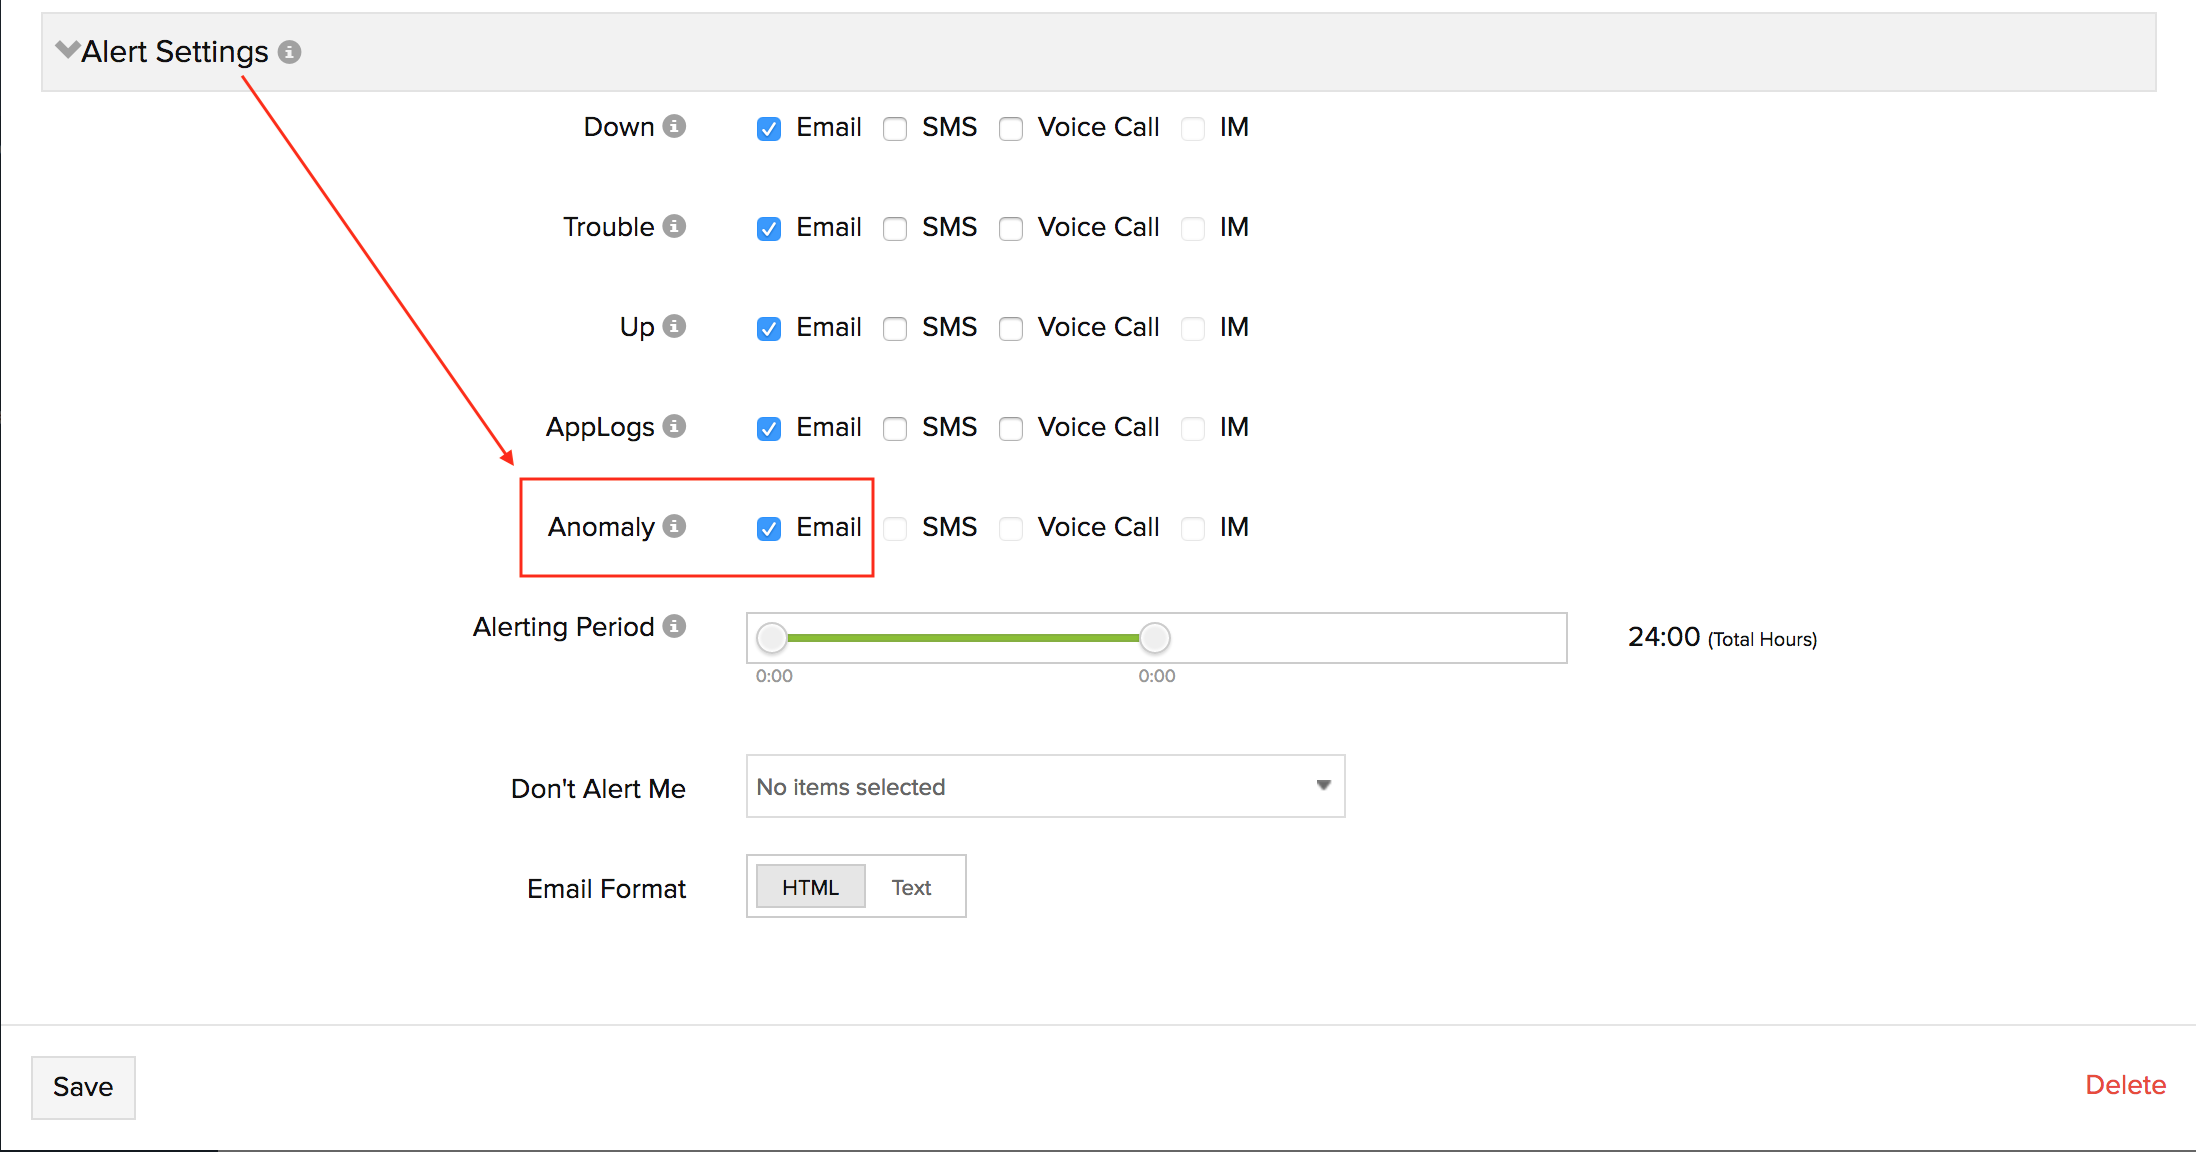
To enable alerting for anomalies, rather than hard thresholds, please follow the steps below:
1. Log in to Site24x7.
2. Go to Admin > User and Alert Management > Users and Alerts.
3. Click on the user account from which you would like to receive anomaly alerts.
4. In the Edit User window, expand Alert Settings and select the alerting medium for Anomaly. Save your changes.
Hope this helps. Let us know for further queries, if any, in the below thread.
Thanks,
Muralikrishnan,
Product Manager,
Site24x7
We're here with the latest updates in Site24x7's anomaly detection. Our development in the last few months was focused on forecasting and predictive analysis. Our research team has worked with various ML algorithms and AI techniques to provide users with insight into the behavior of a component in the near future. They recently presented at USENIX’s OpML '19 conference on how they designed the ML algorithm in our anomaly detection engine.
Anomaly detection
The increasing amount of data generated by IT infrastructures will soon require a level of monitoring that will complement the ability of human beings. Critical parameters can sometimes be overlooked and troubleshooting the root cause can be time-consuming.
A constant increase in the time to first byte will lead to poor response from the application, slow down the website, and in turn, affect the end-user experience. Our anomaly detection engine identifies such patterns in every parameter and helps fix problems before they arise.

Forecasting
You can streamline your infrastructure performance with forecast charts that predict the future values of a performance metric based on current and historical growth rate trends. Consider a database disk with a high write rate. If the write rate continues to be high, the disk will eventually run out of storage, resulting in downtime.
With forecast charts, the operations team can visualize the disk usage up to one week in the future. With this data in hand, they can perform a disk cleanup or expand storage to thwart potential downtime.

An application load balancer handles a large volume of requests every day. An increase in the number of incoming requests might cause transaction failures and service unavailability. Forecast charts come to your rescue by predicting how many incoming requests can be expected over the next week. With this information, you can troubleshoot issues with DNS, if any, or equip your infrastructure to handle increasing traffic volumes.
If your entire infrastructure is running on AWS, you might be bombarded with several alerts on a daily basis. Cutting through the noise and troubleshooting could take several hours. For instance, applications will not be able to perform write operations in an S3 bucket if it runs out of storage. Forecast charts ensure that such problems are identified before an issue arises. Tracking the storage trend assists with capacity planning and helps ensure your applications run uninterrupted.
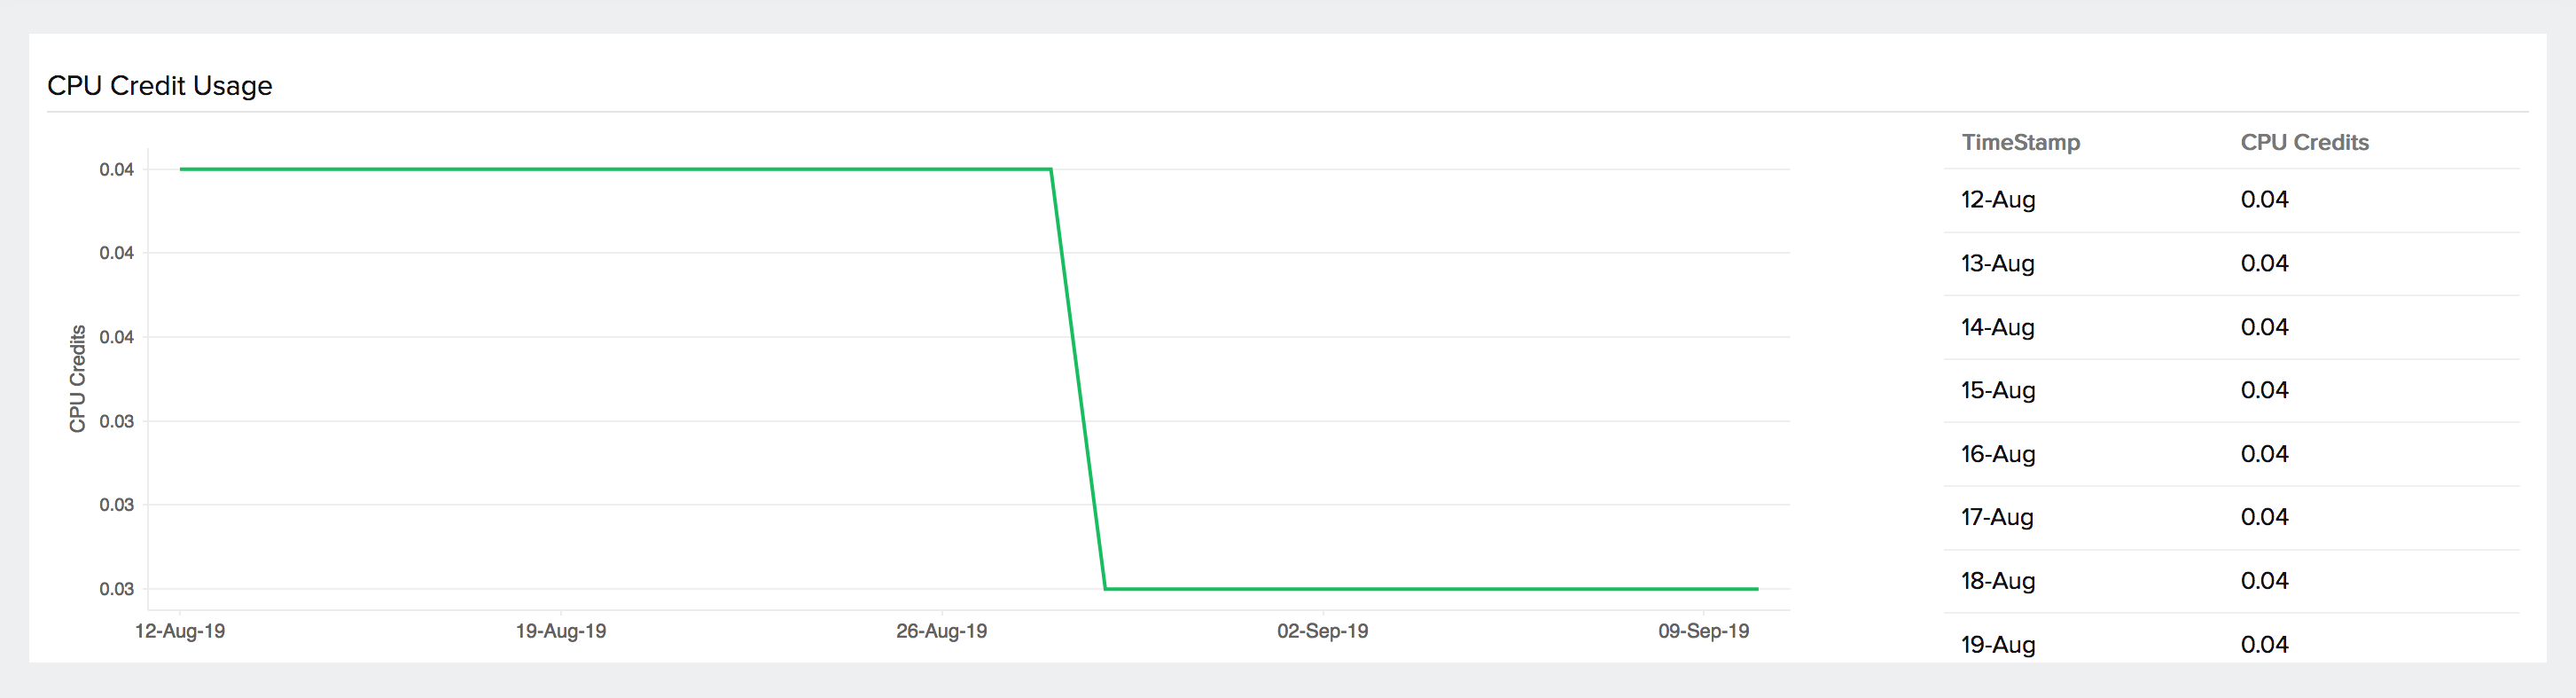
Similarly, if the CPU usage of EC2 instances increases over time, there’s a good chance that a single application is demanding the entire processor. Forecast charts give you a heads up before an incident occurs and crashes the application.
We offer forecast charts for many other AWS services, including EC2, RDS, EBS, and SQS. You can find the entire list here.
What's in store for the future?
We're focusing on providing insights to help thwart operational interruptions with outage prediction, so you have early warning about possible issues. As far as event correlation goes, you can also expect better root cause identification and the ability to trace the chain of events that led to an outage.
We hope you enjoyed this brief on our latest enhancements in anomaly detection in Site24x7. We'll be back with more updates soon. Until then, happy monitoring!