A forecast chart provides an estimate of how much a performance metric will change in the future. Using machine learning algorithms and traditional statistical models, our new forecast engine for AWS Monitoring predicts changes in resource usage for the upcoming seven days based on data from the preceding fifteen days. These predictions anticipate future resource constraints and help you make changes with confidence.
Use case
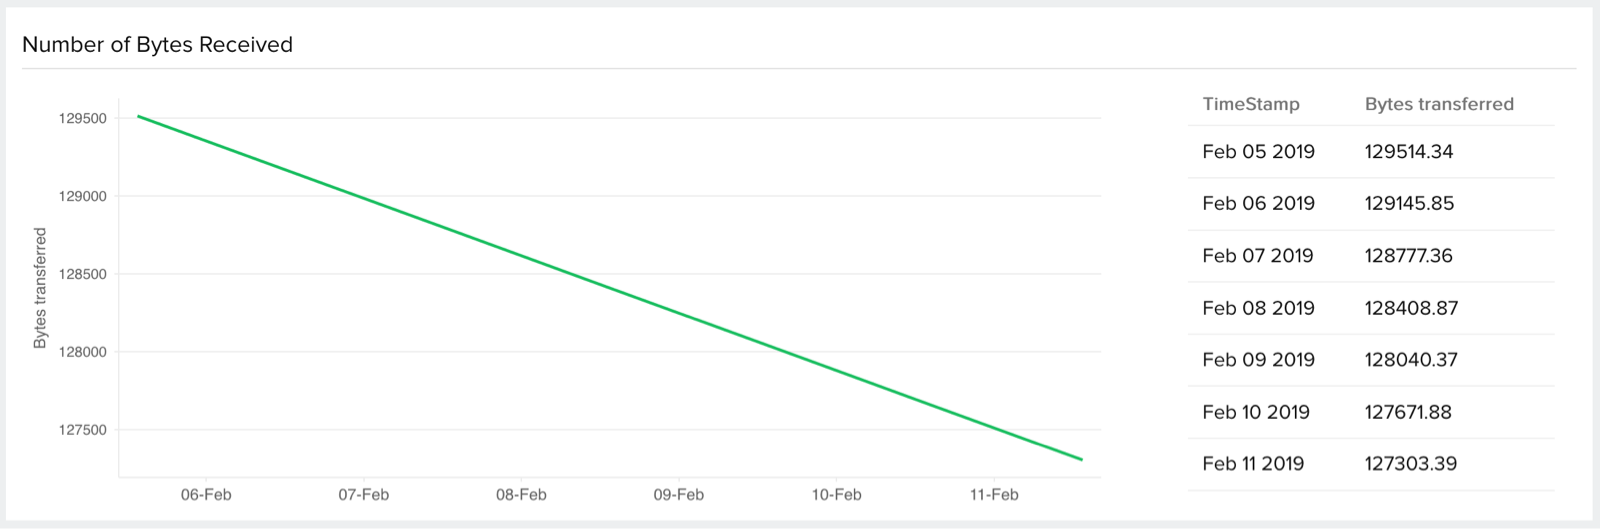
For example, you can estimate when your RDS DB instance will run out of disk space by viewing the forecast chart for free storage space. If you find your free storage space is predicted to go below 10 percent of the total available disk space, you can start archiving files to avoid future bottlenecks.
Some important points to note
- At least fifteen days worth of resource usage data is required for successful prediction.
- Forecasts are enabled by default and are only available as line charts.
- You can't configure thresholds for the predicted values.
- These new capabilities are available at no extra cost.
Currently, as a pilot study, we've enabled forecasts for a handful of metrics (the entire list can be found here). If you have suggestions related to which metrics we should support next, you can post them as a reply to this community post. If you have any concerns or questions, get in touch with us at support@site24x7.com.