by Janani Sekar
Hi all,
Custom Dashboards serve as centralized views for tracking monitor health, statuses, and key metrics. We’ve expanded our widget collection and enhanced existing widgets for improved clarity and usability. Focused on delivering a centralized view of your availability, performance, and outage data, these updates empower you to monitor critical metrics, identify issues faster, and make informed decisions from a single customizable dashboard.
Why this matters
- Centralized visibility: All key availability, performance, and outage metrics are now available in a single unified dashboard view.
- Faster troubleshooting: Visual insights like heat maps, trend dials, and summaries make anomaly detection and incident prioritization easier.
- Better operational control: Enhanced options like searches, exports, and filters help you slice and dice data quickly.
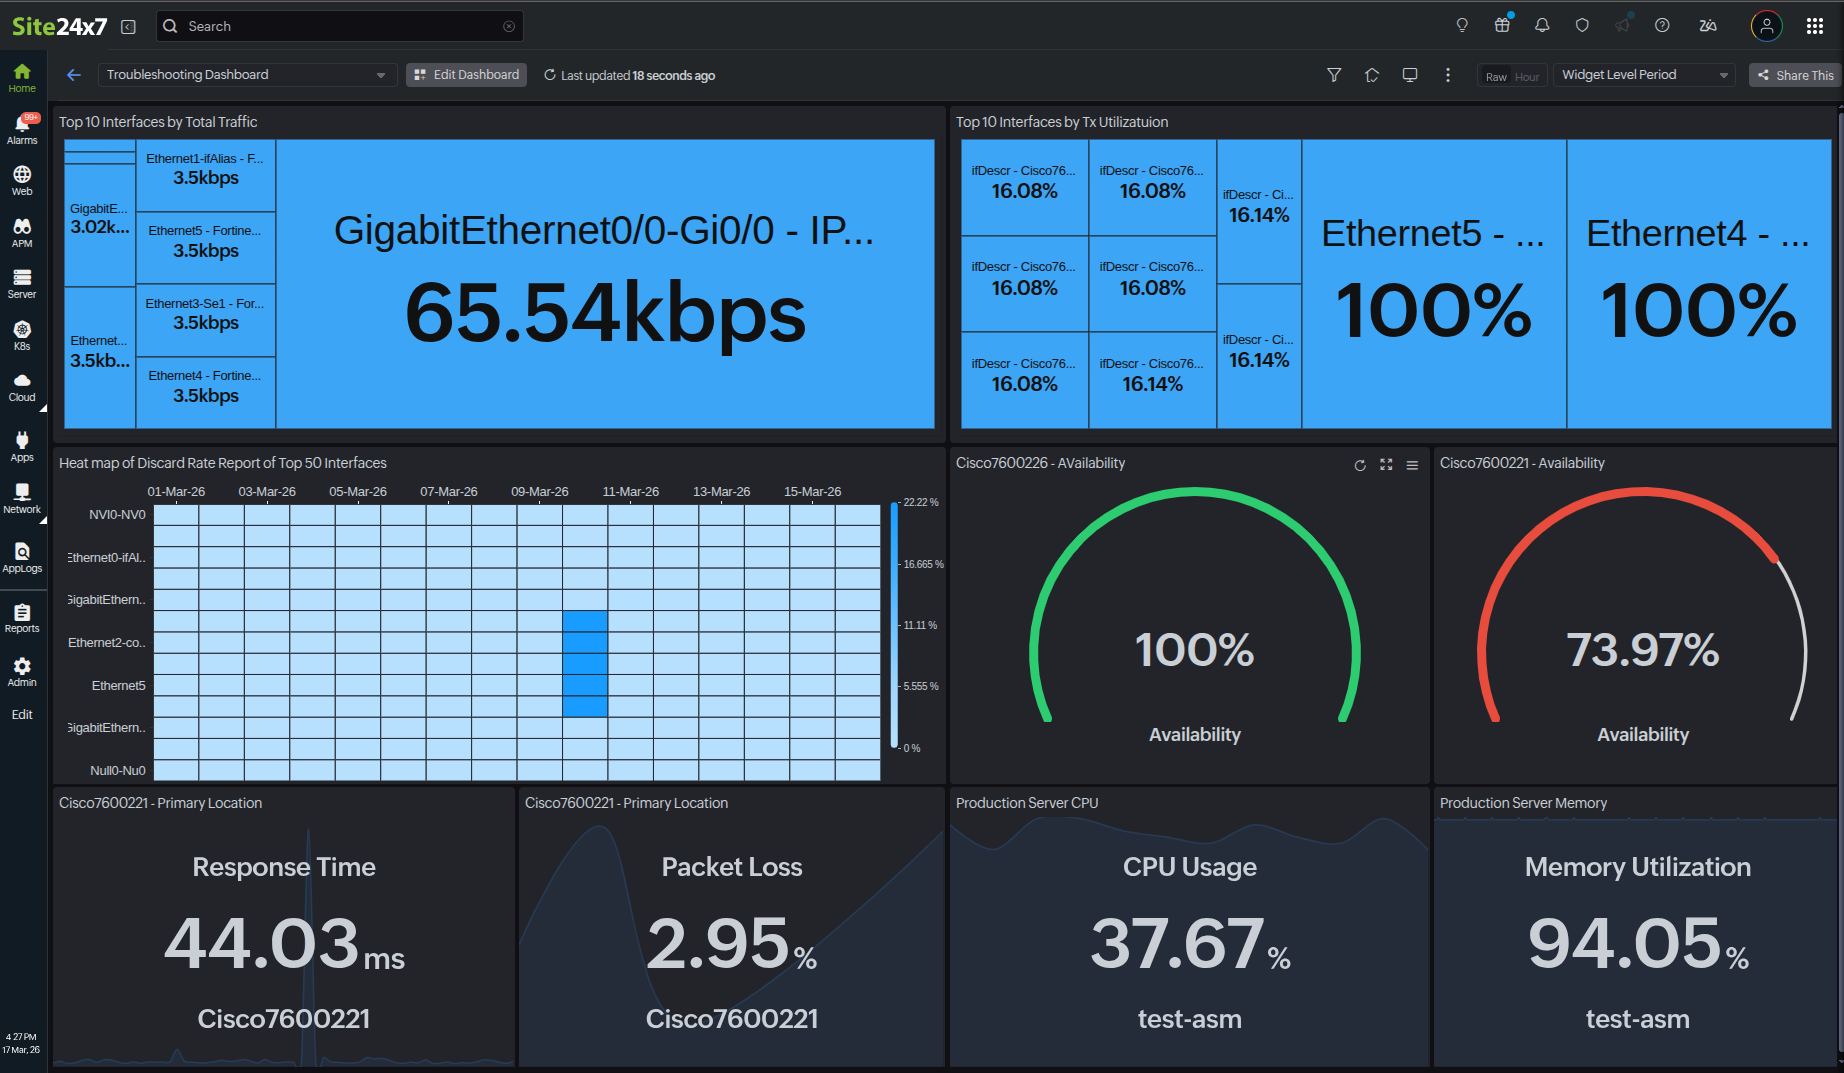
Widgets and their uses
- Heat Map: When monitoring application performance, teams can use the Heat Map widget to instantly spot hot spots, anomalies, or performance concentration patterns across multiple monitors at once, without having to review each monitor individually.
- Dial: During availability reviews, SRE or NOC teams use the Dial widget to instantly gauge if critical monitors are meeting defined availability thresholds over the selected period. The color‑coded segments (green, orange, and red) help teams prioritize which resources need immediate attention versus those that are performing within acceptable limits.
- Alarms: During a sudden surge of alerts, support teams use the Alarms widget to filter the resources by a specific downtime status, isolate high-priority alarms, and filter out unassigned alerts.
- Alarm Summary: In daily stand‑up meetings or incident triage, operations teams rely on the Alarm Summary widget to get a consolidated view of alarm counts, severities, and reports for key monitors, ensuring they do not miss high‑impact issues.
- Outages: During or after an incident, support teams use the Outages widget to review recent and ongoing downtime across resources, understand its duration and frequency, and prioritize remediation efforts.
- On-Premise Poller Health Dashboard: Platform or infrastructure teams use the On-Premise Poller Health Dashboard to continuously track the health, resource utilization, and performance of all On-Premise Pollers and their associated monitors across customer environments. Now, all these widgets can be viewed from the dashboard.
- Top N/ Bottom N Widget: NOC and performance teams can quickly compare the best and worst performers with tree map and bar chart views. These pinpoint the outliers, such as the least available resources or most error-prone components, and help ensure that remediation is immediate.
- Chart overlay for Numerical Widgets: For trend-based troubleshooting, performance engineers rely on the Chart overlay in Numerical Widgets to visualize how key metrics evolve over time directly on top of current values, helping them correlate spikes or drops with incidents or deployments.
Additionally, the in-column search capability in all tabular widgets as well as child tag filtering in the availability, performance, and Alarms widgets help teams quickly find specific resources, tags, or metrics within a widget without changing dashboard filters. The export options enable them to download widget data for audits, external reporting, or sharing with other teams and stakeholders.
Key benefits
With these widgets included on your dashboard, you can:
- Gain better insight into outages, their impacts, and remediation.
- Quickly detect performance issues and outliers.
- Proactively monitor On-Premise Poller health and utilization.
- Visually analyze availability and performance with heat maps, tree maps, charts, and tables.
- Facilitate searching for, exporting, and sharing monitoring data for audits and reporting.
With these new additions, centralize all your availability and performance metrics on one Custom Dashboard and visualize them with greater clarity and ease.
Stay tuned for more updates and enhancements to Custom Dashboards.
For more details, kindly refer to our help document.
Regards,
The Site24x7 team
Like (0)
Reply
Replies (0)