We are happy to announce that you can now monitor and review Elasticsearch slow logs using Site24x7 AppLogs.
If you are experiencing poor search performance, it is crucial to keep an eye on the different searching and indexing request types in Elasticsearch to locate the problematic indices or slow-performing queries.
Slow queries are those that take longer to execute than a threshold limit and are often caused by the following:
- Poorly written search queries with improper criteria
- Poorly configured Elasticsearch clusters or indices
- Changes in resource usage
Elasticsearch slow logs help to identify such slow-running queries for optimization.
Slow logs work specifically on the shard level and are disabled by default in Elasticsearch. To enable logging, you must configure the Elasticsearch index settings API and set a threshold value for slow search or index logs. There are three kinds of thresholds that you can define:
- Index (index)
- The query phase of search (query)
- The fetch phase of the search (fetch)
Follow the steps in this document to configure Elasticsearch slow logs in Site24x7 AppLogs.
With our exclusive dashboard, you can easily:
- Locate slow searches
- Figure out the problem in indices
- Reduce the troubleshooting time
Let's look at the below example to find out how the dashboard helps you narrow down the problem.
Step1: Locate slow searches
Say there are a set of queries on our dashboard reporting slow response time. Upon further inspection, it was discovered that these queries were run on the same node and index.
Step 2: Figure out the problems in indices
Further investigation revealed that this problematic index is defined on one shard with no replicas.
Step 3: Reduce the troubleshooting time
Optimizing index settings with the right balance of shards and replicas plays a crucial role in Elasticsearch performance. Adding replicas to the index distributed the query load across all the cluster nodes and quickly fixed the query performance.
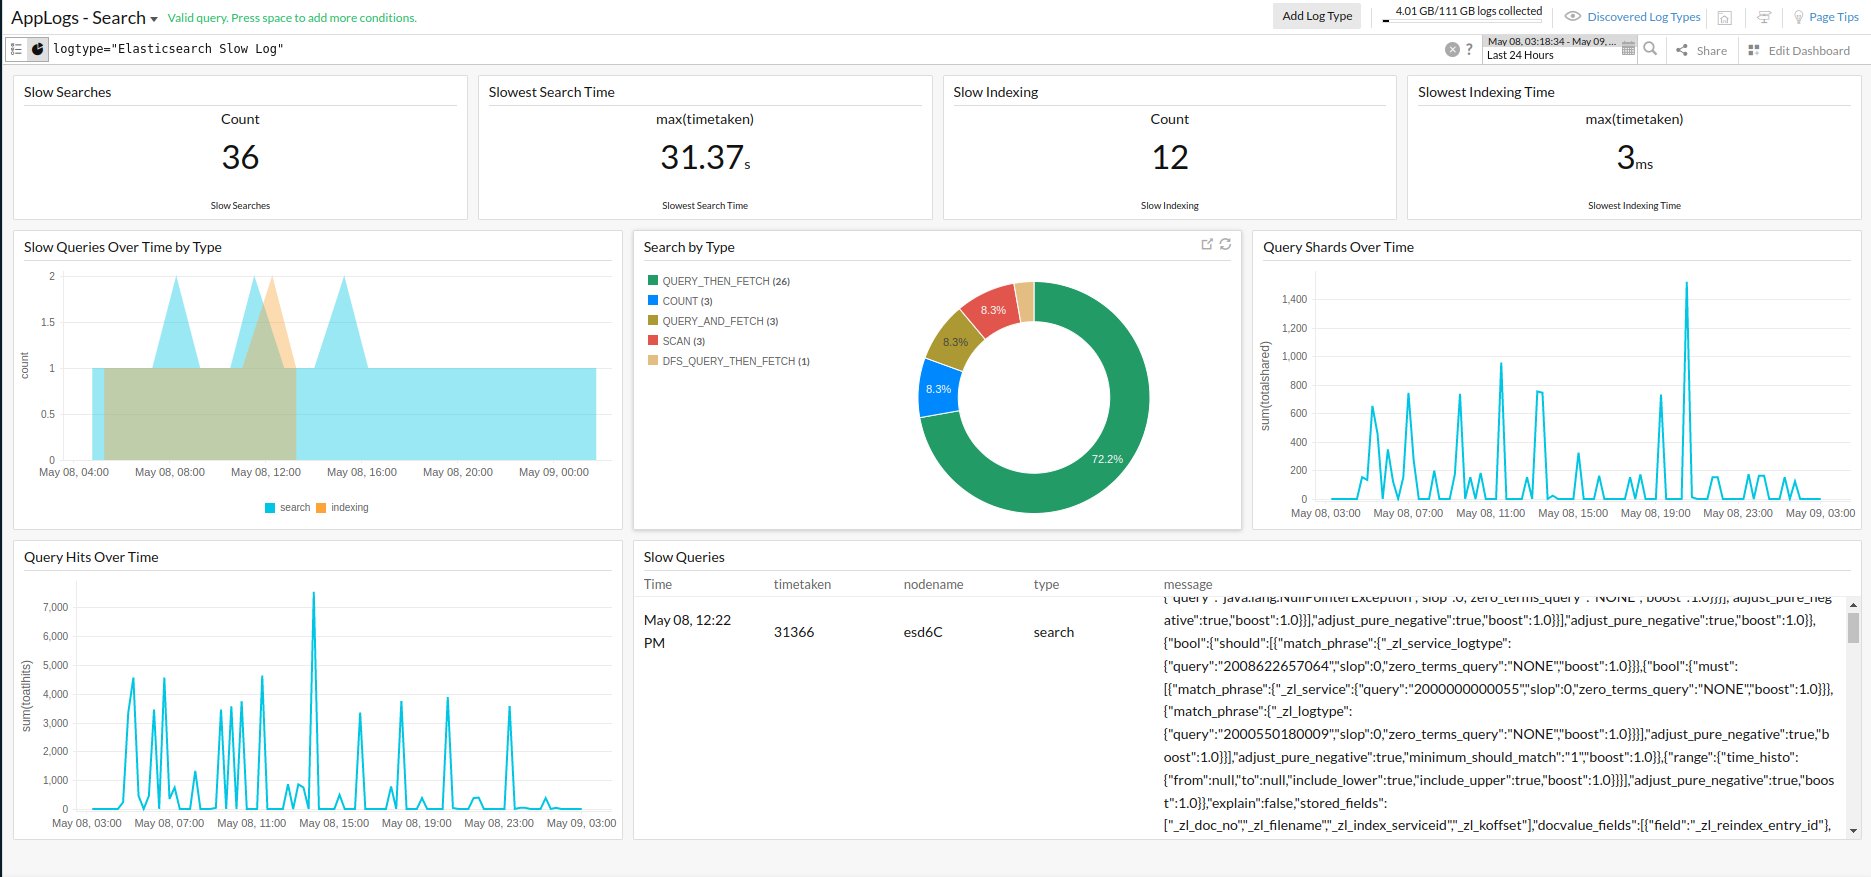
Here's an image of the Elasticsearch slow log dashboard:
Use Site24x7's AppLogs to monitor the Elasticsearch slow logs that assist you in troubleshooting performance issues. Feel free to drop your feedback, suggestions, and feature requests as comments below.
Until next time,
Happy logging!