We would like to have a new feature on Custom Dashboards: the ability to display markers on custom dashboards details, based on datetime or period.
It would help users to read the boards and visually see when a particular internal event occurred: new version on production, hotfix deployment, heavy-impact scheduled jobs, etc.
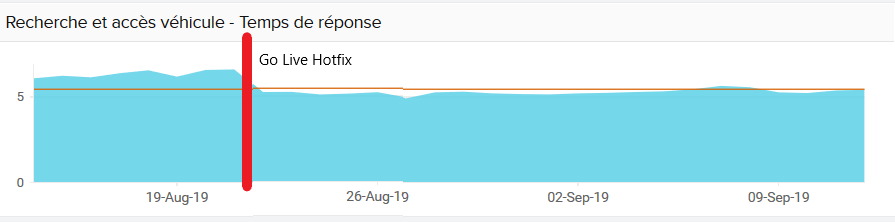
Example 1: marker with a given date and a description
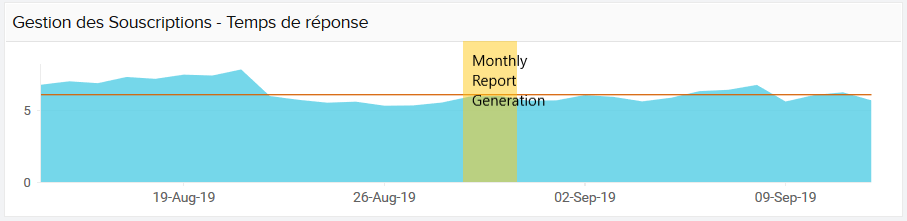
Example 2: period marker with a description
The main idea is to implement something like "Milestone Markers" for custom dashboards based on Web Transaction monitors (browser-simulated user interaction)
Thanks for raising this here Francois. We have noted this down in our feature requests. Btw, how do you manage your Milestone Markers now? Do you use APIs for it or do you use the client? Would be glad to have your feedback.
-Jasper
Product Manager, Site24x7
Hello Jasper, and thanks for your reply.
I'm afraid I won't be able to give you any useful input: we currently don't use the Milestone Marker system. In fact, we are using only one dashboard actively for now, which is based on Web Transaction monitors, so there is no Milestone Marker system available (unless I missed something ?)
Kind regards,
François
Dear Francois,
Thanks for giving some insights. We already have Milestone Marker as a feature in Site24x7 (its not yet supported in dashboards. I've asked the team to bring it in the dashboard widgets). You can mark milestone when you update a new version of the product, hotfix that you deploy for your app. Additional you can also automate the process with our milestone marker apis if you are into CI/CD pipeline.
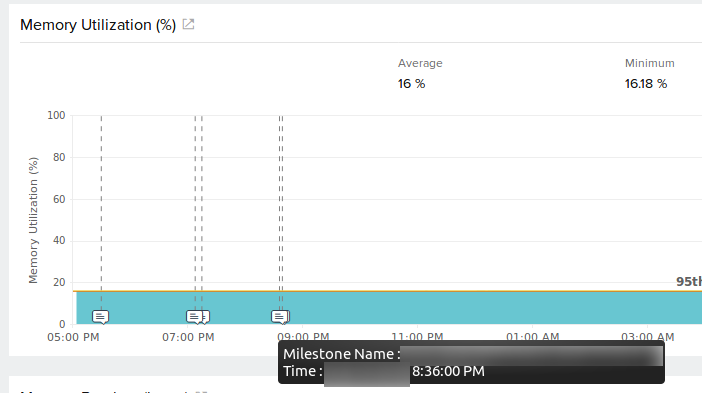
You can view the markers in the charts in you monitor details page.
-Jasper
Product Manager, Site24x7
Hi Francois,
Showing milestone marker in dashboard has been fixed and released.
-Jasper
Dear Jasper,
I was going to ask very similar questions and then found this thread, so I hope you don't mind if I expand on this.
First, I welcome showing markers in Dashboars. Still, if I look at the builtin dashboards for a Linux Serve monitor, the Summary tab shows markers, while the more detailed tabs (CPU, memory, etc) don't. Is that intended? Am I missing something?
My second question to you would be the following: Milestone markers seem intended for - well - milestones :)
That is, they are not expected to be that many.
What I would like to mark are specific tasks that are part f various ETL processes. That would greatly help to see how such tasks individually affect system resources. I would expect something between 50-100 markers a day needed on every server for this purpose.
Do you think this would go beyond the intended use of Milestone Markers, and not work well?
Thanks for your input,
Roberto
Dear Roberto,
Thank you for searching in the community and avoiding duplicates.. :)
Let me answer your 2nd question first.
Though we have named the feature as Milestone Markers we can scale to mark more than 100. You can add your ETL processes as Markers and it will work.
Coming to the first question, for attributes that have granular configurations like CPU Core (for which you can have core level thresholds set) we don't show. However, let me check the feasability of providing Markers for these attributes too.
If you face any issue do let me know.
btw, how do you use this feature? Do you use it from client or is it API driven?
-Jasper
Product Manager, Site24x7
Dear Jasper, thanks for you quick reply. It's great to know I can use this without abusing it.
As for your last question, I'm not using the feature yet, but I was planning to create markers via API calls.
The ETL is script-based, so it should be relatively easy to do this via curl calls. I've just gone through the documentation and obtained a working token, with a Self Client registration.
The original problem is to measure resource consumption of various processes in this ETL.
In principle, I could collect metrics about a process (and all its sub-processes) with the usual Linux tools, and then make my own plots. The biggest obstacle to this approach is that the ETL triggers activities from processes that are not in the same process tree. In particular the most resource-hungry ones are database processes that are managed by a completely detached daemon. So direct measuring of something that is not in the same process tree and then try to make sense of the big picture becomes cumbersome.
I thought it would be much easier to simply mark the start and the end of each task in the already available metrics in site24x7. Then I can just look at spikes in a plot and see what tasks were running at that moment.