Sorry for the inconvenience caused.
Please let us know the following things to debug the case further.
1. Did you update the mysql, python or software update in your server where MySQL is running?
2. What is python version and pymysql version installed in the MySQL server?
3. If possible, please share the agent logs as zip for analysis.
Please reply to this thread, we are glad to help you to solve the Plugin monitor.
Muralikrishnan
Product Manager
Hi Auxilium,
Thanks for your patience.
After analysing the logs, we suspect that Python path given in the mysql_monitoring.py was not correct. Due to that, Site24x7LinuxAgent, couldn't able to execute the plugin successfully and thrown the below error.
- mysql_monitoring.py 2023-01-12 16:34:53,679 Worker 3, plugin out - {'result': False, 'timedout': False, 'error': '/bin/sh: 1: Syntax error: "(" unexpected\n', 'exit_code': 2} | error out - {'status': 0, 'msg': '/bin/sh: 1: Syntax error: "(" unexpected\n'}
To solve this issue, please follow the below steps.
1. Open the terminal, execute command "which python3". It will give result of python3 path.
2. Copy the path, open and edit the mysql_monitoring.py, in the first line of the script with shebang character "#!" replace the path with copied one.
Eg : #!/usr/local/bin/python3
Once done, please wait for next data collection the plugin will be shown in the Site24x7 web client. To navigate Site24x7 portal -> Server -> Plugin Integration -> Check your MySQL monitor.
Suppose if there is no change in python3 path, for further analysis please execute the mysql_monitoring script manually as below format. This format is exactly how our Site24x7LinuxAgent executes the plugin, hence it will be helpful find exact error.
./mysql_monitoring.py --host=“<hostname>“ --port="3306" --username="<username>" --password="<password>"
Note: The parameter should be same as configuration given in mysql_monitoring.cfg.
Please post this script output in the community thread. We will help to analyse the issue.
Regards,
Muralikrishnan
Product Manager
Site24x7
- /opt/site24x7/monagent/plugins/mysql_monitoring$ which python3
- /usr/bin/python3
- /opt/site24x7/monagent/plugins/mysql_monitoring$ sudo cat mysql_monitoring.py
- #!/usr/bin/python3
- /usr/bin/python3: can't open file './mysql_monitoring.py': [Errno 13] Permission denied
- /opt/site24x7/monagent/plugins/mysql_monitoring$ sudo python3 mysql_monitoring.py --host="******" --port="3306" --username="******" --password="*****"
- {
- "aborted_clients": 196.0,
- "aborted_connects": 798.0,
- "application_queries": 227216274.0,
- "applog": {
- "logs_enabled": false
- },
- "blocks_not_flushed": 0.0,
- "buffer_pool_pages_data": 1335054.0,
- "buffer_pool_pages_dirty": 0.0,
- "buffer_pool_pages_flushed": 95754693.0,
- "buffer_pool_pages_free": 11100850.0,
- "buffer_pool_pages_total": 12451840.0,
- "buffer_pool_read_ahead": 188.0,
- "buffer_pool_read_ahead_evicted": 0.0,
- "buffer_pool_read_ahead_rnd": 0.0,
- "buffer_pool_read_requests": 9412496811.0,
- "buffer_pool_reads": 867169.0,
- "buffer_pool_wait_free": 0.0,
- "buffer_pool_write_requests": 3404102337.0,
- "cached": 78.0,
- "client_queries": 114663717.0,
- "com_delete": 837494.0,
- "com_insert": 22176798.0,
- "com_rollback": 141964.0,
- "com_update": 28832920.0,
- "commit": 59219202.0,
- "connected": 3.0,
- "connection_errors_max_connections": 0.0,
- "connection_usage": 0,
- "created": 81.0,
- "data_fsyncs": 193008294.0,
- "data_length": 0,
- "data_pending_fsyncs": 7640.0,
- "data_pending_reads": 0.0,
- "data_pending_writes": 0.0,
- "data_reads": 912572.0,
- "data_writes": 430637391.0,
- "delete_multi": 0.0,
- "disk_tables": 1110912.0,
- "free_blocks": 0,
- "free_memory": 0,
- "full_join": 7588630.0,
- "full_range_join": 0.0,
- "handler_delete": 194630007.0,
- "handler_rollback": 142036.0,
- "handler_update": 48334612.0,
- "handler_write": 347703094.0,
- "heartbeat_required": "true",
- "hits": 0,
- "in_cache": 0,
- "index_length": 0,
- "insert_select": 0.0,
- "inserts": 0,
- "key_reads": 0.0,
- "key_writes": 0.0,
- "log_waits": 3554.0,
- "log_write_requests": 2636084873.0,
- "log_writes": 333052184.0,
- "lowmem_prunes": 0,
- "max_connections": 20480.0,
- "max_data_length": 0,
- "max_execution_time_exceeded": 0.0,
- "max_used_connections": 92.0,
- "merge_passes": 0.0,
- "mysql_node_type": "Master",
- "not_cached": 0,
- "open_cache_hits": 336782017.0,
- "open_cache_misses": 13678.0,
- "open_cache_overflows": 1902.0,
- "open_files": 31.0,
- "open_files_usage": 0.002956390380859375,
- "open_tables": 6379.0,
- "os_log_fsyncs": 135622696.0,
- "os_log_pending_fsyncs": 0.0,
- "os_log_pending_writes": 0.0,
- "os_log_written": 253805127680.0,
- "pages_created": 3758934.0,
- "pages_read": 908886.0,
- "pages_written": 95754816.0,
- "plugin_version": "3",
- "prepared_stmt_count": 0.0,
- "range": 0.0,
- "range_check": 0.0,
- "read_first": 58079045.0,
- "read_key": 748834925.0,
- "read_requests": 0.0,
- "read_rnd": 257687939.0,
- "read_rnd_next": 3704269399.0,
- "reads": 0,
- "received": 19295192604.0,
- "replace_select": 0.0,
- "row_length": 0,
- "row_lock_time_avg": 0.0,
- "row_lock_waits": 0.0,
- "rows": 15154024.0,
- "rows_count": 0,
- "rows_deleted": 194481437.0,
- "rows_inserted": 264154037.0,
- "rows_read": 5456250067.0,
- "rows_updated": 48052880.0,
- "running": 0,
- "scan": 2166064.0,
- "select": 66020657.0,
- "select_range": 0.0,
- "select_scan": 74333740.0,
- "sent": 33596630493.0,
- "slave_running": 1,
- "slow_queries": 0.0,
- "table_locks_waited": 0.0,
- "tmp_files": 151.0,
- "tmp_tables": 43866226.0,
- "total_blocks": 0,
- "transactions": 59361166.0,
- "units": {
- "connection_usage": "%",
- "data_length": "bytes",
- "free_memory": "bytes",
- "index_length": "bytes",
- "max_data_length": "bytes",
- "open_files_usage": "%",
- "os_log_written": "bytes",
- "received": "bytes",
- "relay_log_space": "bytes",
- "row_count": "units",
- "row_length": "bytes",
- "row_lock_time_avg": "ms",
- "seconds_behind_master": "seconds",
- "sent": "bytes",
- "uptime": "seconds"
- },
- "update_multi": 0.0,
- "uptime": 3370304.0,
- "version": "8.0.31",
- "write_requests": 0.0,
- "writes": 51847212.0
- }
Hi Auxilium,

Thanks for your response.

Could you please check the following in the SIte24x7 web client?

To see the plugin monitor, login to your Site24x7 account.

Navigate to Server > click the respective Server monitor > Plugin Integrations > click mysql_monitoring.py.

This will take you to the MySQL monitoring details page where you will be able to see the metrics.

If the mysql_monitoring.py monitor doesn't show any data, please click the Reregister Plugins button to resume the data collection of the plugin. On the next data collection event, you will be able to see the data.
 Please let us know if you were able to troubleshoot and if you face further issues.

Thank you,

Suraj D
Site24x7 Team

Hi Auxilium,
Thanks for your patience.
After analyzing, we found that there was an issue with the mysql_monitoring.py plugin. It used the reserved keyword "version" and assigned the value of MySQL's version.
Since it was a reserved keyword "version", it didn't accept the decimal value and threw an error.
Could you please change the key from "version" to "mysql_version" in the mysql_monitoring.py and perform the re-register option present in the Site24x7 web client.
Navigate to Server > click the respective Server monitor > Plugin Integrations > click "Reregister Plugins
Once done, the mysql_monitoring.py will be added for monitoring.
Apologies for the inconvenience caused.
Hope this works for you. If you need any clarification, please reply to this thread.
Thanks,
Muralikrishnan,
Product Manager,
Site24x7.

Hi Auxilium,
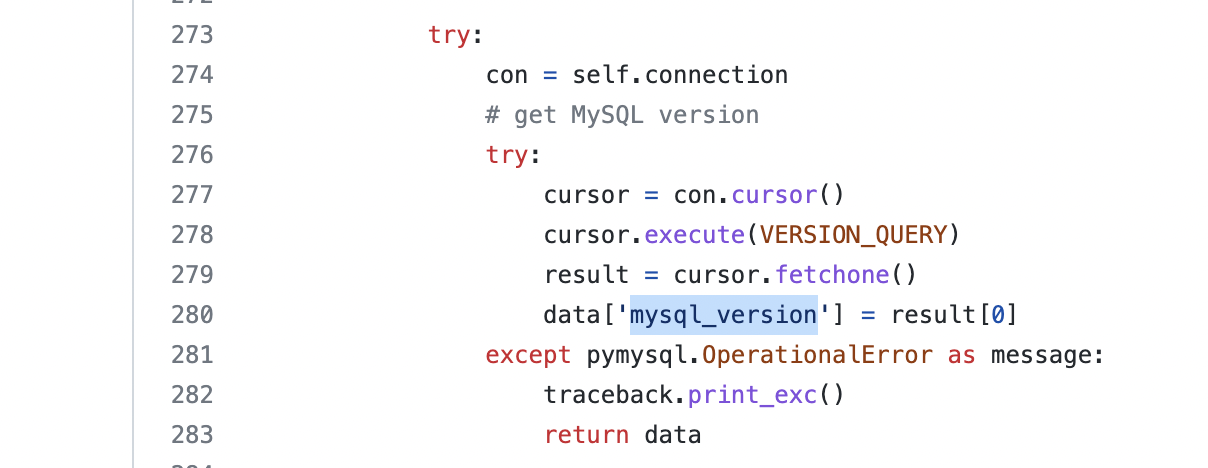
Any query change is not required. In the mysql_monitoring.py plugin file, you have to change the line at 280 from "data['version'] = result[0]" to "data['mysql_version'] = result[0]" as shown in the below image.
We already fixed the issue from our side in the Site24x7's plugin repository in the mysql_monitoring.py file.
Alternatively, you can also delete the existing mysql_monitoring.py and perform the wget to get the new file and place it under "/plugin/mysql_monitoring/" folder.
Here's the link:
Once done, re-register the plugin in the Site24x7 web client.
Navigate to Server > click the respective Server monitor > Plugin Integrations > click "Reregister Plugins
In the next data collection event, the mysql_monitoring.py will be added for monitoring.
We hope this will work.
If you face further issues, please reach out to support@site24x7.com and share the ticket ID. We'll prioritize and debug the issue.
Product Manager,