Hi Findlay,
Thank you for raising this request. For a Real User Monitoring feature that is priced based on the number of page views, showing a graph with daily usage of page views is a vital one. We will implement this feature with immediate priority.
The next obvious question is when can we expect it to be done. The team is working on a list of features and we will re-prioritize things and take this too. So, at this juncture, I may be unable to commit a concrete date for the same. But, will surely keep this space updated once done. Hope you will understand.
Meanwhile, if you are looking for any other such reports or missing features, please post it here. Hands-on feedback from customers will help us improve the product.
Regards,
Raji.
Hi Findlay,
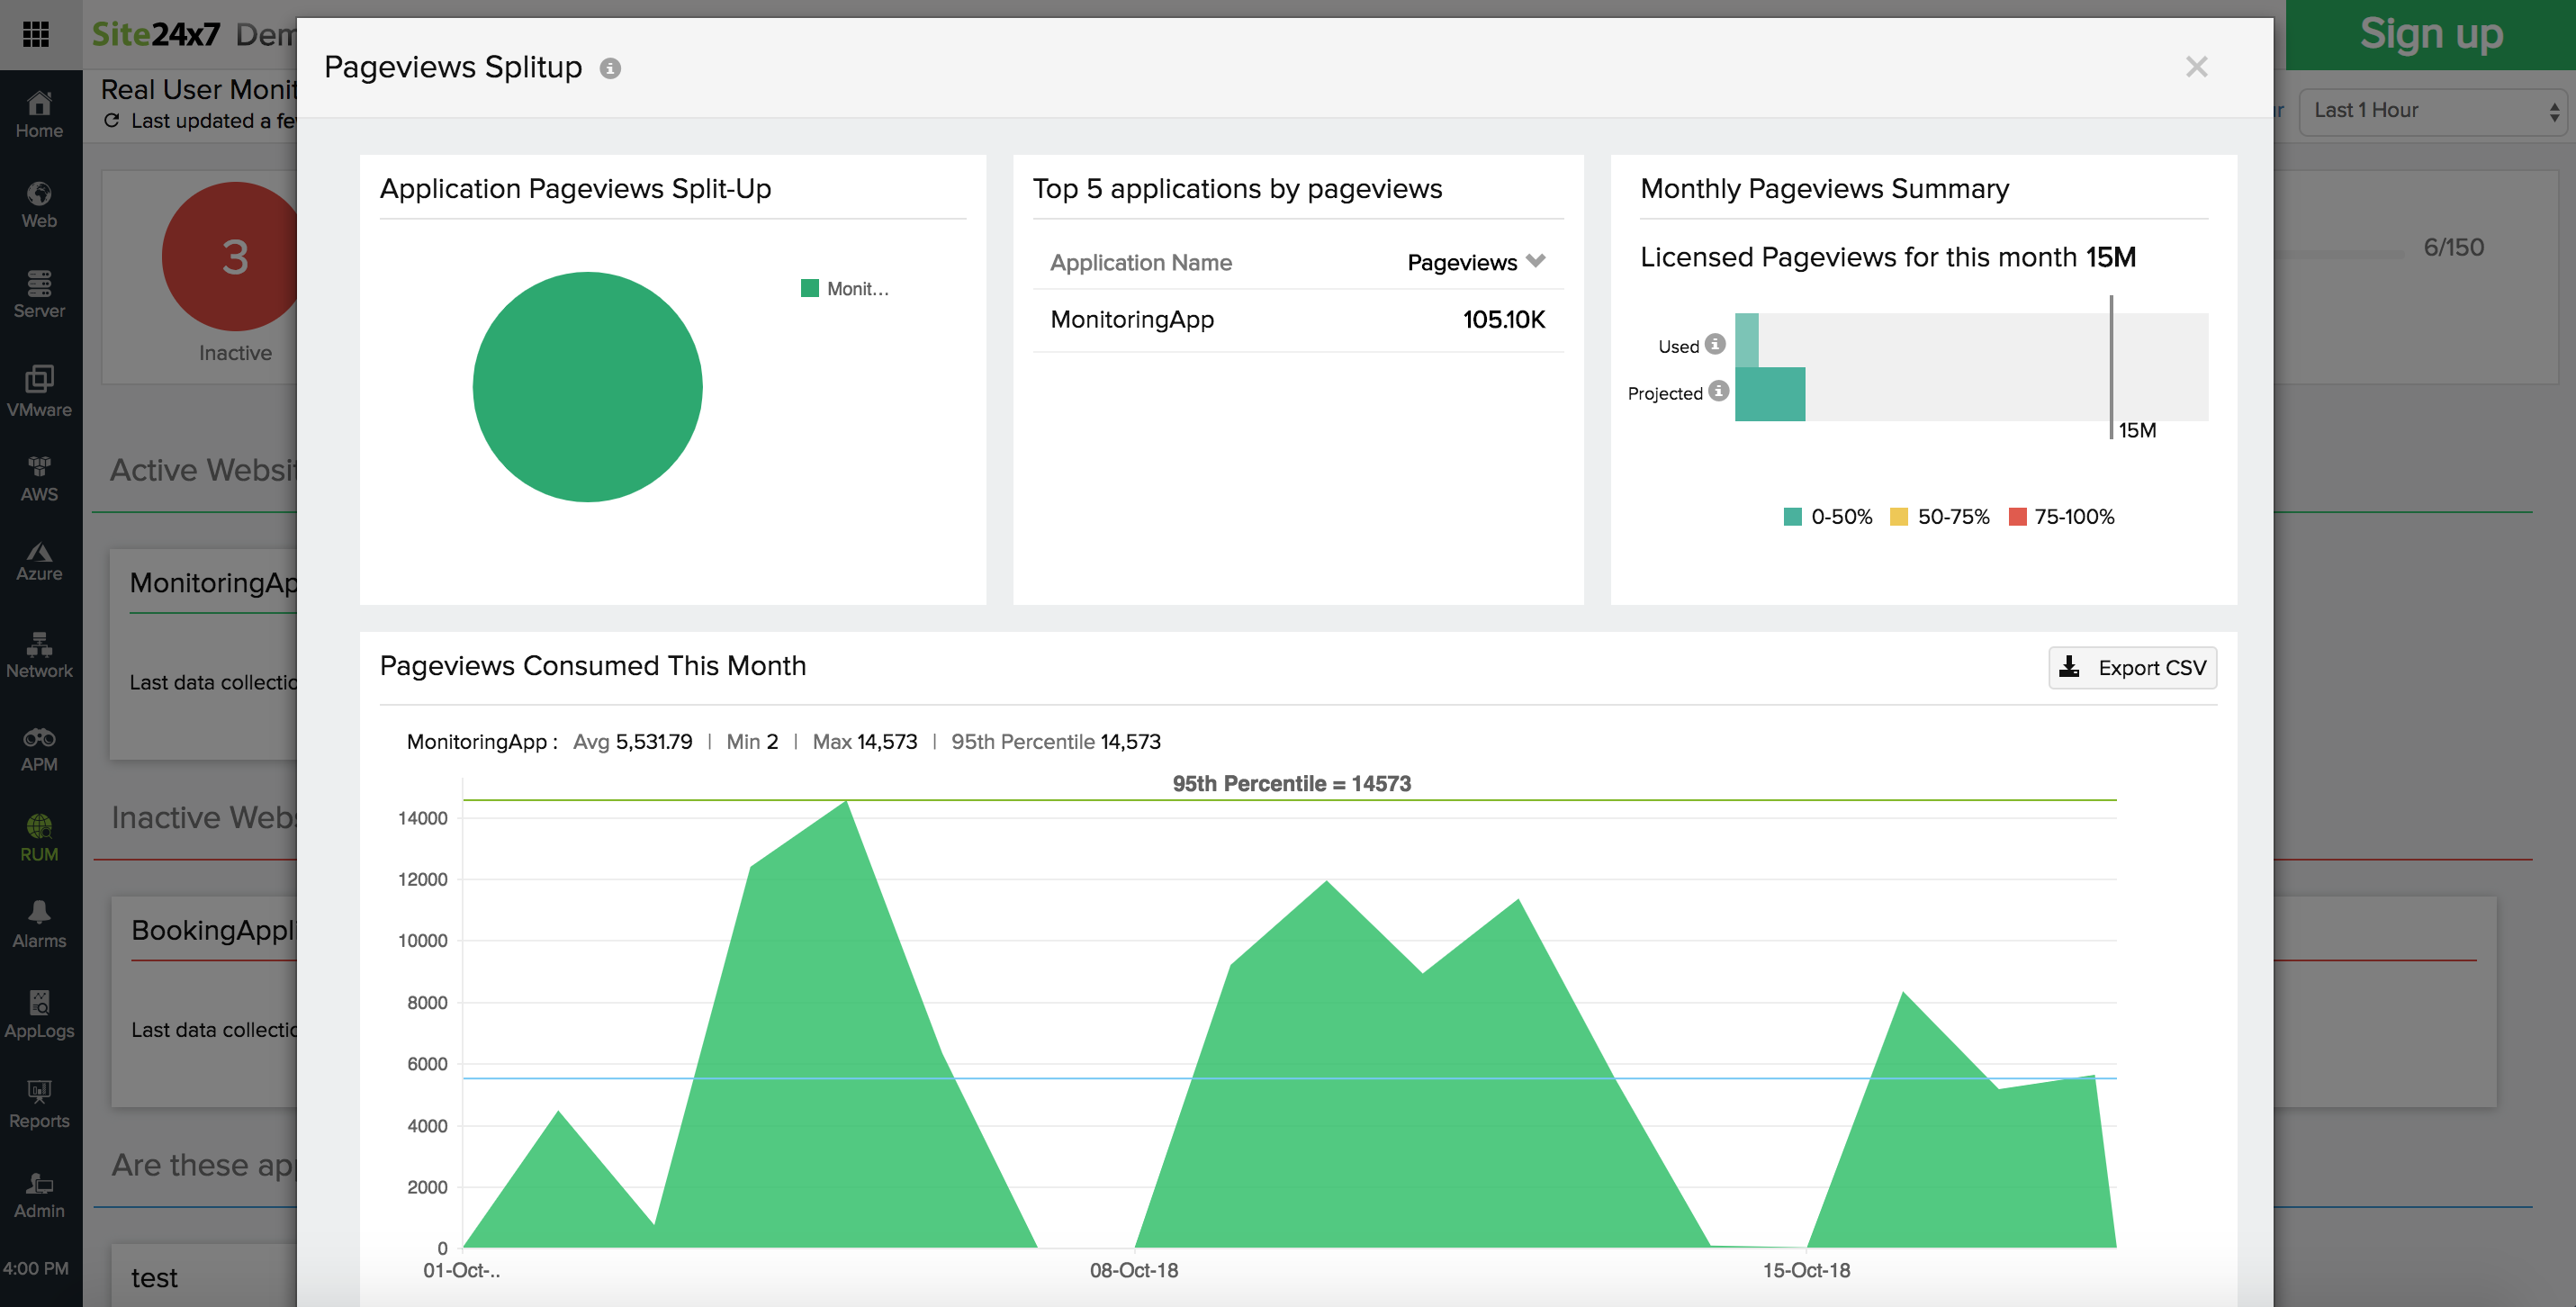
Page Views Report for RUM Applications in graphical form and export as CSV option is available in our RUM Dashboard.
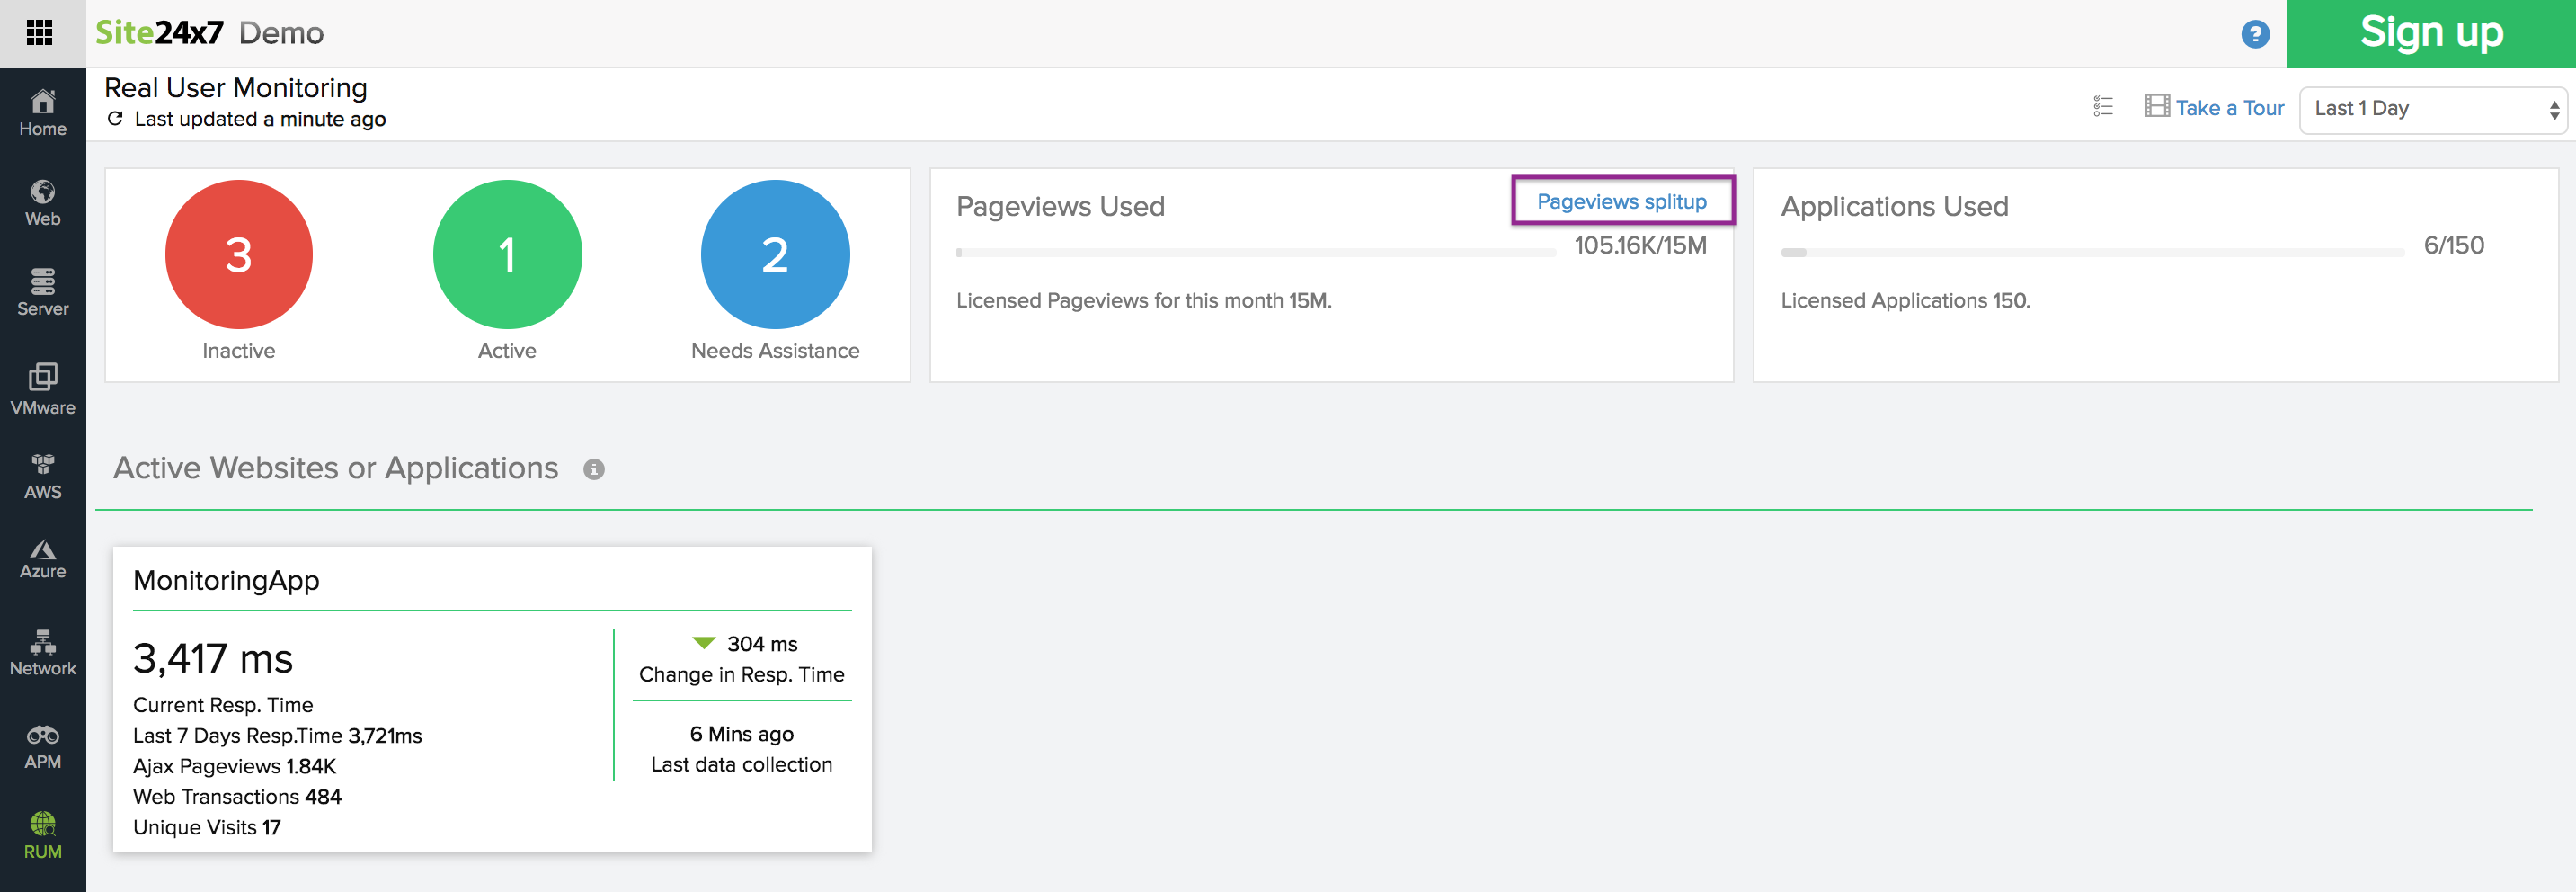
Click on the "Pageviews splitup" link in RUM page to get the details as seen below.
Hope this helps.
Regards,
Raji.