Today it is being limited to 24 widgets per dashboard, however, we have a cluster with a number close to 35.
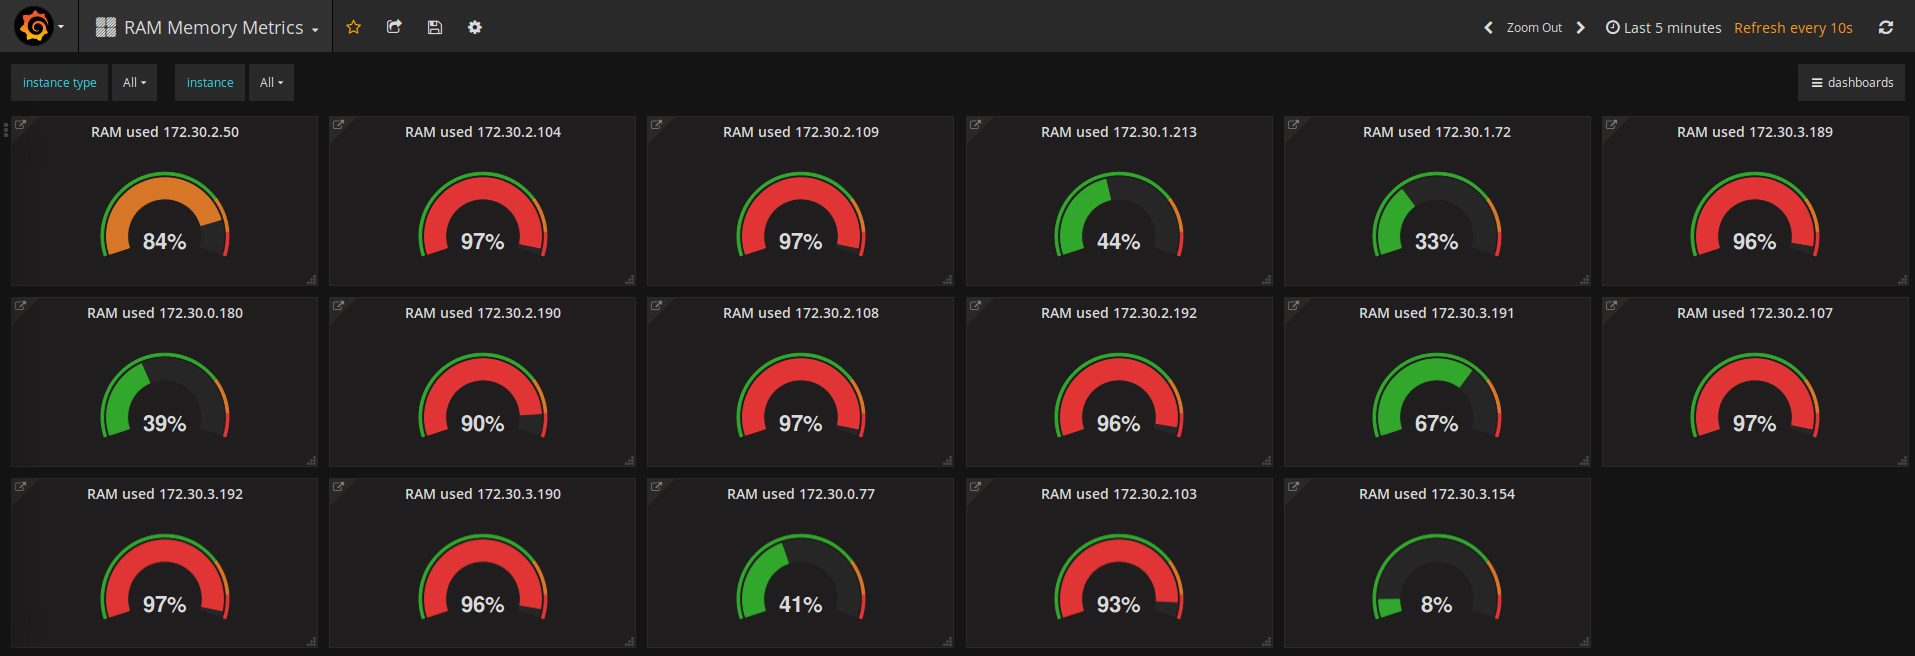
I would like to create a dashboard where i can analyze in a macro environment, which instance is consuming more memory.
Attachment print screen od another solucion we use and would like to do the same with Site24x7
Hi Alam,
I am unable to see the screen. Can you attach it once more please.
-Jasper
Yes, attached again.
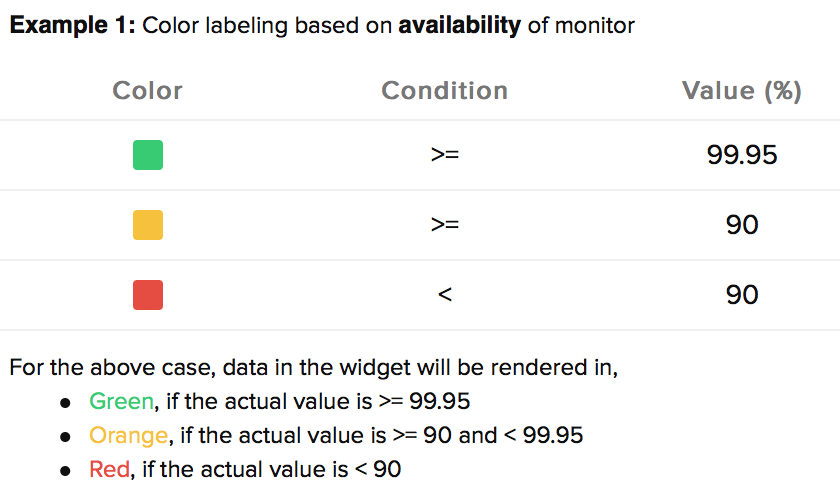
It would also be important to have dashboard colors, for example:
< 50% = green
= 50% to < 80% = yellow
> 81% = red
Tha would be very good!!
Attach the dashboard that i managed to do with Site24x7, but as it is the only color, it is not so easy to identify which instance is in trouble.
Hi Alam,
We have increased the no.of widgets that can be added in a dashboard to 100 now. I'm sure this will be useful for you and many others who use our custom dashboards.
-Jasper
Product Manager, Site24x7
Hi Alam,
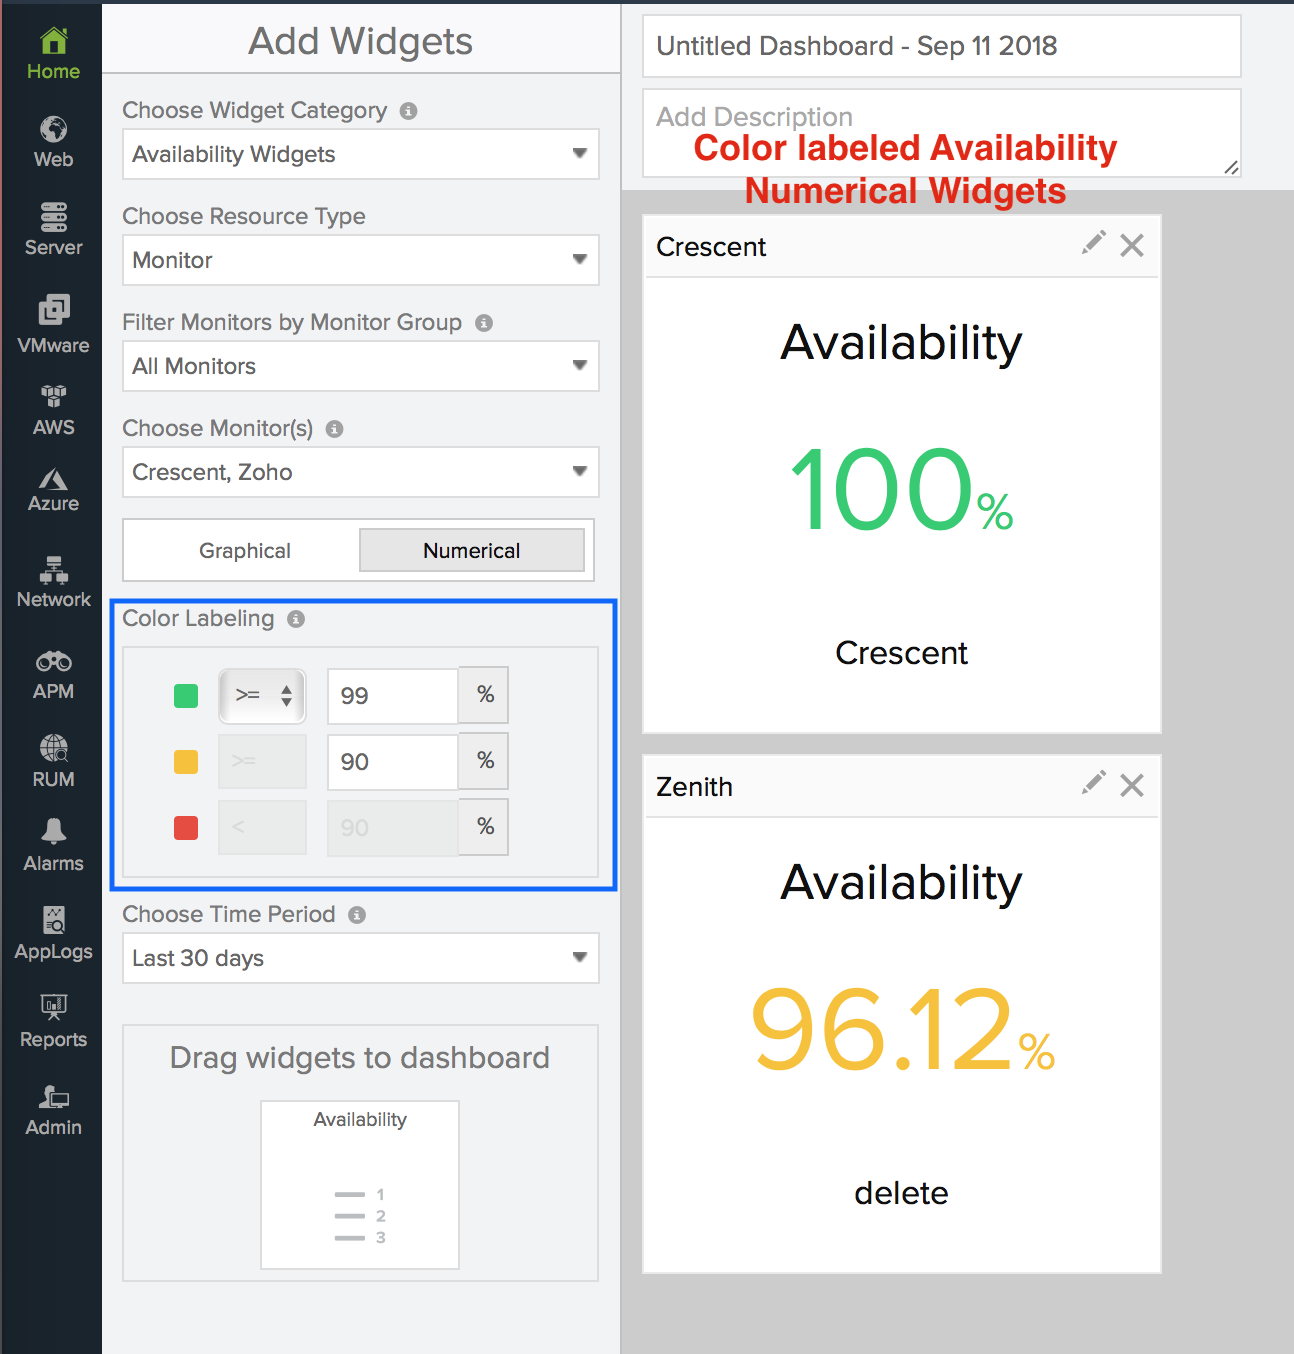
We're happy to announce that your feature request on color labeling is now live for the availability and performance numerical widgets. By setting up unique conditions and specifying custom metric values, you can render the widget data in green, orange, or red. Once the actual data breaches any of the defined conditions, the corresponding color gets applied to the value in the widget. You can learn more about this enhancement and new widgets by following our community post on Custom Dashboard.
Color labeling for availability numerical widget
Thanks,
Abhiram