The highest priority for me with any APM is to view segfaults or any uncaught exceptions. We're currently using the PHP APM and the info we were given is that in order do do this, we'd have to change the agent settings to capture every transaction regardless of length. The main problem here is that with tons of transactions I'm not so sure how well Site24x7 handles this and how much additional server resources this will take up.
It would be very useful if the PHP agent logged all uncaught exceptions or unexpected script exits.
Or do I have this wrong, and there's already a good way to handle and detect this efficiently? I'm used to New Relic where uncaught errors just appear automatically and it's trivial to see exactly what went wrong.
Hi William,
The APM PHP Agent can track most of the PHP errors, and capture the stacktrace for uncaught exceptions irrespective of the time taken by the transaction. We suggest changing the apdex and trace thresholds mainly for capturing trace on successful transactions.
You can view such uncaught exceptions in the Traces tab. Additionally, you can filter out the failed transactions in the transaction tab as well. Have attached the illustration below,
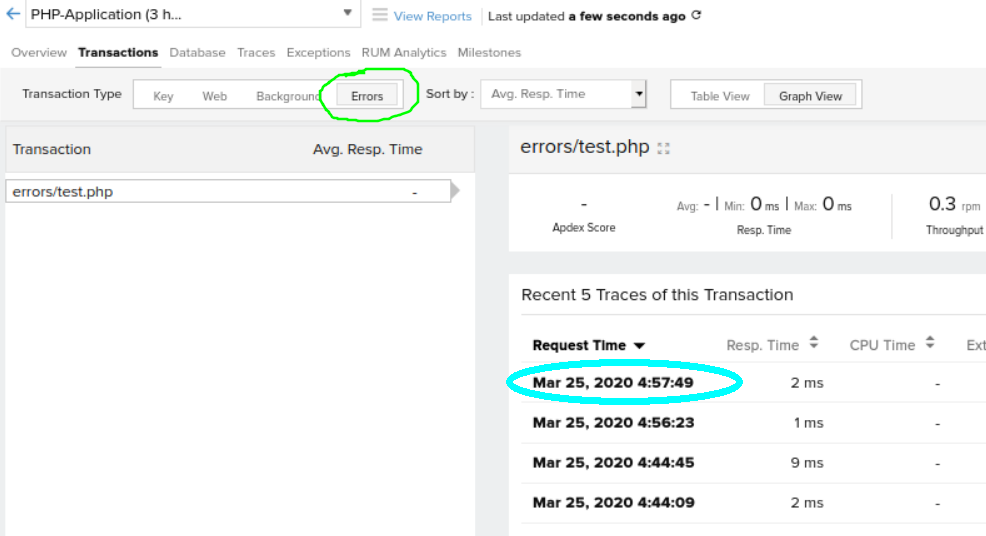
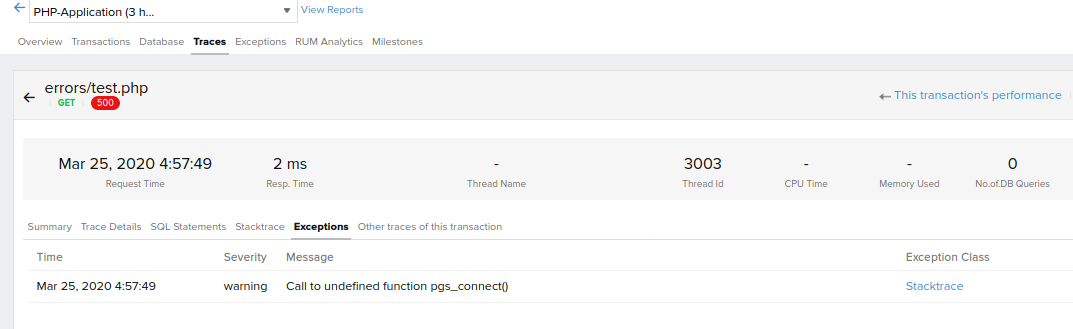
Clicking on the trace, will show you the details of that failed transaction. You can find the root cause of the error in the Exception sub-tab.
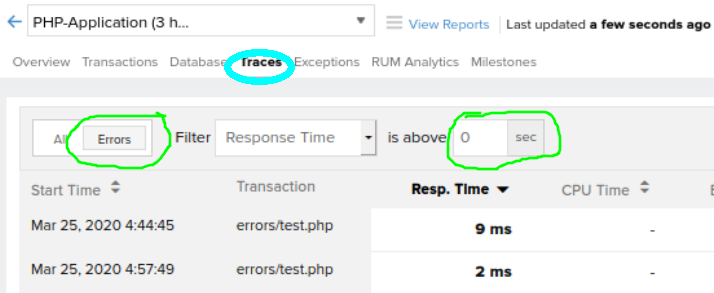
To view all the failed transaction trace from the Traces tab, use the "Errors" toggle and adjust the filter to view traces below the default value (2 sec).
Let us know if you have further requirements or if you are facing any difficulties tracking your errors. Kindly note that, APM would not be able to track segfaults as they mostly happen in the C run-time layer than in the language layers. We would recommend our log monitoring solution to track web server errors.
Thanks & Regards,
Shrinivasan
Developer, APM Insight
Thanks, That has helped some. I still have a few issue that need some clarification:
- When a click on a Stacktrace from the Trace's Exception tab, it only shows the top 5 lines of the stack trace. That doesn't always give me enough context to know where the issue was. Is there a way to see the full stacktrace?
- For example if the exception was in a library, 5 lines might still be within the library meaning I don't know where in my code I can catch the exception.
- Is there a way to not treat 4XX status codes as an error? I don't need or want 400 status codes burying real issues when there's nothing I can do about a 400 code. It's not my fail, it's the client's fault for requesting an invalid resource or passing invalid credentials. I only care about 5XX codes since that's a server error.
- I saw documentation on turning this off for the Java agent, but I can't find how to do this for the PHP agent.
Thanks,
Will
Hi William,
Thanks for your feedback, and regret the inconvenience.
1. I have confirmed the behaviour. We had a hard-coded limit of capturing only 5 lines in the exception stack-trace. We'll increase the limit in our upcoming releases. If your requirement is immediate, you can contact our support for a quick patch.
2. PHP Agent doesn't support that configuration yet. We'll incorporate this in our next update as well.
Thanks & Regards,
Shrinivasan
Developer, APM Insight