The wait is over — our log management solution is now ready to monitor and manage logs across servers and applications. Site24x7 AppLogs, developed with you in mind, can be scaled to handle terabytes of log data and it has been battle tested by handling logs of our Zoho Services.
What does it do?
Site24x7 AppLogs collects logs from your server and lets you monitor all your system and application logs from a single dashboard. You can collect, consolidate, and search content in your application and server logs across data centers to gain actionable insights for quicker troubleshooting.
How do I get started?
All you need to do is add a server monitor to Site24x7. The server agent then installs an AppLogs agent and looks for predefined log types available on your server. By default, we extend support to over 20 application logs including Apache, Cassandra, IIS, and Redis as well as log frameworks like Log4j, Logback, Log4Net, and Nlog. In addition to the predefined log types, you can also create a custom log type and define a log profile .
How does it work?
Once you add a new log type to your log profile, it will automatically be added to the set of supported log types. Any logs that match the pattern are uploaded to the Site24x7 server (logu.site24x7.com), which means you're all set to monitor your logs. Ensure that you whitelist this domain so you don't run into any issues down the road.
How can it help me?
With Site24x7 AppLogs, you can track and fix a wide array of problems, including external database call failure, UI unresponsiveness, file upload failure, and dynamic user input verification. This also helps you reduce Mean Time to Identify (MTTI) and Mean Time to Repair (MTTR).
What is special about it?
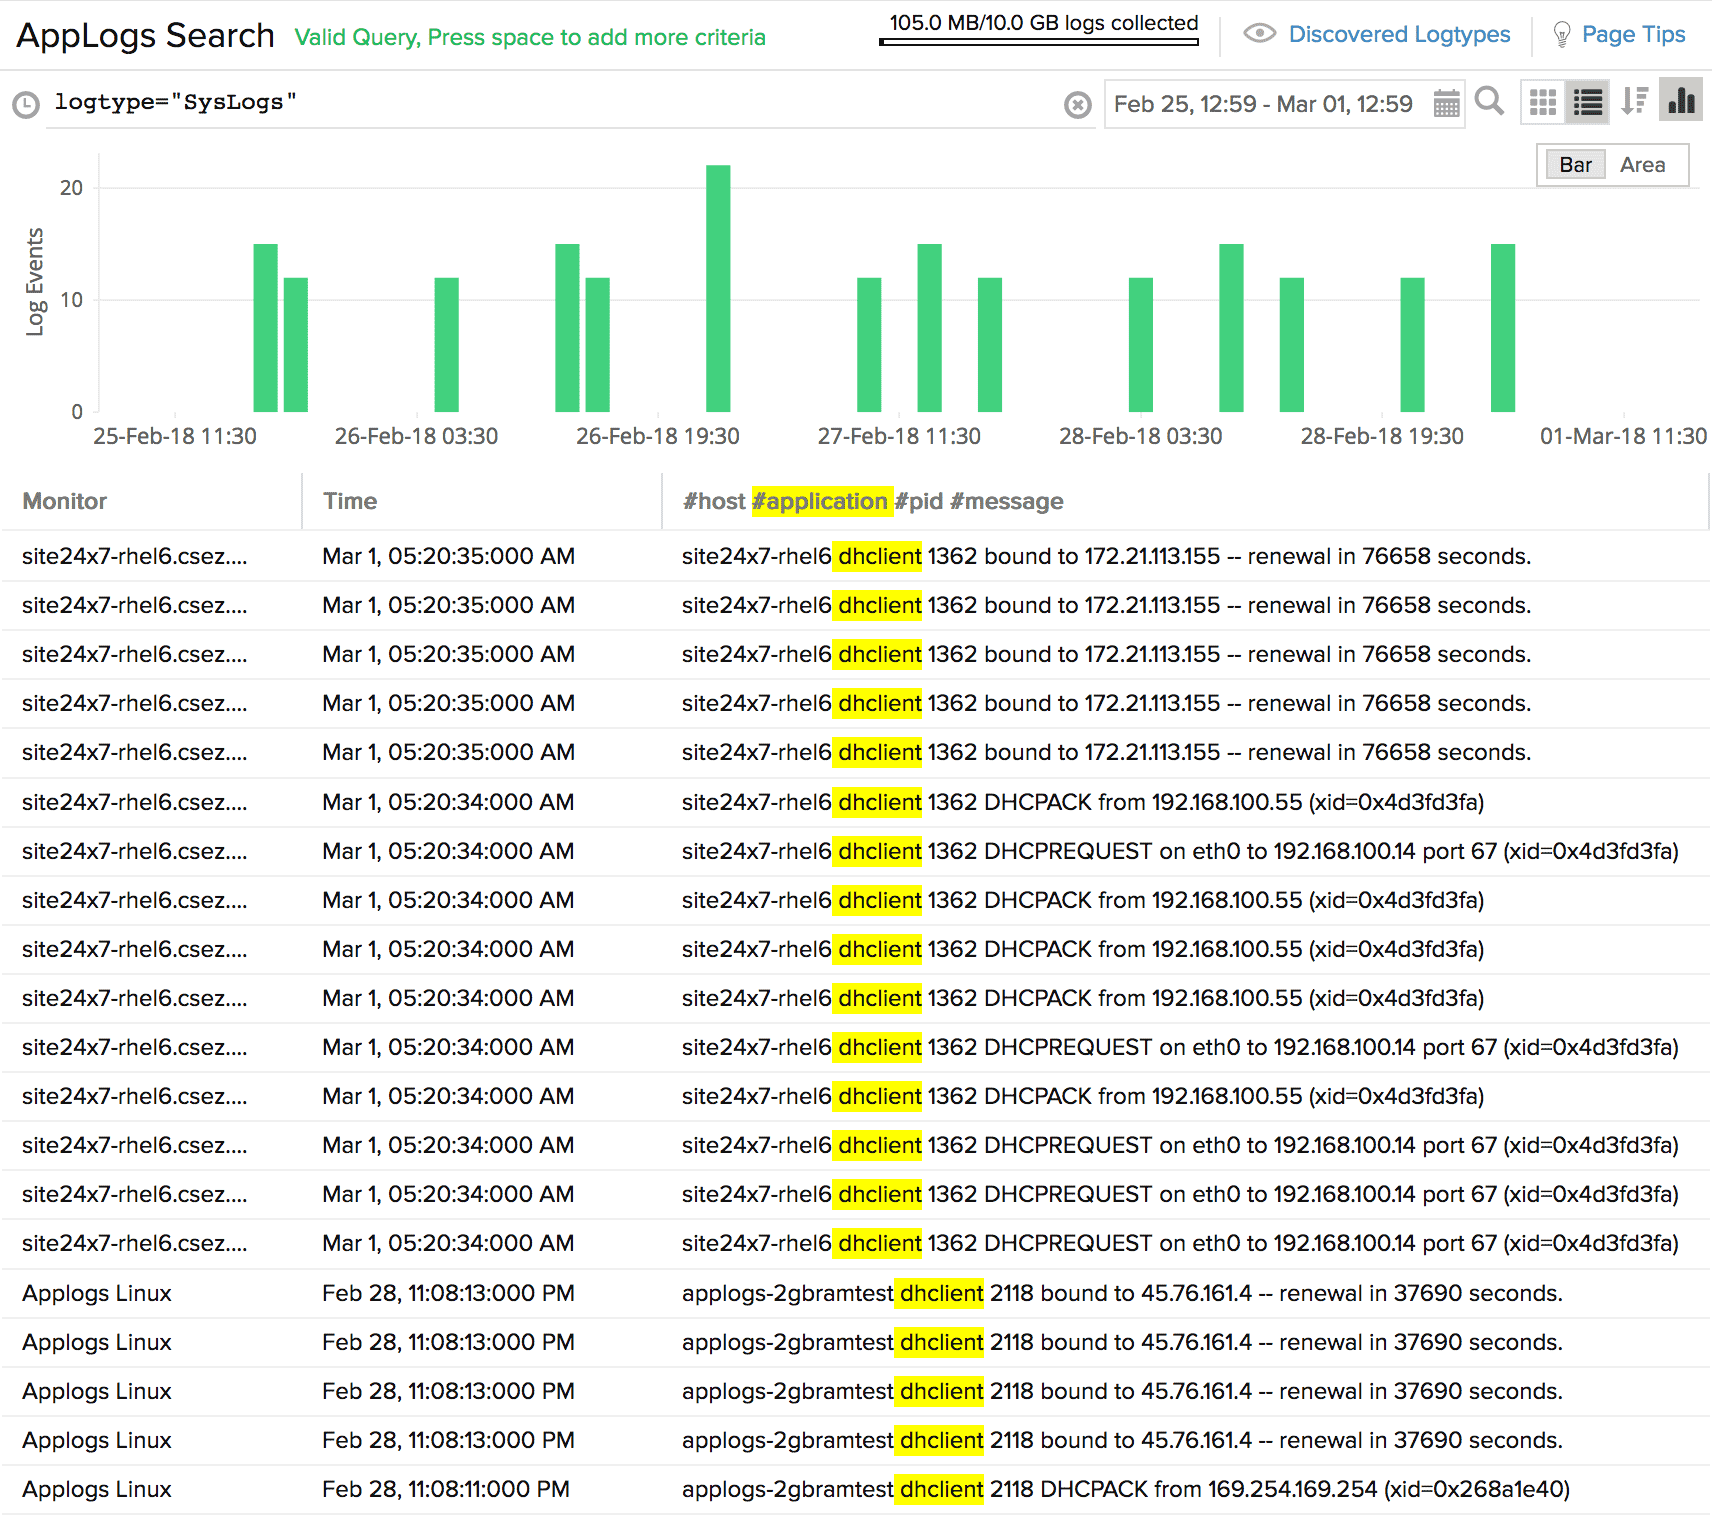
Using our single, intuitive dashboard, you can perform a query language search and view all production application logs and performance issues in the same console. Your developers and IT operators won't need access to production servers for server troubleshooting. With graphs for visual aid, keep track of all your servers and applications' logs from a single console.
Consider the following query as an example:
logtype="SysLogs" and application CONTAINS " systemd "
This query fetches the log entries with the log type "SysLogs" and the application field containing "systemd". You can also perform searches by combining queries like groupby, timeslice, or both. Read our help documentation to learn more.
What has changed?
In the process of enhancing our product, we included a number of features for Site24x7 AppLogs after the release of the open beta. These include Log Trend Analysis, Query Language Search, Recent Searches, and Saved Searches along with some back-end enhancements to boost performance.
Our efforts don't stop here; we've got plenty more features in development. Feel free to share your feedback and suggestions in a comment below, and enjoy monitoring with Site24x7!
We already pay for website monitoring, starter package, but I couldn't find the price for the log management feature. It is also not clear which package includes log management. I think you should promote this feature in a better way.
Hello,
The AppLogs feature is available across all our paid plans. The Starter Plan by itself gives you 500MB of logs every month.
You can purchase additional logs as add-ons under Admin >> Subscriptions >> Purchase add-ons on your Site24x7 account. The Applogs add-on is priced as below.
- Additional 10GB Logs: $10/month
how should i handle generated log files?
lets say i use nlog and create daily files or 10MB files
when can i delete them? or should i leave them on the server?
when they are actually uploaded?
Hello,
We start collecting last 24 hours logs that are configured in the log profile. In an ideal case, logs will be upload to Site24x7 servers with in 2 to 3 minutes. Hence you can keep only the last one-day logs in your system and remove the older ones.
How I can delete the applogs because my limit is 21 GB and its some server consumed 17 GB in 3 days only.
Hello,
We don't have an option to delete the logs. Our licensing is for Logs ingestion & search. It doesn't means, you can delete some logs and use it again.
This looks like a specific issue where your sever has pushed more logs. However you can restrict such uploads by setting limits for log uploads. Refer to this doc for more. If you need further assistance, please reach out to us at support@site24x7.com.
Regards,
Magesh Rajan
It will be great if we can filter logs at source before collecting to site24x7. E.g. collect logs with only certain event ids or certain event types e.g. error and/or warning. That would make applog much more cost effective to use and will be adopted more widely by customers.
I have 500 plus servers and it does not make sense to consume all event logs, most of which are NOT useful for diagnostics or troubleshooting an issue. Then why should I collect and pay for it? Isn't that a common sense?
Pl introduce the concept of black list / white list while collecting logs. Regex support to filter out unwanted logs at source would be ideal.
Thanks,
Ash
Hello,
We are already having an option to filter the events in the agent side itself. To achieve this you need to configure the unwanted event id's in the field configuration of "Windows Event Logs" log type present in your account. Follow the steps below to set the configuration.
- Log in to your Site24x7 account.
- Go to Admin > AppLogs > Log Types > click on the Log Type Windows Event Logs
- In the Sample Output table, hover over the field name Event ID to find the
icon and click on it. You'll be able to view the below Field Configurations pop-up.
Regards,
Magesh Rajan
Hi Magesh,
Just realised that I cannot clone or copy the existing Windows Event log type. Only action is allowed is edit the filter as per your post on the default Windows event Log type. If I were to create a filter one on Level Error and the another one for Error and Warning, I can't do that. Or may be there is a way, I don't know.
Basically, I want to associate certain group of servers to collect Windows event log, level error only, and another group of servers Error and Warning. How can I achieve that?
Thanks,
Ash
Hello,
You can create a multiple 'Windows Event Logs' log type in your account using the same sample log and log pattern, apply the filter configuration based on your requirement. Then associate this log type with the required group servers in the log profile. Likewise you can create multiple log type and log profile for windows event logs to achieve your requirement.
Note: Please select the 'Log Source' as 'Windows Event Log' while creating the log profile.
Regards,
Magesh Rajan
Hello,
You can provide a new log type name and try. Because log type name is not a problem but you have to use the same sample log and log pattern to make the 'Windows Event Log' work correctly.
Regards,
Magesh Rajan
Thank you Magesh for your help. I have now setup appropriate log types.
It will also be great if I can associate log profiles to monitors using configuration rule. In that way I can ensure that whenever a server is added to the system, we are also collecting the desired logs.
Kind Regards,
Ash
Hi Ash,
Thank you for raising your concern and we understand your requirement. We will take this as a feature request and update here once it's available.
Regards,
Magesh Rajan
Couple of suggestions:
1. At this moment, applog does not have any sub menu (for any others apps e.g. server, web, network, cloud there is a sub menu), which is inconsistent. For any other applog features (other than search) like, saved searches, log type, log profile, alerts, applog dashboard, I have to click on either admin or somewhere else to find them. It will make more sense to have those options available in sub-menu of applog. That will be consistent with other apps as well as easier for user to find those.
2. Currently there is no way we can store applog data for more than 30 days, even if I am willing to pay for additional retention period. For certain types or log profiles, I would like to extend the retention for more than 30 days.
3. I don't see how can I make my default view (in search) as tabular view rather than raw logs. It would be nice to have that option so that user can set their preference. It seems to default to raw log view every time I search.
4. The log type name allows only small letters and numbers. I find this is very restrictive. Why not allow - or _ and Capital letters? It will make name much more user friendly.
5. When we create a dashboard from applog search, there is no way to customise any further. Allow some flexibility, if possible.
BTW, I find applog very useful. It gives us much more visibility and easier to troubleshoot issues when you are trying to find a needle in the hay stack. Good job, applog team!
Thanks,
Ash
Dear Ash,
Thank your excellent suggestions and we are glad the you find Applogs very useful for troubleshooting. Regarding your suggestions
>>>1. At this moment, applog does not have any sub menu (for any others apps e.g. server, web, network, cloud there is a sub menu), which is inconsistent. For any other applog features (other than search) like, saved searches, log type, log profile, alerts, applog dashboard, I have to click on either admin or somewhere else to find them. It will make more sense to have those options available in sub-menu of applog. That will be consistent with other apps as well as easier for user to find those.
Thanks for the suggestion. Most of the features are available in the Applogs page itself to help users stay on the page. Below are places from where you can access them.
Saved Search
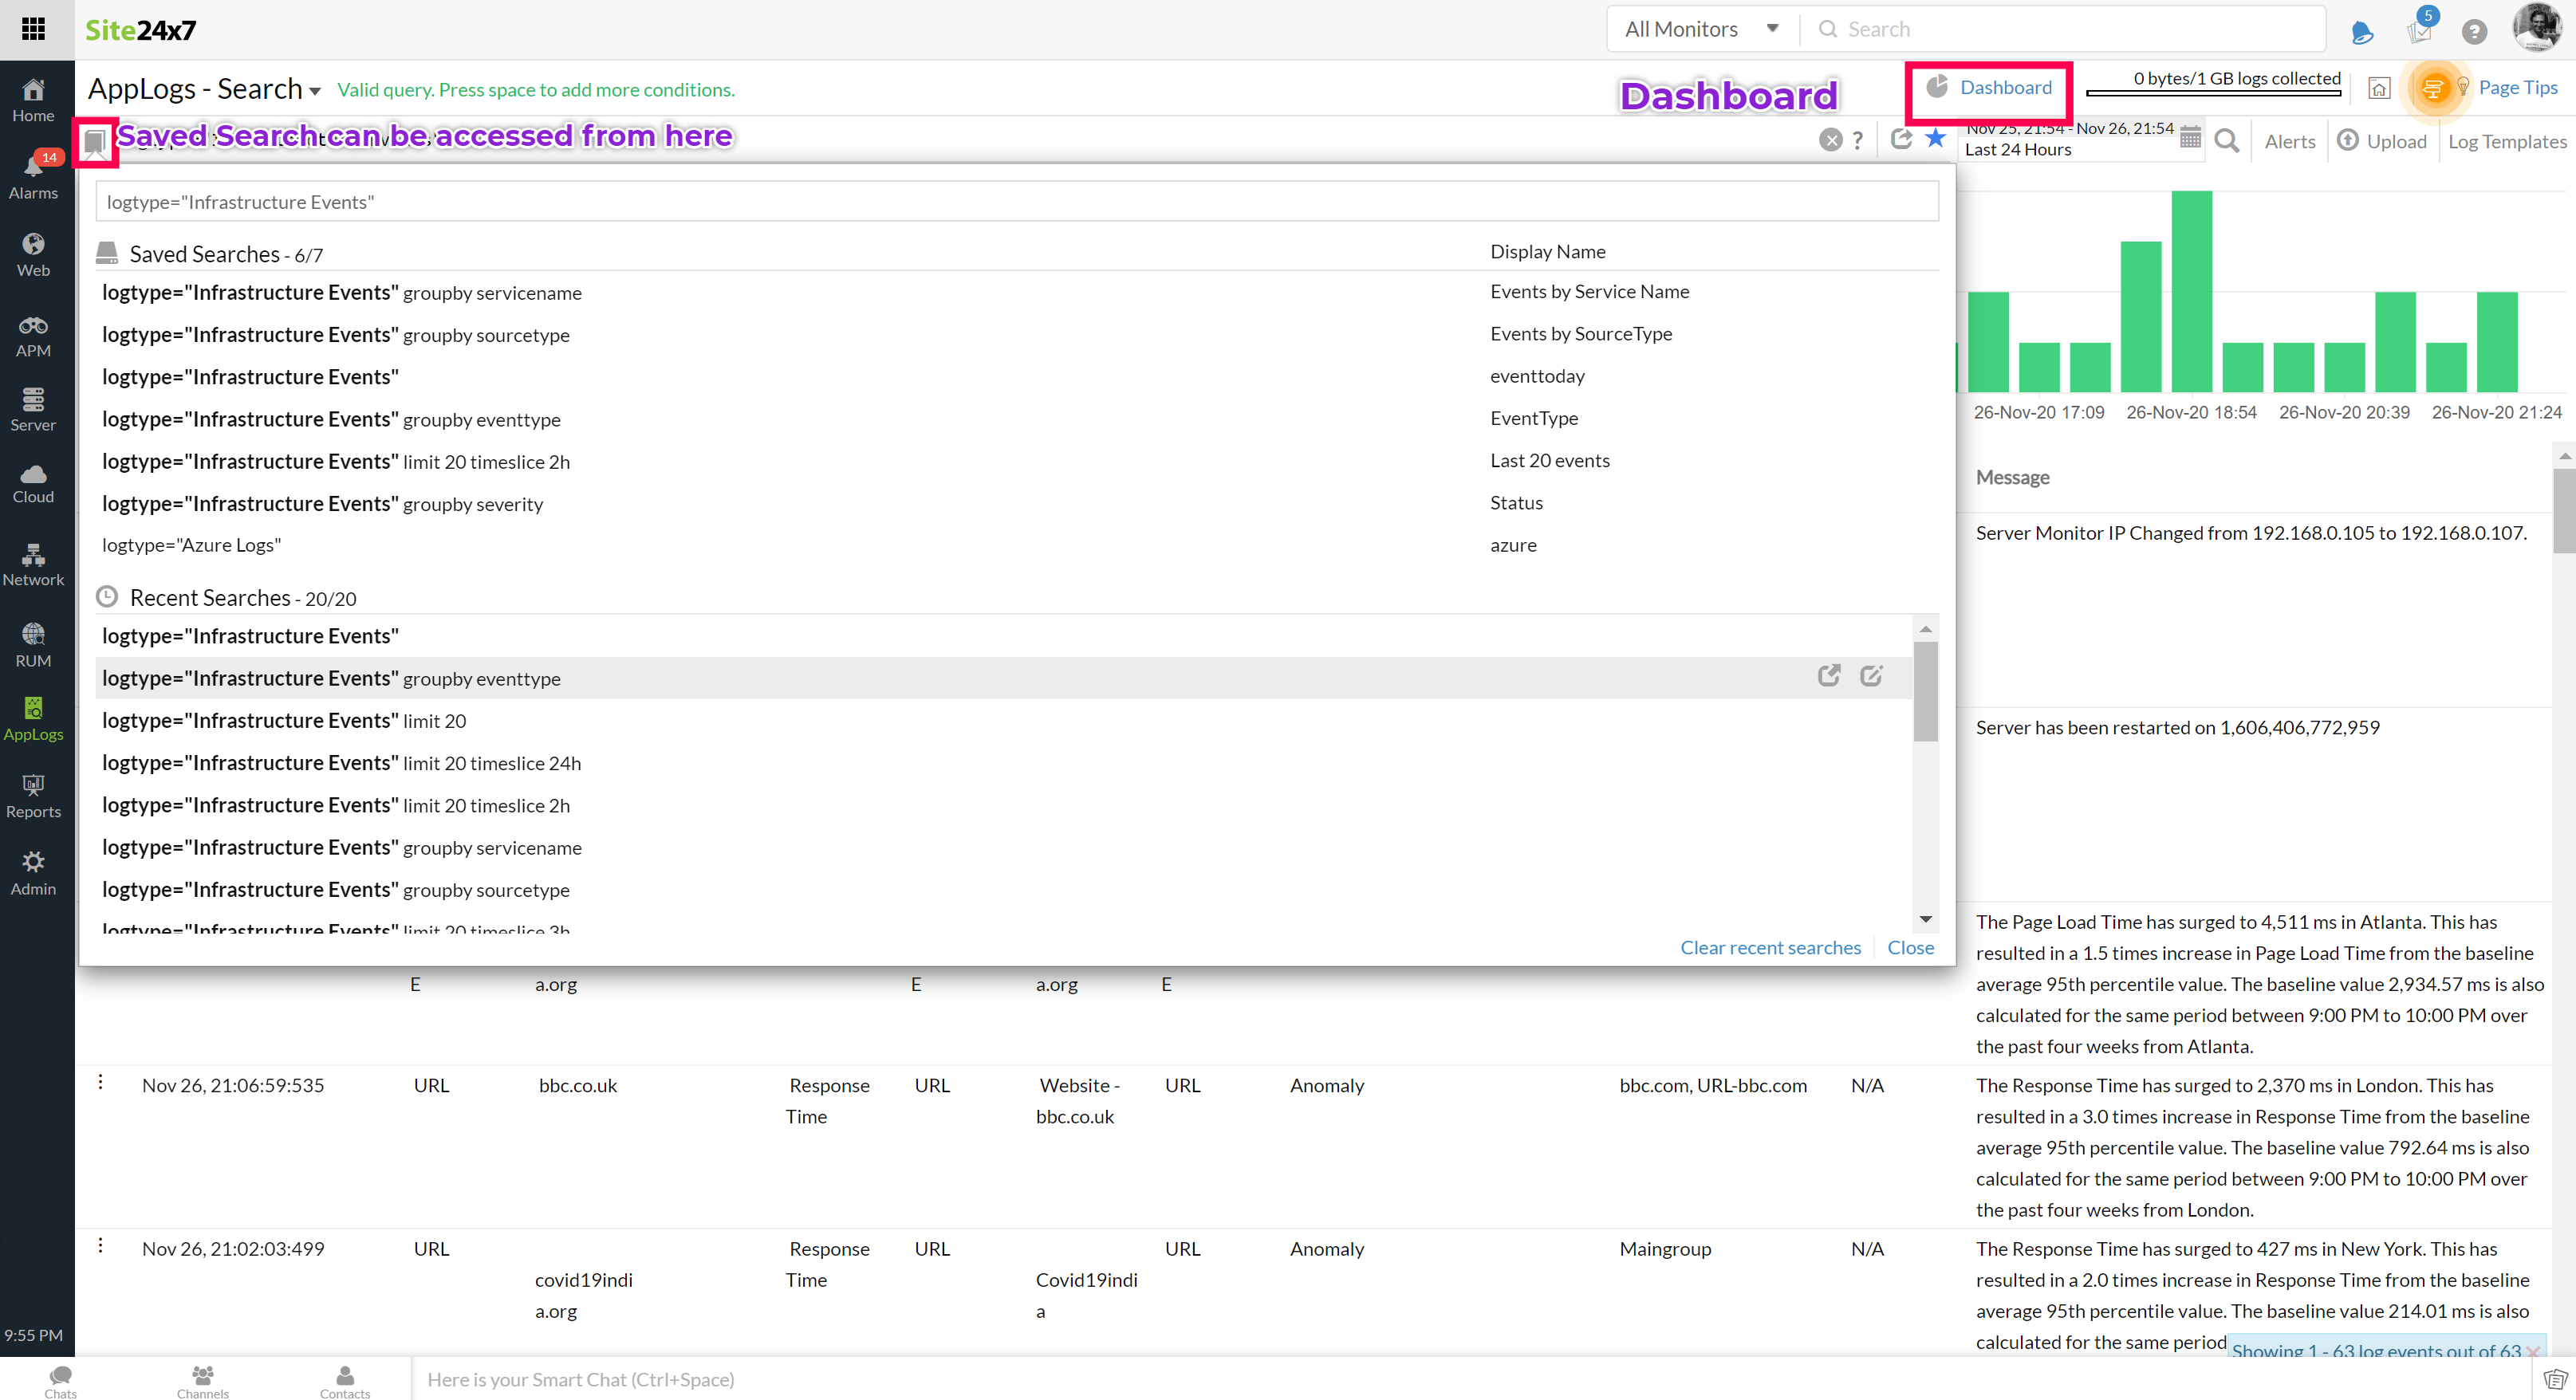
Alerts
Dashboards
However creating of log types and log profile need Admin > Applogs navigation which can make users lost. The thought process for not having the 2nd level tab is that more columns are visible which we thought was better use of real-estate to see the content. I understand it deviates from the rest of the product, we'll look into how best we can show it without disturbing the main content.
>>>2. Currently there is no way we can store applog data for more than 30 days, even if I am willing to pay for additional retention period. For certain types or log profiles, I would like to extend the retention for more than 30 days.
Please contact support@site24x7.com so that we can help you with a longer retention period.
>>>3. I don't see how can I make my default view (in search) as tabular view rather than raw logs. It would be nice to have that option so that user can set their preference. It seems to default to raw log view every time I search.
Currently, we are maintaining the data view settings in a cookie. Hence, the settings will be retained until the cookie is cleared. However, this cookie will be cleared when you log out of your account. We'll store this in db so that it becomes the default view.
>>>4. The log type name allows only small letters and numbers. I find this is very restrictive. Why not allow - or _ and Capital letters? It will make name much more user friendly.
You can provide a custom name as the Display Name for which there are no restrictions.
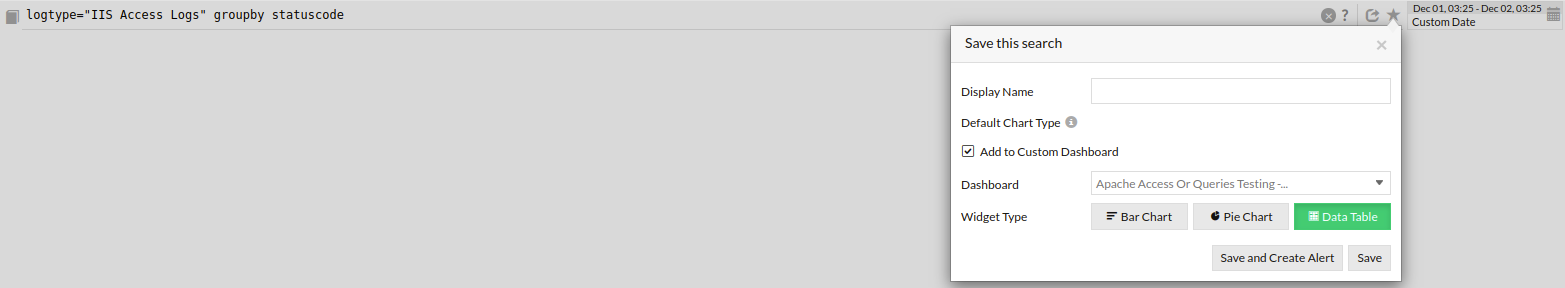
>>>5. When we create a dashboard from applog search, there is no way to customize any further. Allow some flexibility, if possible.
All saved searches are available as part of custom dashboard which is generic to the product. From the saved search you can add that as a widget to a custom dashboard by clicking on the "Add to dashboard" option from which you can select a dashboard to which you want the widget to be added.
The other way is the create a dashboard or add a an applogs widget to an existing dashboard. Navigate to Home > Dashboards > Create new (or Open an existing dashboard > Edit dashboard) > Select Widget type as Applogs widget > Select your logtype and select a saved search. You can add any no.of widgets from different logtypes or add it with other dashboard widgets here so it very flexible this way.
However, I agree the most intutive way would be to bring that right into Applogs dashboard itself. We'll think of how best we can achieve it.
Thanks once again for the valuable feedback and for your kind words on Applogs, its a great motivation for the team.
-Jasper
PM, Site24x7
Thanks Jasper for a prompt response.
What you have mentioned, I know all of these. I do use applog a lot:) Still all of my points are valid.
1. Menu - bring consistency by look, feel, usability in line with other apps (server, network, web etc etc). It helps users to adopt the app much easily and quickly.
2. Lic - should be simple, user pay based on the total volume of log stored in a given month, including any logs those are older than 30 days. Leave the user to manage the retention period. I will contact support, anyway.
3. Preference - Being security conscious, most of the time we use browser in incognito mode. Will cookie help in such situation?
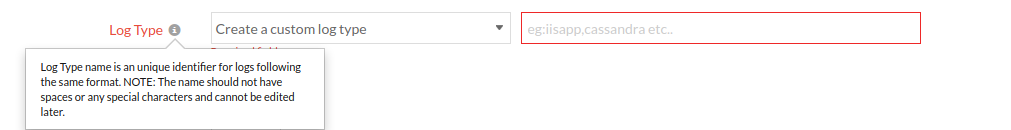
4. I know the Display Name can have flexibility,. What I meant is the name of the log type (screenshot below). Anyway, this is not a problem, flexibility with display name is fine.
5. Re Dashboard, again I know all of these. You know what I am asking for.
Thank you.
Kind Regards,
Ash
One other improvement I would like to see is that when we ingest Windows event logs, applog should automatically parse common fields from the content of the event log. As is today, everything in the body of the Event log shows as $Message$ field. That is way too much information in one field its hard to filter based on any criteria within the message body.
Ideally we would like to see many common fields be automatically extracted such as Account Name, Workstation Name, Source Network Address etc etc so that it becomes easily searchable for the specific event(s) someone is looking for.
Thanks,
Ash
Dear Ash,
Thank you for your valuable feedback on Windows event logs message parsing. We have added this to our road-map and will update here once the feature is live.
Regards,
Magesh Rajan
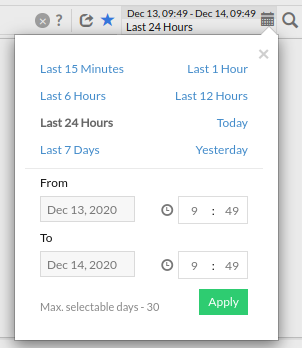
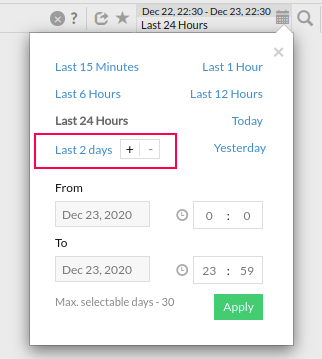
Another simple one. It would be nice to have a time selection choice of past x days. When we come to office on Monday, the first thing people want is to look is what happened over the weekend. I have to select From: and To: option to do so. If there was an option of past X days, that would be much easier.
Thanks Ash.
Dear Ash,
Thanks for your continued feedback. We worked on fixing the usability issue you faced based on your suggestion. We have implemented support for the Last x days in AppLogs Search with +/- days
Regards,
Magesh Rajan
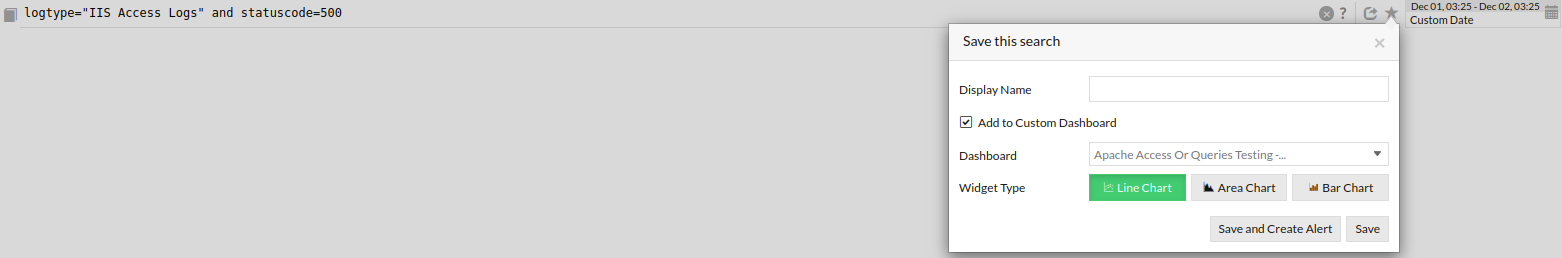
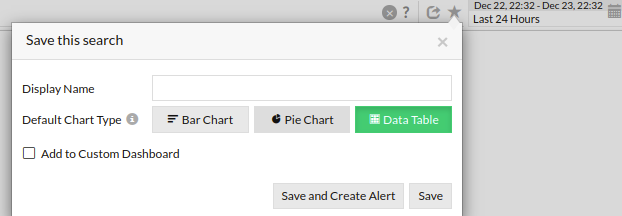
Currently when I save a search in the applog dashboard, the only option is either a Bar or Pie chart. In some situations other views may be more appropriate to a customer. It would be nice to have more options, such as "Table" or "Line Chart" etc in the "default Chart Type" .
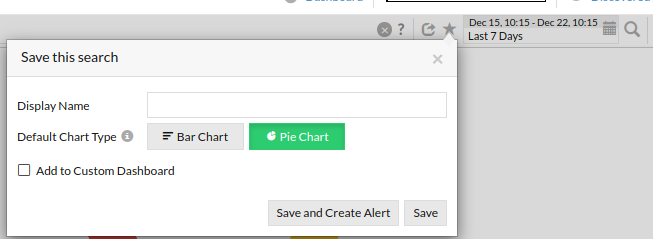
Thanks,
Ash
Dear Ash,
Default chart types will be shown based on the type of query. You will get "Line", "Area" and "Vertical Bar" charts for count-based queries whereas "Horizontal Bar", "Pie" and "Data Table" for groupby queries.
Count Query
Groupby Query
Regards,
Magesh Rajan
Dear Ash,
We have included the "Data Table" option for groupby queries so that you can use this view in your AppLogs dashboard.
Regards,
Magesh Rajan
Some more limitations to overcome by applog product or perhaps my lack of knowledge:
1. When I add a line or bar graph to applog dashboard, I can't see the legend. But the legend is shown for Pie charts. I can only see the legends for a bar/line graph when I hover my mouse over to graph. This is not ideal. We display dashboards in display screens, which is not controlled by anyone. Thus, it will be helpful if there is a legend for bar/line graphs as well.
2. When a dashlet is added to applog dashboard, its automatically positioned (I think based on the sequence of when a dashlet is added to a dashboard). The first one added comes on top, then the next one and so on. Currently I cannot reposition or resize them. This is not necessarily the best view I would like to have for that dashboard. Allow customers to reposition/resize the dashlets in the applog dashboard. I know, I can create a custom dashboard and and then add all the required dashlets there, but its double the job for me!
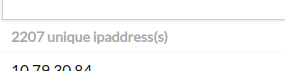
3. When I use the keyword DISTINCT in my search (unfortunately COUNT_DISTINCT does not show up as an option for the log type), the table view displays the total number of entries, which I am interested in. How can I display that number in my dahslet rather than the table view? In the example below, I am interested in the number 2207 rather than the whole table as shown in the screenshot.
logtype="DHCP Server Log" distinct(ipaddress)
4. Currently after a search command is issued, the option to further filter that search using pipe (|) is very limited i.e. before, include and exclude. Why not allow to run another search command after the pipe? That will allow to run more complex search queries.
5. Currently, I can only collect Windows event logs (i.e. Application, System and Security). I am not sure how can I collect other Windows application logs e.g. DNS, DFS logs etc. Most of the Windows application logs are not stored in the text format, rather its stored in a file with .evtx extension.
%SystemRoot%\System32\Winevt\Logs\xxx.evtx
6. How can I find the list of servers for which applog is currently enabled and which log profiles applied against those servers? We recently had an incident where two critical server logs were not collected, even though applog profile associated with a monitoring group and those server were part of the monitoring group. It will be good to have a reporting capability for cross checking.
7. Make search commands smaller. For example to filter logs that contains some words, I have to repeat "and message CONTAINS" for every word! It could be much simpler, if allow multiple and/or commands within a CONTAINS keyword.
logtype="Syslog" and message CONTAINS "guardiandataaccess" and message CONTAINS "up" and message CONTAINS "Down"
It could simply be like below:
logtype="Syslog" and message CONTAINS ("guardiandataaccess" and "Up" and "Down")
8. For custom dashboards, we can share the dashboard https links with some IP restrictions, which is not possible for apploag dashboards. its an useful feature (specifically sharing the dashboards with our management team), pl do allow the same for applog dashboards.
Kind Regards,
Ash
Dear Ash,
Thank you for your constant feedback that helps to fine tune our product. Below i have mentioned the status of all your feedback.
- We have added the legend for different charts (multi-line, multi-area and multi-bar charts).
- Added to the Roadmap
- Fixed the issue. Now, you will get the COUNT_DISTINCT option in the query.
- Added to the Roadmap
- To collect Applications and Services Logs from Windows event logs, check this KB
- We have planned to provide this details in the Export Monitor option. We will update here once it's available.
- Added to the Roadmap
- Added to the Roadmap
Regards,
Magesh Rajan
Thank you Magesh.
The KB article mentioned by you in point 5 above is incomplete and dose not make complete sense to me, and need more information. As per the KB article it says I have to add the registry key "Microsoft-Windows-PrintService/Admin" to collect application and services log. That cannot be true for any application and services logs. I assume that article relates only to collect print server log.
It is also not clear from the KB article once a reg key has been added, how do I collect those logs in applog for that particular application/service.
Pl update the KB article to be more explicit. My aim is to collect other applications logs e.g. DFS, DNS etc.
Kind Regards,
Ash
Dear Ash,
Thank you for your feedback on KB article. We have updated the KB article with the proper steps.
Regards,
Magesh Rajan
Thank you Magesh.
I have another challenge. I hope you can help us.
We would like to consume logs from another SaaS product into applog. The payload is in JSON format (either JSON array, JSON lines or JSON Object) and the SaaS provider supports common platforms such as AWS EventBrige, Splunk or Azure EventGrid, SumoLogic etc. They also support upload logs via API/webhook. Pl see below screenshot. I had a look at the log collection to applog via API, but that does not help.
www.site24x7.com/help/log-management/sending-logs-https.html
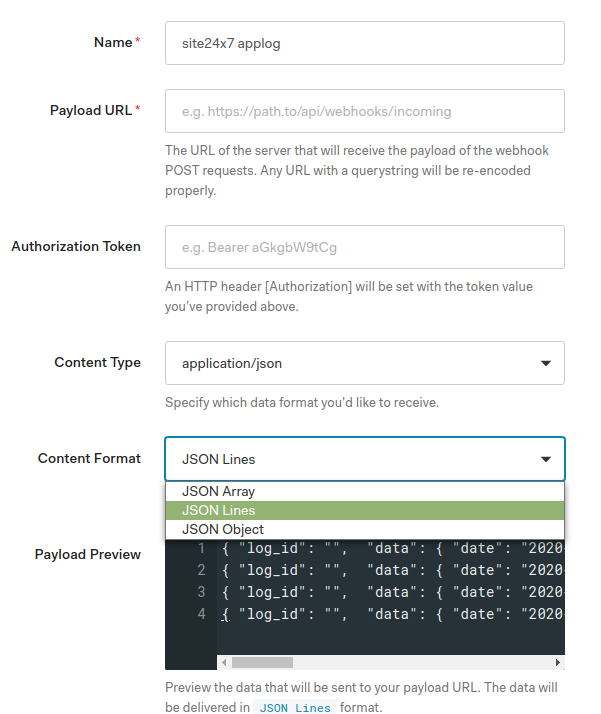
Sample payload for JSON Lines.
{ "log_id": "", "data": { "date": "2020-01-29T17:26:50.193Z", "type": "sapi", "description": "Create a log stream", "client_id": "", "client_name": "", "ip": "", "user_agent": "", "user_id": "", "log_id": "" }}
{ "log_id": "", "data": { "date": "2020-01-29T17:26:50.193Z", "type": "sapi", "description": "Create a log stream", "client_id": "", "client_name": "", "ip": "", "user_agent": "", "user_id": "", "log_id": "" }}
{ "log_id": "", "data": { "date": "2020-01-29T17:26:50.193Z", "type": "sapi", "description": "Create a log stream", "client_id": "", "client_name": "", "ip": "", "user_agent": "", "user_id": "", "log_id": "" }}
{ "log_id": "", "data": { "date": "2020-01-29T17:26:50.193Z", "type": "sapi", "description": "Create a log stream", "client_id": "", "client_name": "", "ip": "", "user_agent": "", "user_id": "", "log_id": "" }}
More details here
auth0.com/docs/logs/streams/stream-http-event-logs
Kind Regards,
Ash
Dear Ash,
Please create the new log type using the below sample logs and log pattern, and also enable the "API Upload" option in the log type.
Sample Logs
{ "log_id": "", "data": { "date": "2020-01-29T17:26:50.193Z", "type": "sapi", "description": "Create a log stream", "client_id": "", "client_name": "", "ip": "", "user_agent": "", "user_id": "", "log_id": "" }}
{ "log_id": "", "data": { "date": "2020-01-29T17:26:50.193Z", "type": "sapi", "description": "Create a log stream", "client_id": "", "client_name": "", "ip": "", "user_agent": "", "user_id": "", "log_id": "" }}
{ "log_id": "", "data": { "date": "2020-01-29T17:26:50.193Z", "type": "sapi", "description": "Create a log stream", "client_id": "", "client_name": "", "ip": "", "user_agent": "", "user_id": "", "log_id": "" }}
{ "log_id": "", "data": { "date": "2020-01-29T17:26:50.193Z", "type": "sapi", "description": "Create a log stream", "client_id": "", "client_name": "", "ip": "", "user_agent": "", "user_id": "", "log_id": "" }}
Log Pattern
json $log_id$ $data.date as date:date:yyyy-MM-dd'T'HH:mm:ss.SSS'Z'$ $data.log_id as data_log_id$ $data.user_id as data_user_id$ $data.ip as ip$ $data.description as description$ $data.type as type$ $data.client_name as client_name$ $data.client_id as client_id$ $data.user_agent as user_agent$.
Then select the "Content Format" as "JSON Lines" in your SAS product and use the below for the Payload URL.
https://logc.site24x7.com/event/receiver?token=<Token>&rawLogs=true
Token - You can find the token value below the "API Upload" option in the Edit Log Type page.
Regards,
Magesh Rajan
Dear Ash,
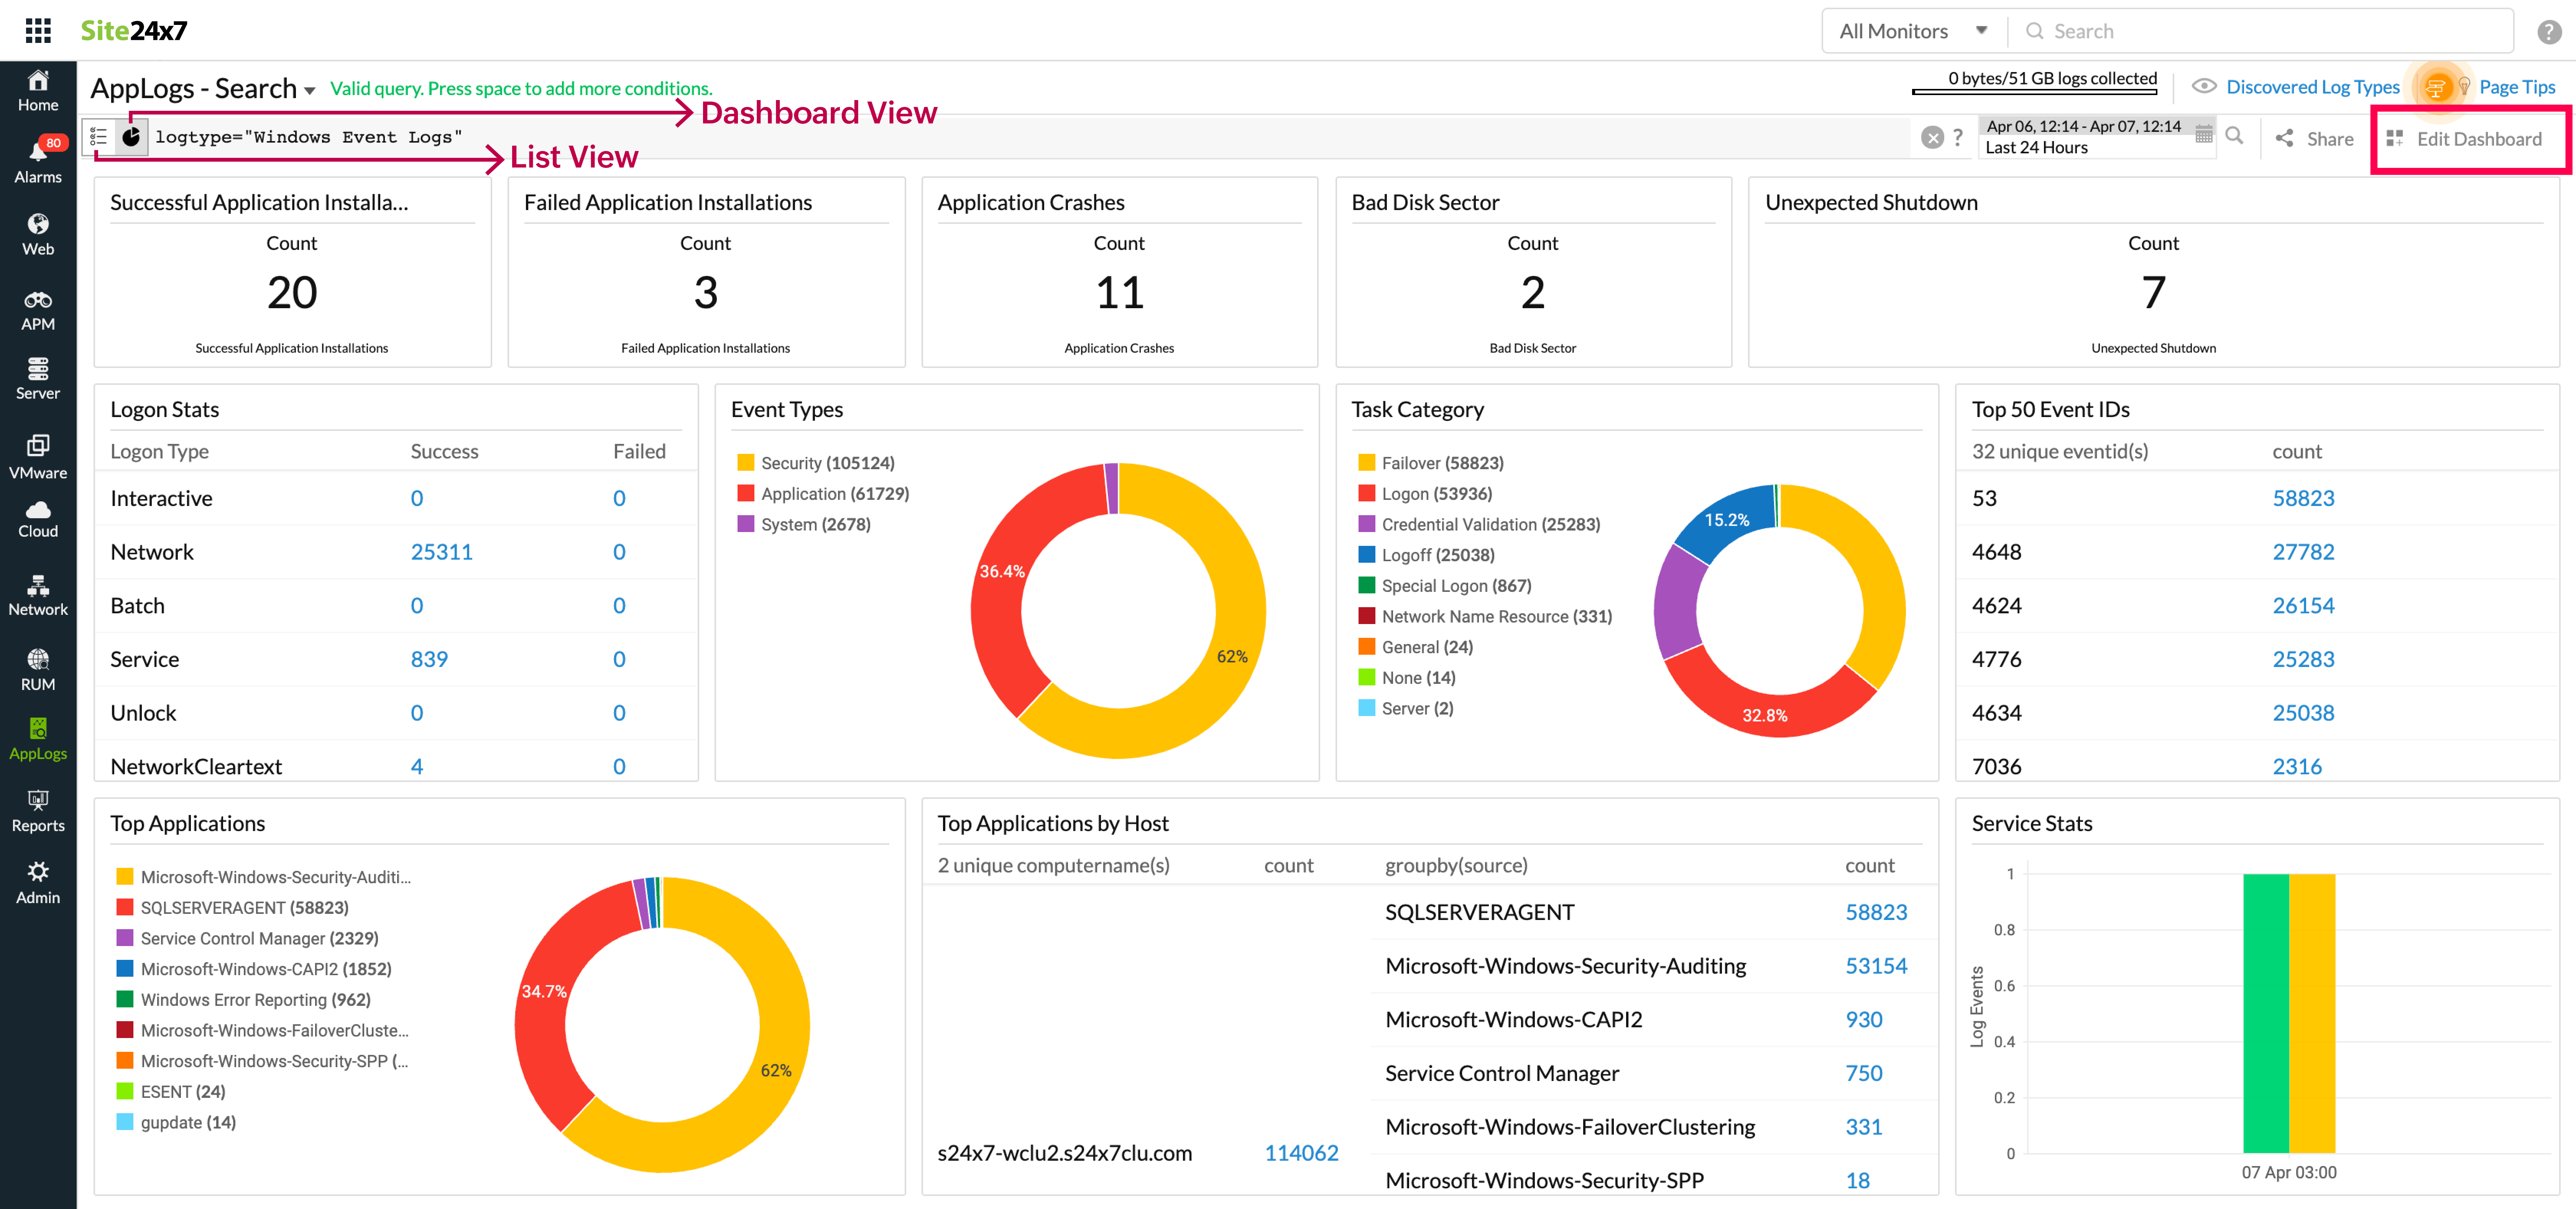
>>>2. When a dashlet is added to applog dashboard, its automatically positioned (I think based on the sequence of when a dashlet is added to a dashboard). The first one added comes on top, then the next one and so on. Currently I cannot reposition or resize them. This is not necessarily the best view I would like to have for that dashboard. Allow customers to reposition/resize the dashlets in the applog dashboard. I know, I can create a custom dashboard and and then add all the required dashlets there, but its double the job for me!
We have now integrated the AppLogs dashboard with the custom dashboard framework. Now, you can re-arrange the widgets based on your need. To do this, click on 'Edit Dashboard' to re-arrange the widgets as in the below screenshot.
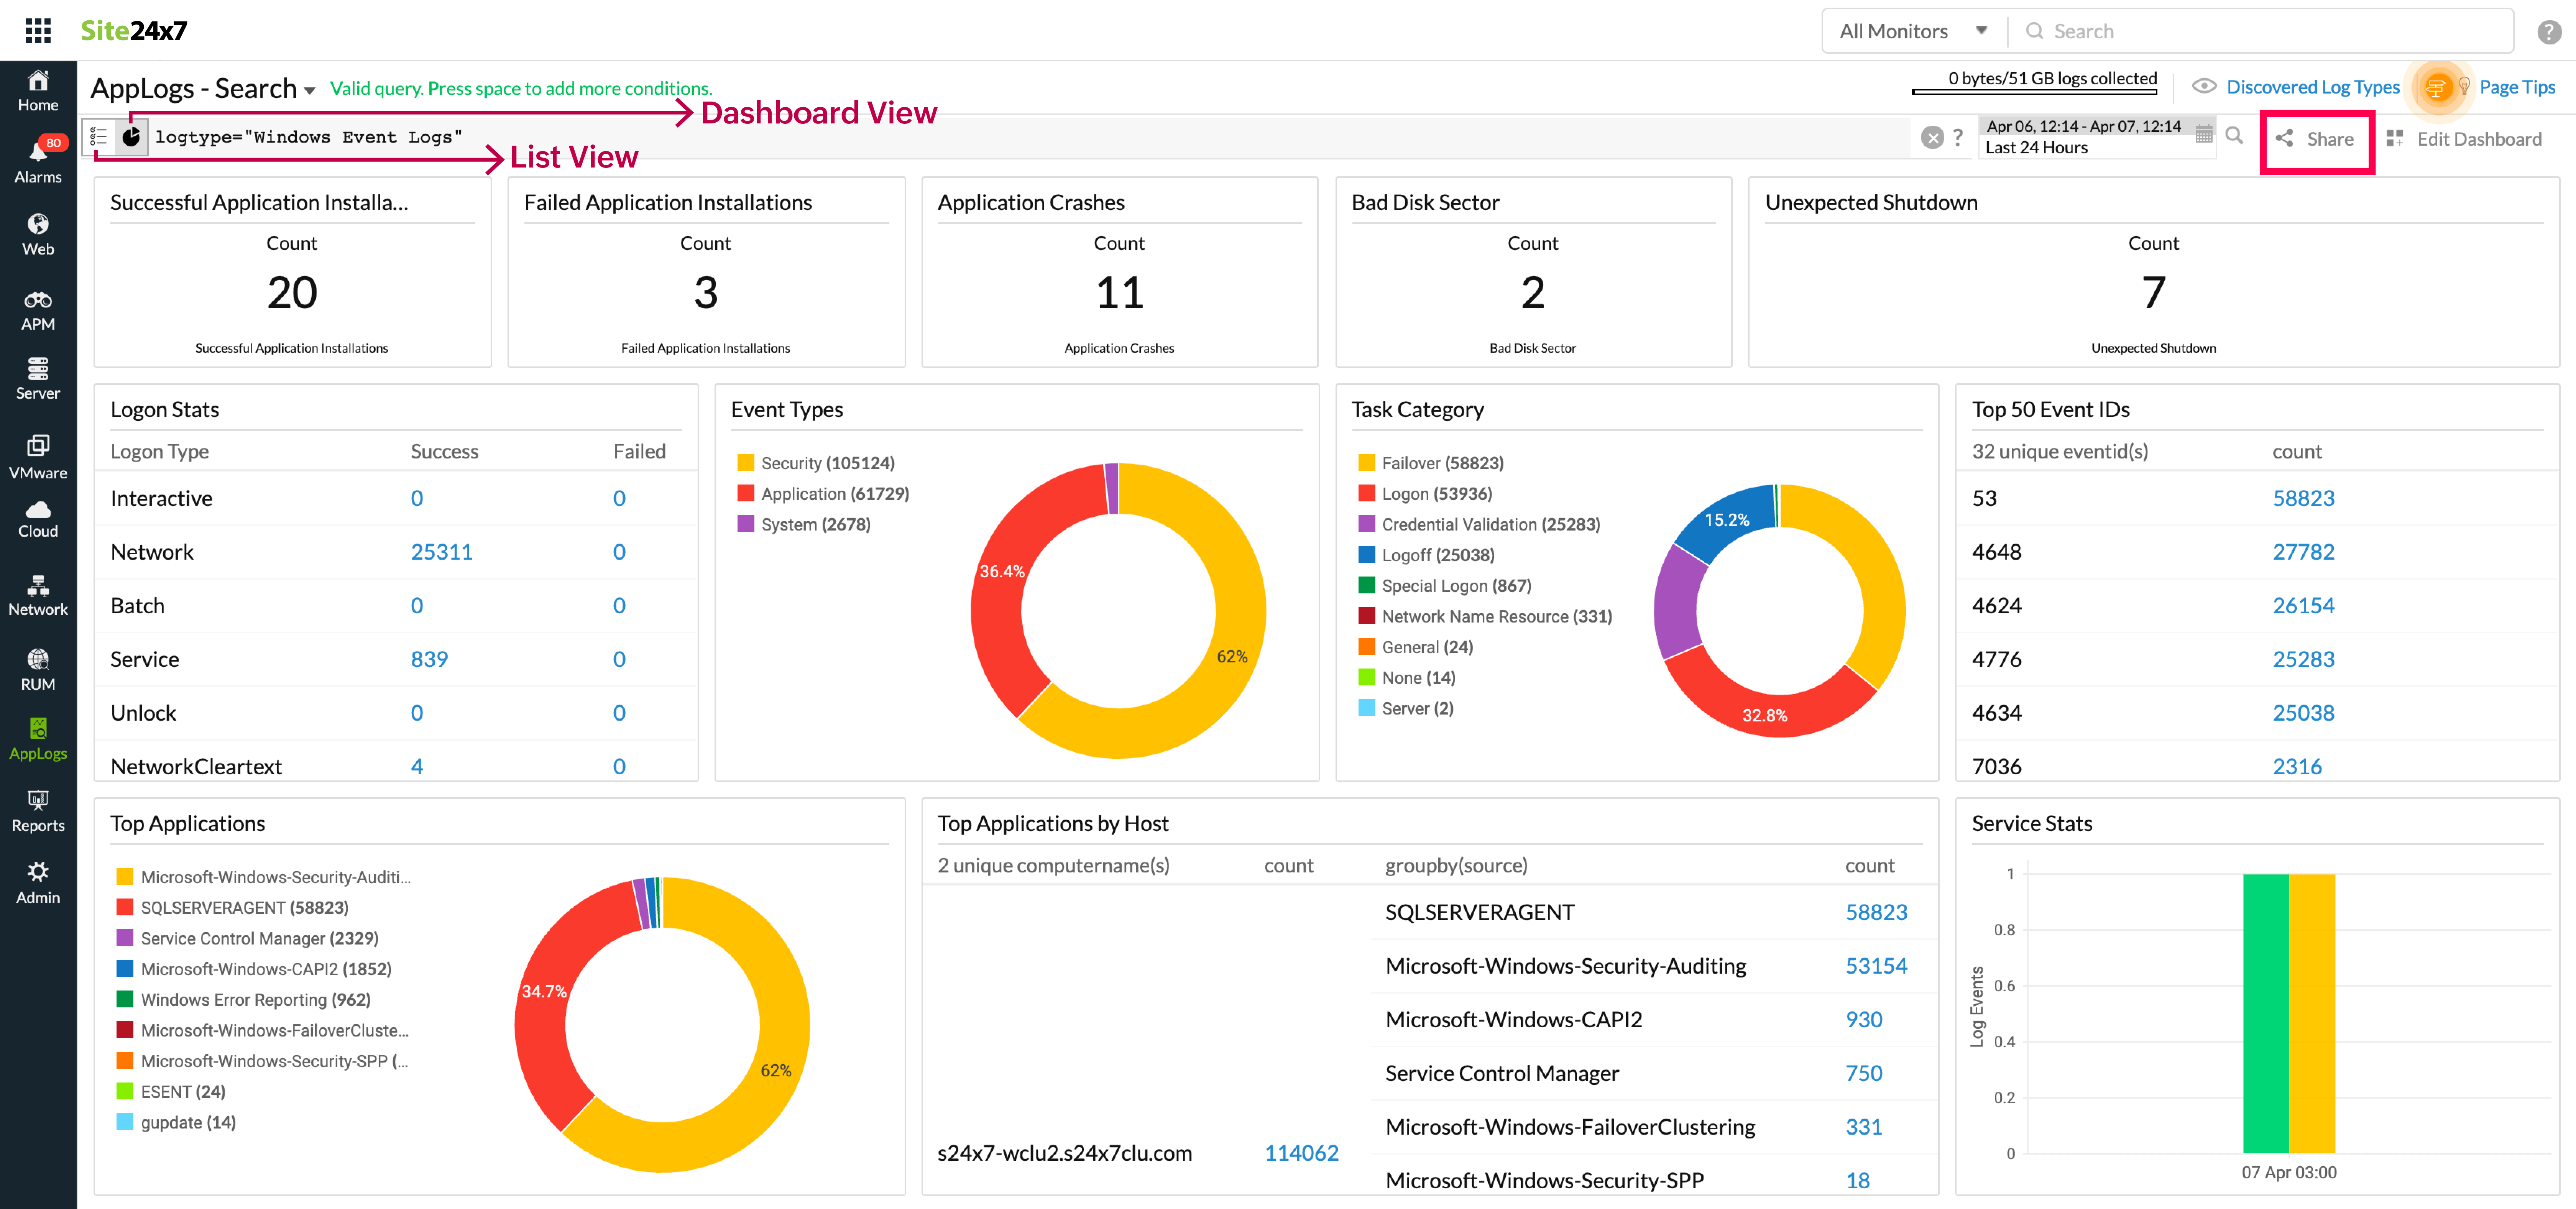
>>>8. For custom dashboards, we can share the dashboard https links with some IP restrictions, which is not possible for apploag dashboards. its an useful feature (specifically sharing the dashboards with our management team), pl do allow the same for applog dashboards
You can share the dashboard with IP restrictions by clicking the 'Share' icon as shown in the below screenshot.
Regards,
Magesh Rajan
Not sure if its my ignorance or this feature is not available in applog.
When I look at the usage summary, occasionally I do see a spike in usage (one shown below). However, I do not see any option to drill down to specific log type and to the node/monitor which was the reason for that spike. It will be nice to have that feature. I know there is a usage graph by log type in the usage summary dashboard (immediately below this graph), but I am asking for a drill down i.e. when I click on the high usage dot point, it should take me to further details usage for that particular dot point i.e. usage for that day.
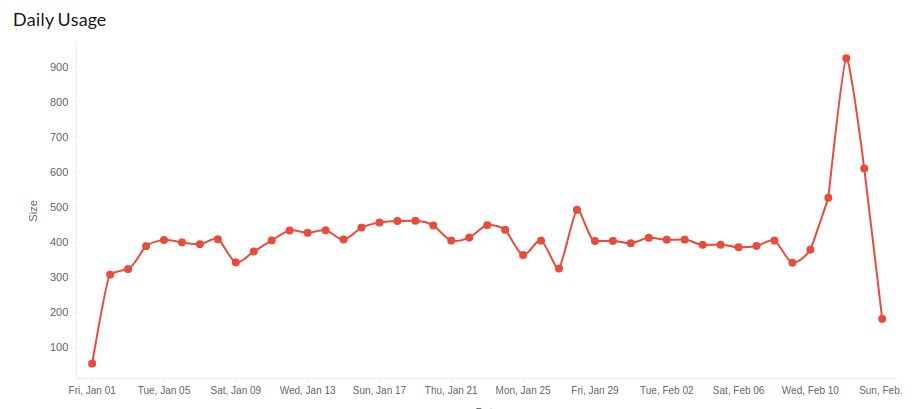
There is no option to select a specific date range either in the usage summary dashboard - its always the current billing cycle.
Plus, it will be nice to have an option for me to trigger an alert based on certain daily usage threshold - total usage as well as per log type usage.
Kind Regards,
Ash
Dear Ash,
Thank you for raising the feature request on daily logs usage. Currently we are not storing the daily usage in log type level. We have added this to our road-map and will update here once the feature is live.
Regards,
Magesh Rajan
Currently the applog dashboard, when published, there is no way to vary any of the parameters. They are basically fixed/static (based on whatever the search string was). For example I would like to share a dashboard with my Servicedesk and L1 support staff, who would be able to provide provide an input (a value against a parameter) and the dashboard should reflect based on the input provided by the staff.
specific use cases:
1. servicedesk staff inputs a loginid for a user and checks if the user account is locked or not. If locked, shows the relevant events as well as machines/IP from where it was locked in the dashboard.
2. servicedesk staff inputs the id of a radio and finds the status in the dashboard, recent history
There are many more use cases.
What I am asking is to allow to pass one or more variables into the dashboard, so that user can input the value of such variables.
Kind Regards,
Ash
Dear Ash,
Currently, we are working on the custom dashboard integration for AppLogs. We will also provide the query language option in the dashboard view so that you can add any criteria in the query and it'll apply to all widgets in the dashboard. Besides, the dashboard view URL is shareable that you can share with your ServiceDesk staff. We will update here once the feature is live.
Regards,
Magesh Rajan
Is it possible to blacklist one or more Event IDs. I know I can whitelist (i.e. collect logs with specific Event IDs), but aim here is to collect all errors/warnings expect a few event IDs, that we know is generating millions of events, but of no use.
Apparently it exhausted my Applog Lic over the weekend! I am trying to filter wherever I can. It would also be helpful if there were a mechanism to limit the log size for individual monitors (for example, limit the size to 5 GB for each monitor in the monitoring group I applied the profile as shown in the screenshot below). That would have helped me too.

Kind Regards,
Ash
Dear Ash,
Please refer to this KB article to filter Windows event logs with unwanted event IDs in the agent side itself. Also, for your use case, you can configure filters for both the EventId (Doesn't Match unwanted event ID) and the Level (Matches Error,Warning) fields.
Regards,
Magesh Rajan
Dear Ash,
We have released the custom dashboard integration with AppLogs. With this, you will now be able to apply conditions across all widgets using query language. Please refer to the help doc for more details.
https://www.site24x7.com/help/log-management/index.html#dashboard
Regards,
Magesh Rajan