by Deva Priya
Greetings!
IBM i environments power critical business applications, and it is essential to keep track of system health, jobs, storage, queues, and other components can require monitoring several areas individually. When an issue occurs, identifying what is affecting the system can become time-consuming.
To simplify this, we’re introducing IBM i monitoring in Site24x7, providing a unified view of your IBM i server’s performance and operational health.
With this monitor, you can track system-wide health metrics, jobs, memory pools, disk and Auxiliary Storage Pool (ASP) utilization, subsystems, message queues, data queues, job queues, output queues, printers, spool files, and system problems—all from a single monitoring interface.
What you can monitor
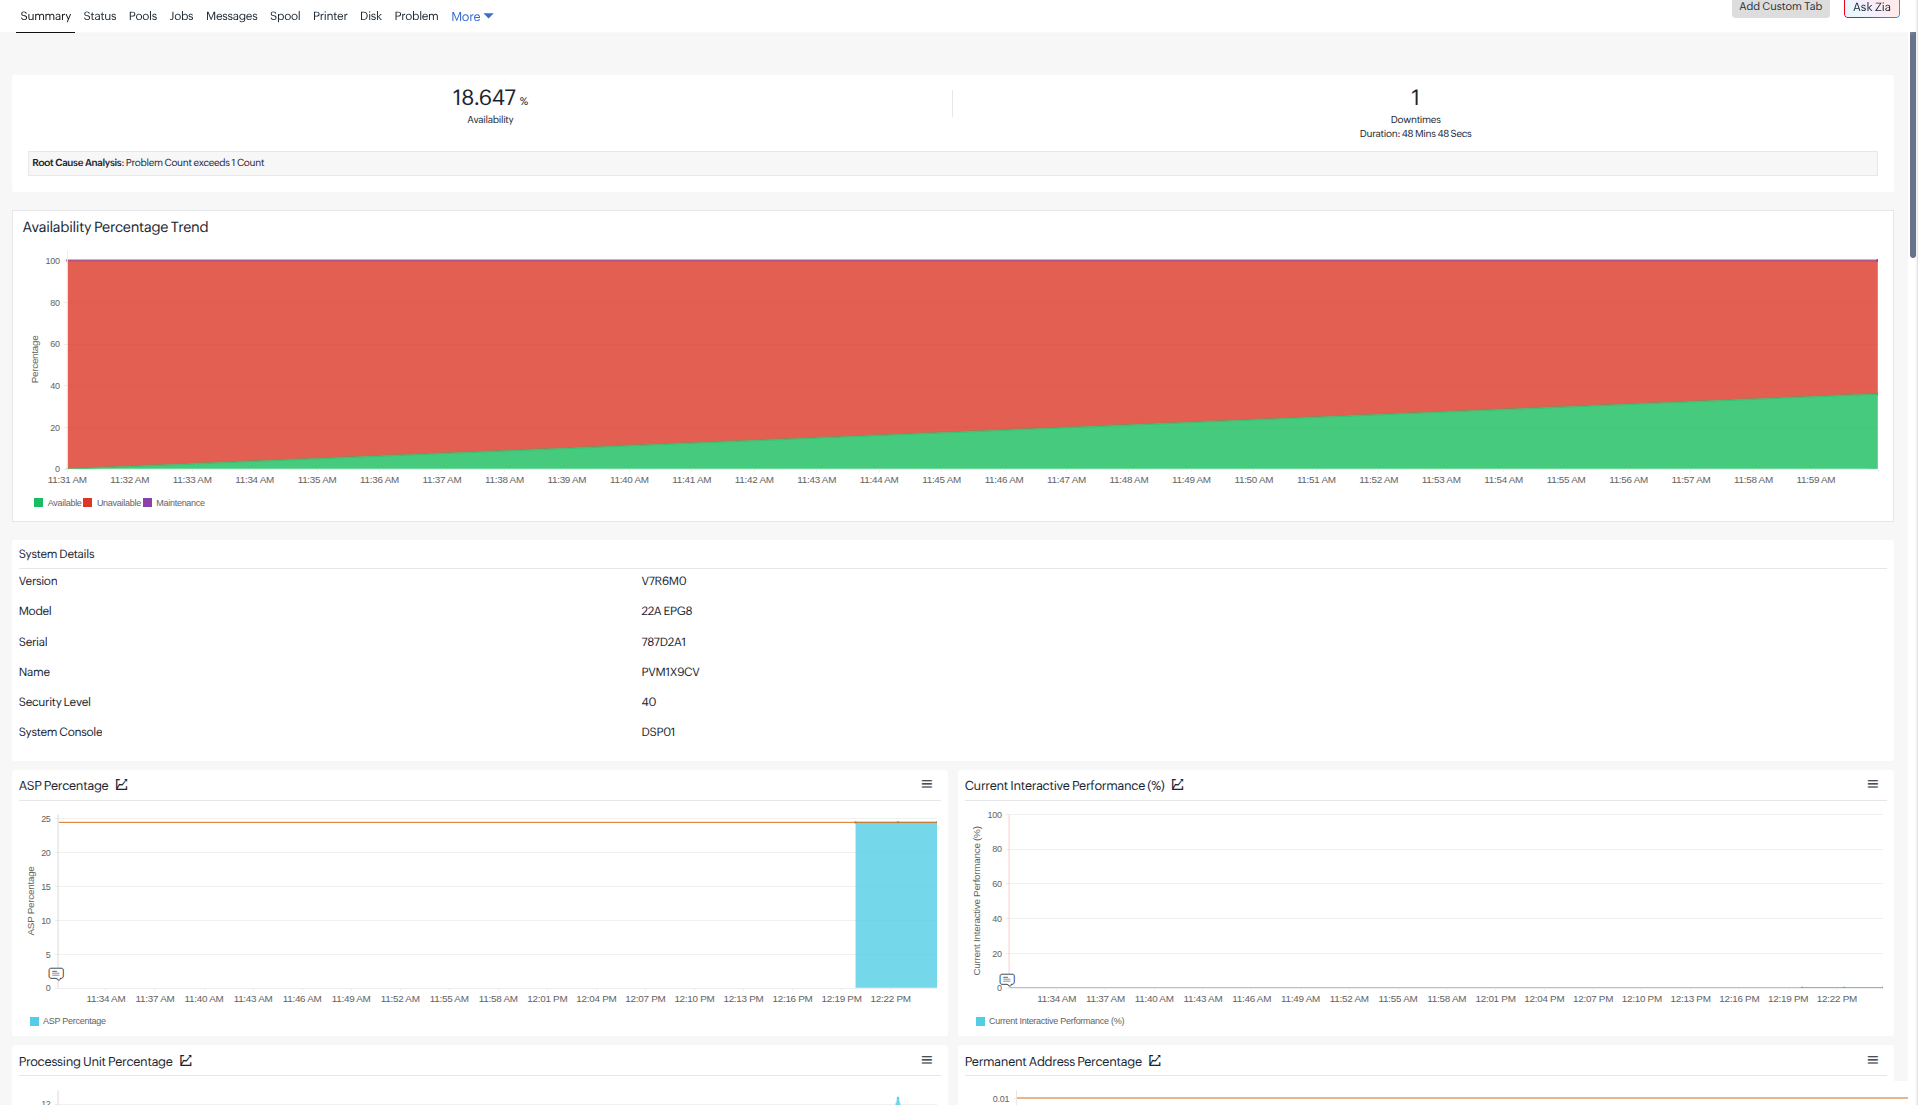
- Track system performance: Monitor processing unit utilization, ASP and database storage usage, memory pools, processing capacity, jobs, users, and other key system metrics.
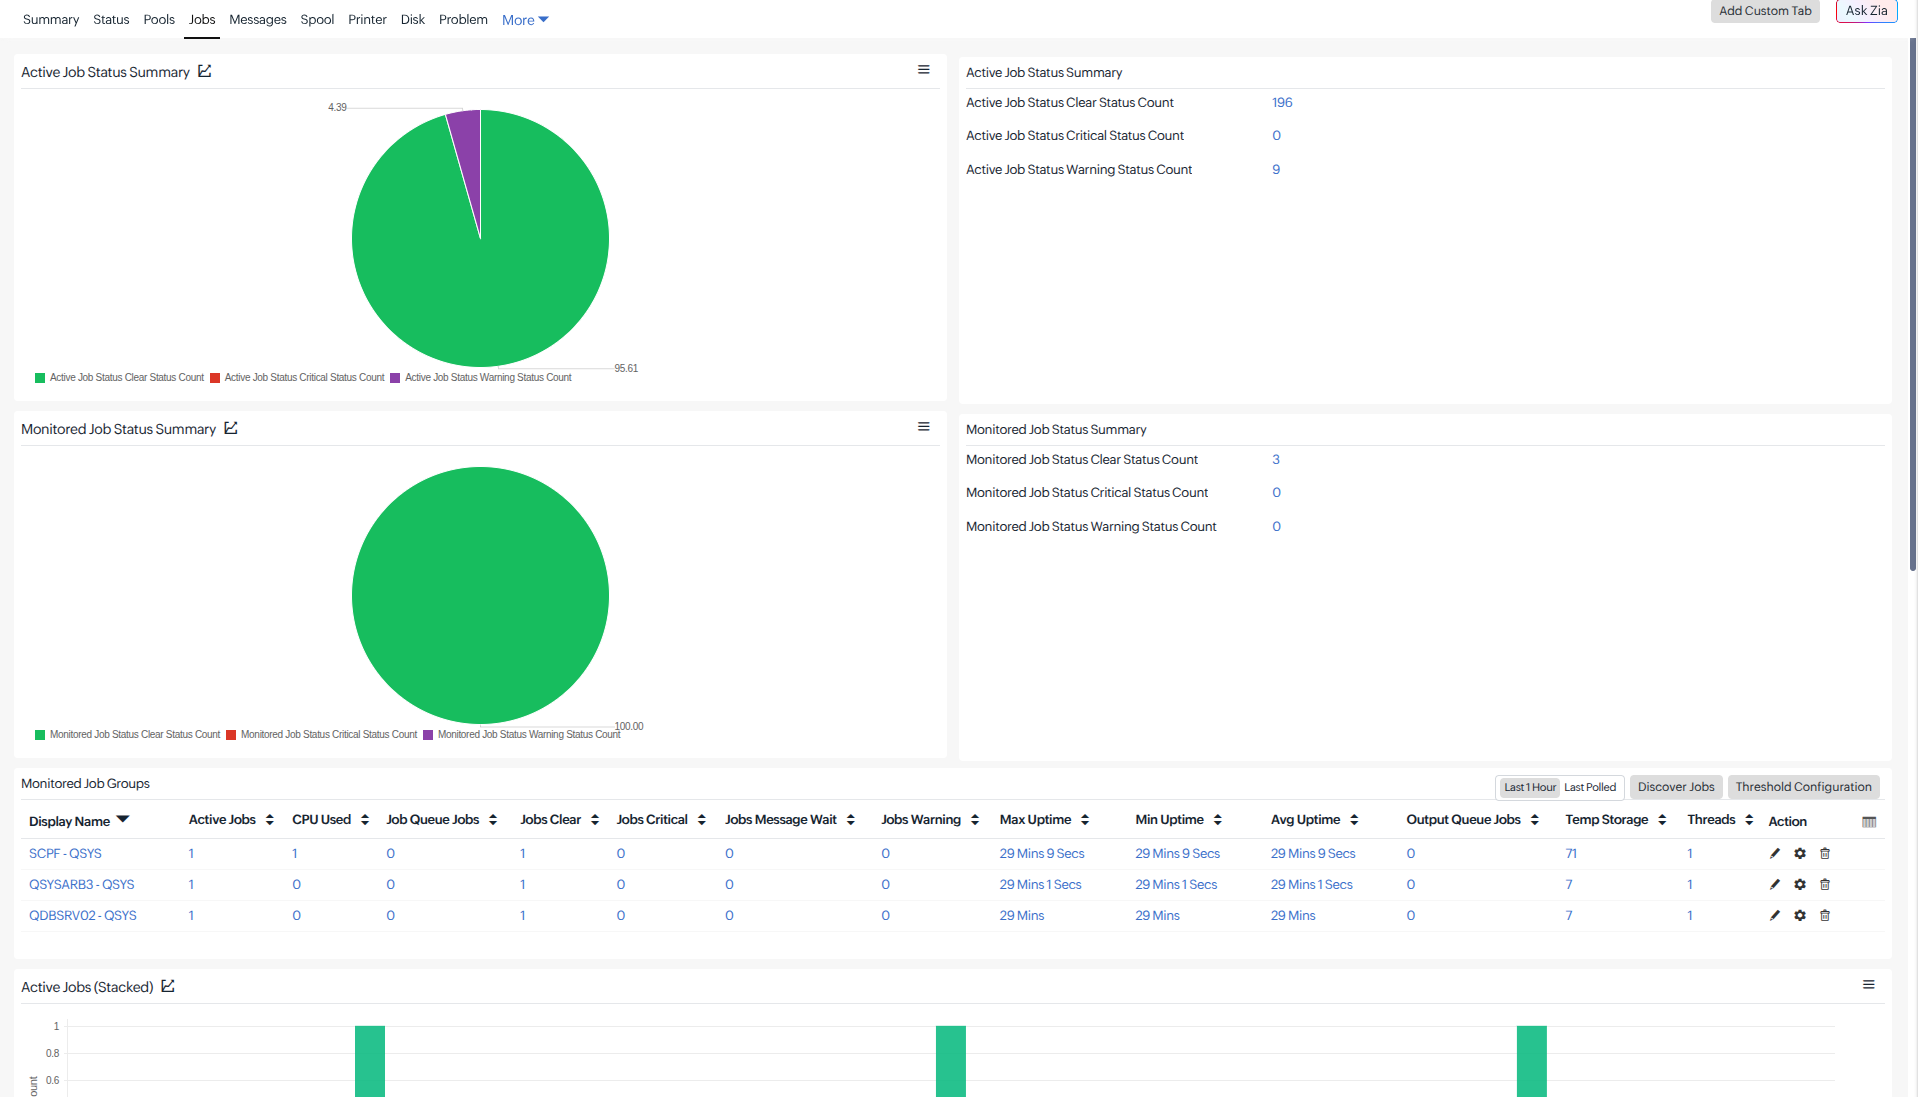
- Monitor jobs and subsystems: Get visibility into active jobs, batch jobs, jobs waiting for messages, CPU usage, threads, job queues, and subsystem activity to identify workload-related issues.
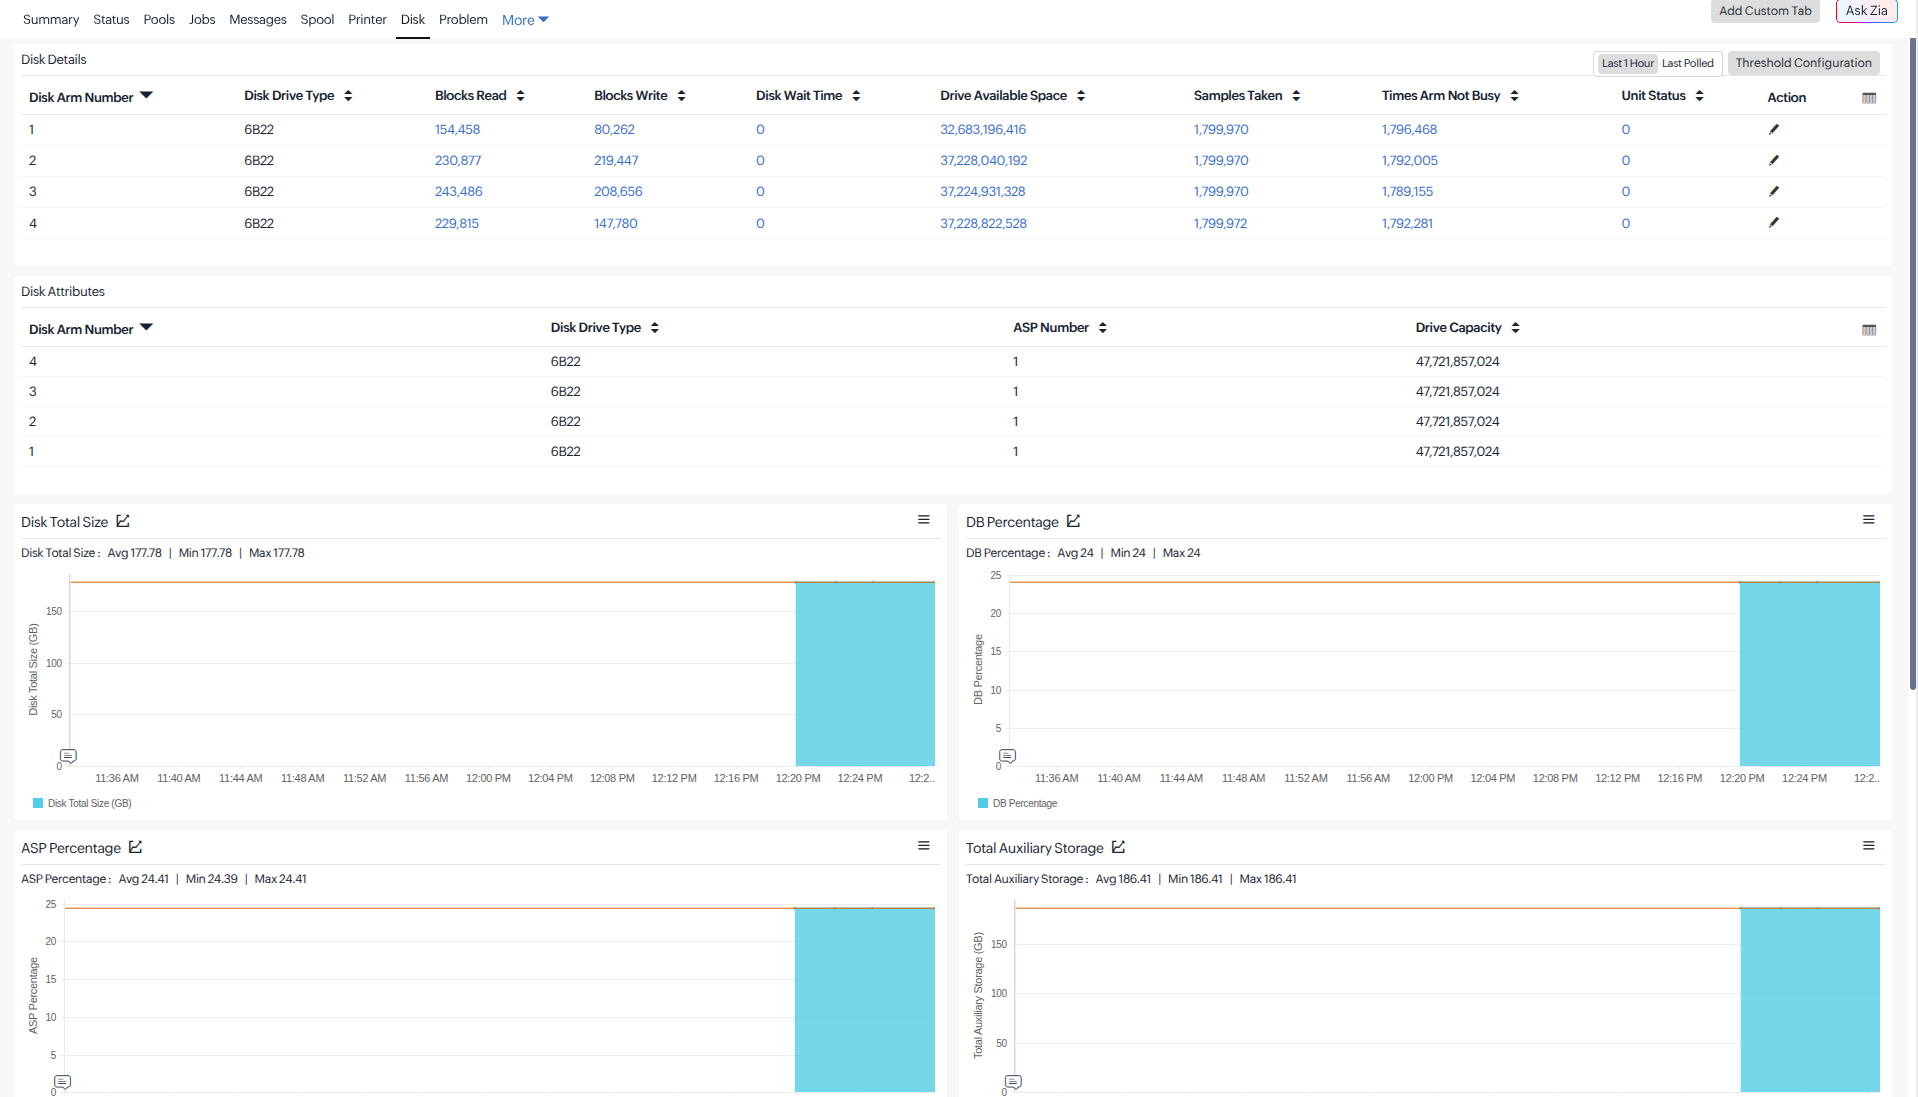
- Keep an eye on storage and disks: Monitor disk activity, available space, disk wait time, drive capacity, ASP usage, and database storage utilization to spot potential storage bottlenecks.
- Stay informed about system messages and problems: Track messages from the configured message queue and view open hardware and software problems, along with their status and life cycle details.
- Monitor queues, spool files, and printers: Track data queues, job queues, output queues, spooled files, printer status, and print activity to identify interruptions in workload or output processing.
Use case: Troubleshooting slow-running batch jobs in IBM i
Challenge
In an IBM i environment, batch jobs may start taking longer than usual to complete. Identifying the root cause can be challenging, as administrators may need to investigate multiple areas, including jobs, CPU utilization, subsystems, memory pools, queues, and storage activity. Checking each component individually can increase troubleshooting time and delay issue resolution.
Solution
With Site24x7 IBM i monitoring, administrators can gain centralized visibility into critical IBM i performance metrics, including:
- Active and waiting jobs
- CPU utilization
- Subsystem activity
- Memory pool utilization
- Queue status
- Storage and system activity
This consolidated view helps administrators quickly identify whether the slowdown is caused by a specific job, an overloaded subsystem, memory constraints, queue congestion, or underlying system resource issues.
Outcome
By providing visibility into critical IBM i components from a single platform, Site24x7 helps teams identify performance bottlenecks faster, reduce troubleshooting time, detect potential issues before they impact business operations, improve system availability and reliability, and maintain optimal IBM i performance.
With proactive monitoring and centralized visibility, teams can focus on resolving the actual root cause rather than spending time manually investigating multiple system components.
Get started
Head to Apps > Enterprise Applications > IBM i in your Site24x7 console to add your IBM i monitor. An On-Premise Poller with network connectivity to the IBM i server is required.
For more details, please refer to our IBM i monitoring help documentation.
Keep your IBM i environment healthy, visible, and ready for business-critical workloads.
Have questions or suggestions? Join the conversation in the comments. Happy monitoring!
Your partners in monitoring,
The Site24x7 team
Like (1)
Reply
Replies (0)