Obtain complete visibility into your network traffic flows by analyzing different flow types from different device vendors. Get real-time bandwidth monitoring insights categorized by device and interface based on the source, destination, application, conversation, and the quality of service (QoS).
Site24x7 supports leading flow technologies including NetFlow, JFlow, sFlow, IPFIX, NetStream, and AppFlow along with devices from different vendors in the market.
Monitoring NetFlow with Site24x7
Configure your network devices to export flows to Site24x7 On-Premise Poller; once Site24x7 receives flows you can view the flow data. You can also configure threshold limits for various performance metrics, and receive alerts when there is a breach.
Site24x7 provides:
- The rate and amount of data transferred at the device-level.
- Traffic, bandwidth utilization, applications, and conversations at the interface-level.
- A list of predefined application and differentiated services code point (DSCP) templates that contain preconfigured values to associate and classify traffic sources.
- Top N applications, protocols, and conversations that have generated or received the most traffic.
- Interface-wise stats like source IP address, destination IP address, port, protocol, DSCP, and traffic for every conversation in your network.
- Different dashboards and reports to enhance your monitoring experience.
How to manage your network with Site24x7's NetFlow monitoring insights?
With the above stats, you can track the amount and type of traffic that flows through your network. You can also view the top devices that generate higher volumes of traffic along with the interfaces that utilize more bandwidth, and optimize them. With the data in both tab and graph form, you can easily interpret changes in trends and spot peaks.
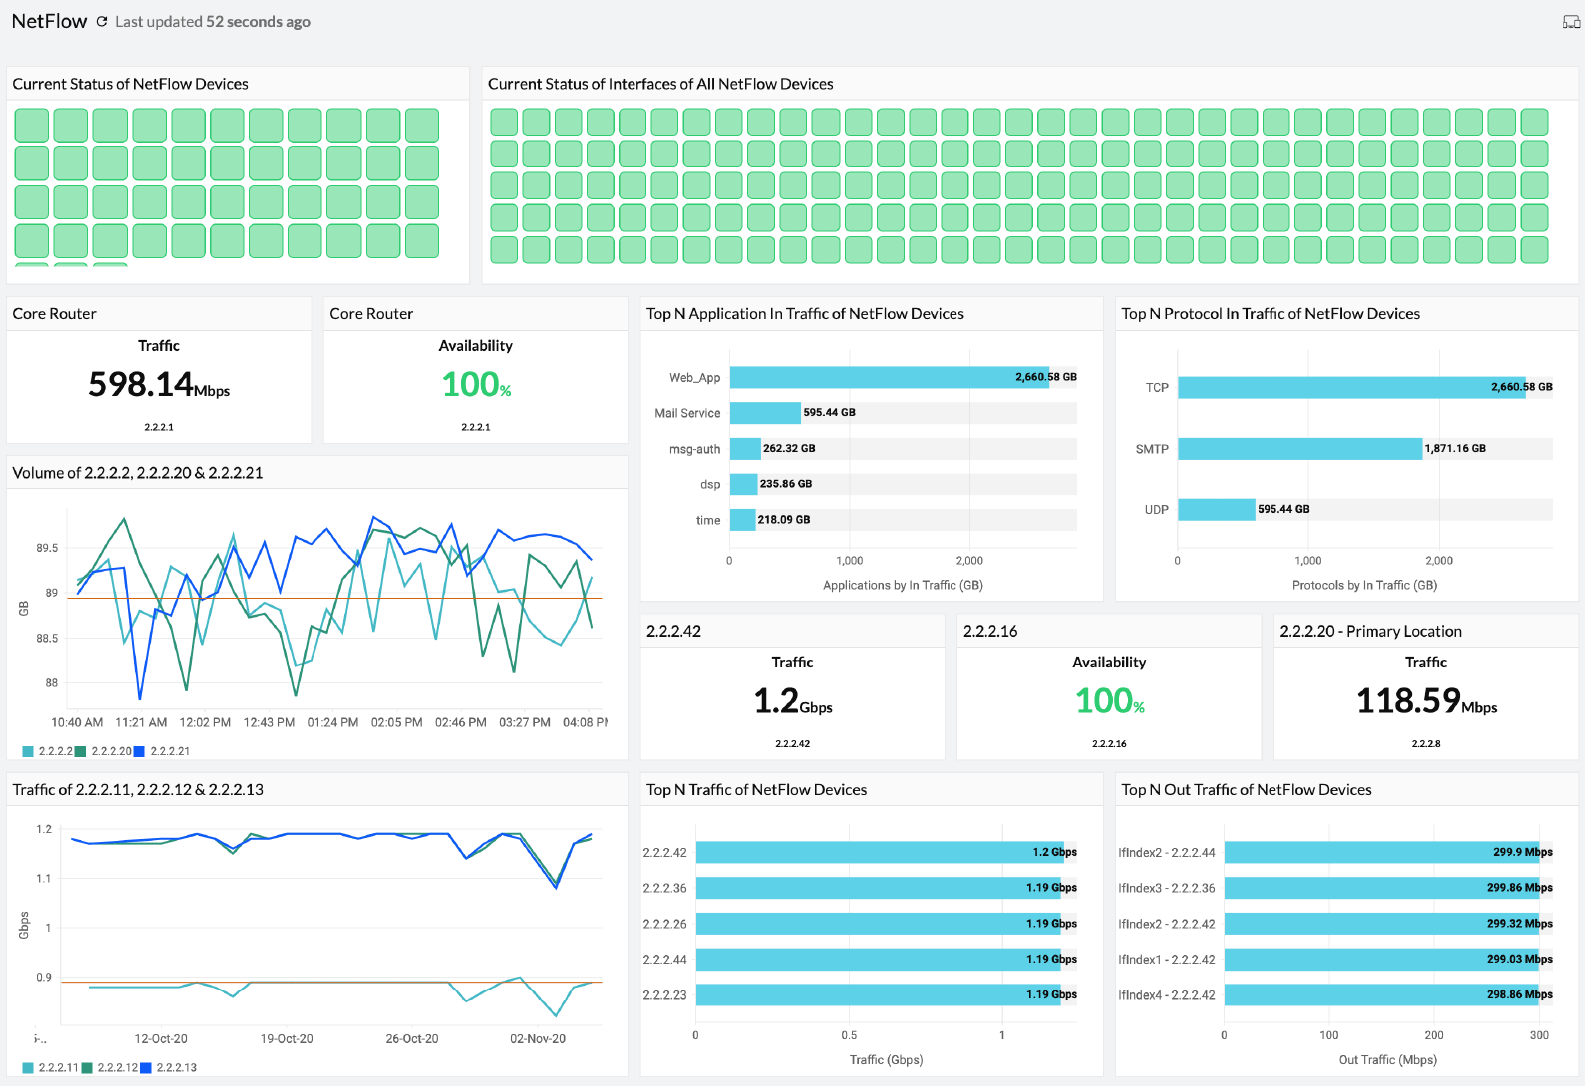
Use the NetFlow health dashboard to view top devices by traffic; top interfaces by volume and bandwidth; and top applications, protocols, and QoS by traffic. With the top N stats, you can reduce workloads and thereby fix network lag. You can also avoid bandwidth hogs by identifying the busy application and the clogged port and clearing them right away. You can also set threshold limits on your key applications so that you can receive an alert through your preferred medium before your bandwidth is exhausted.
NetFlow monitoring also allows you to plan your resource allocation based on the current trends. This helps with capacity planning for the future depending on what each application and protocol consumes daily.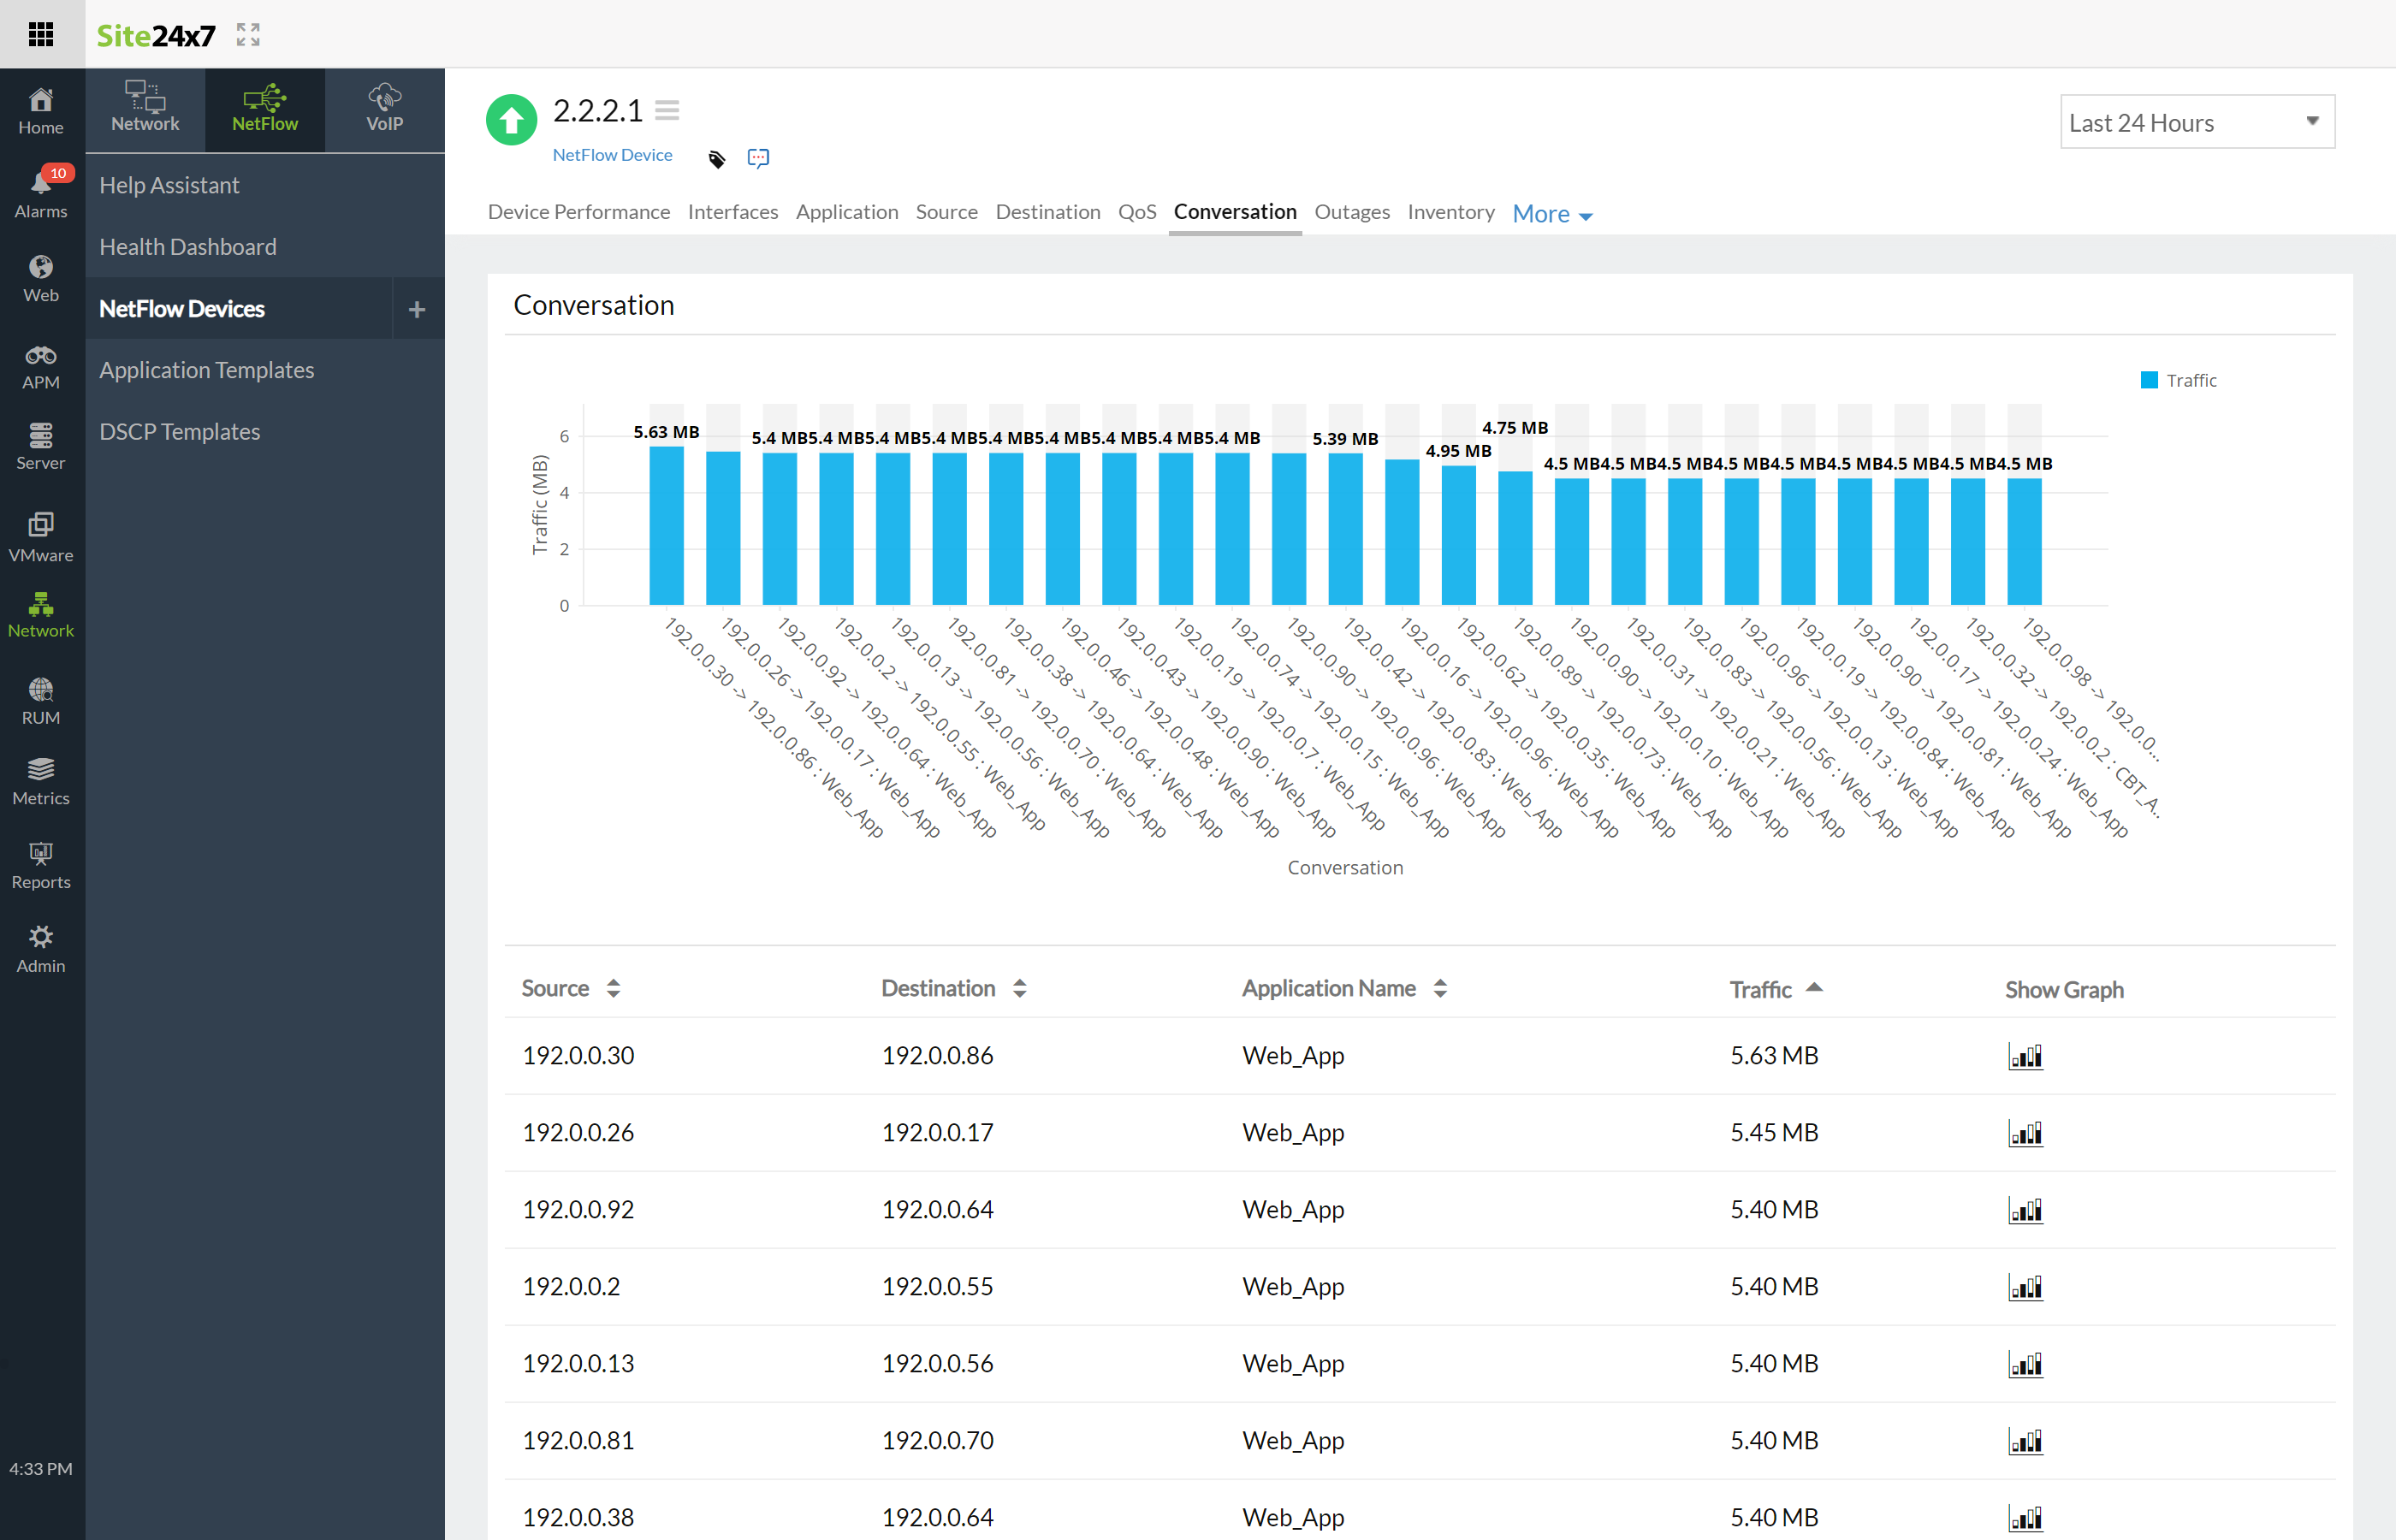
Get started
Refer to our help documents to learn about the prerequisites and other basics you may need to get started.
Feel free to drop your feedback, suggestions, and feature requests in the comments section below.
Until next time,
Happy monitoring