Hi,
I wanted to ask if there is a roadmap to include MRTG graph for network interfaces in network devices as a standard report. it would help users who use 24X7 as a monitoring tool for network devices and backhaul.
Regards,
A Ganguly
Like (1)
Reply
Replies (1)
Hi Ganguly,
You can use our custom dashboard and reports features to achieve the same.
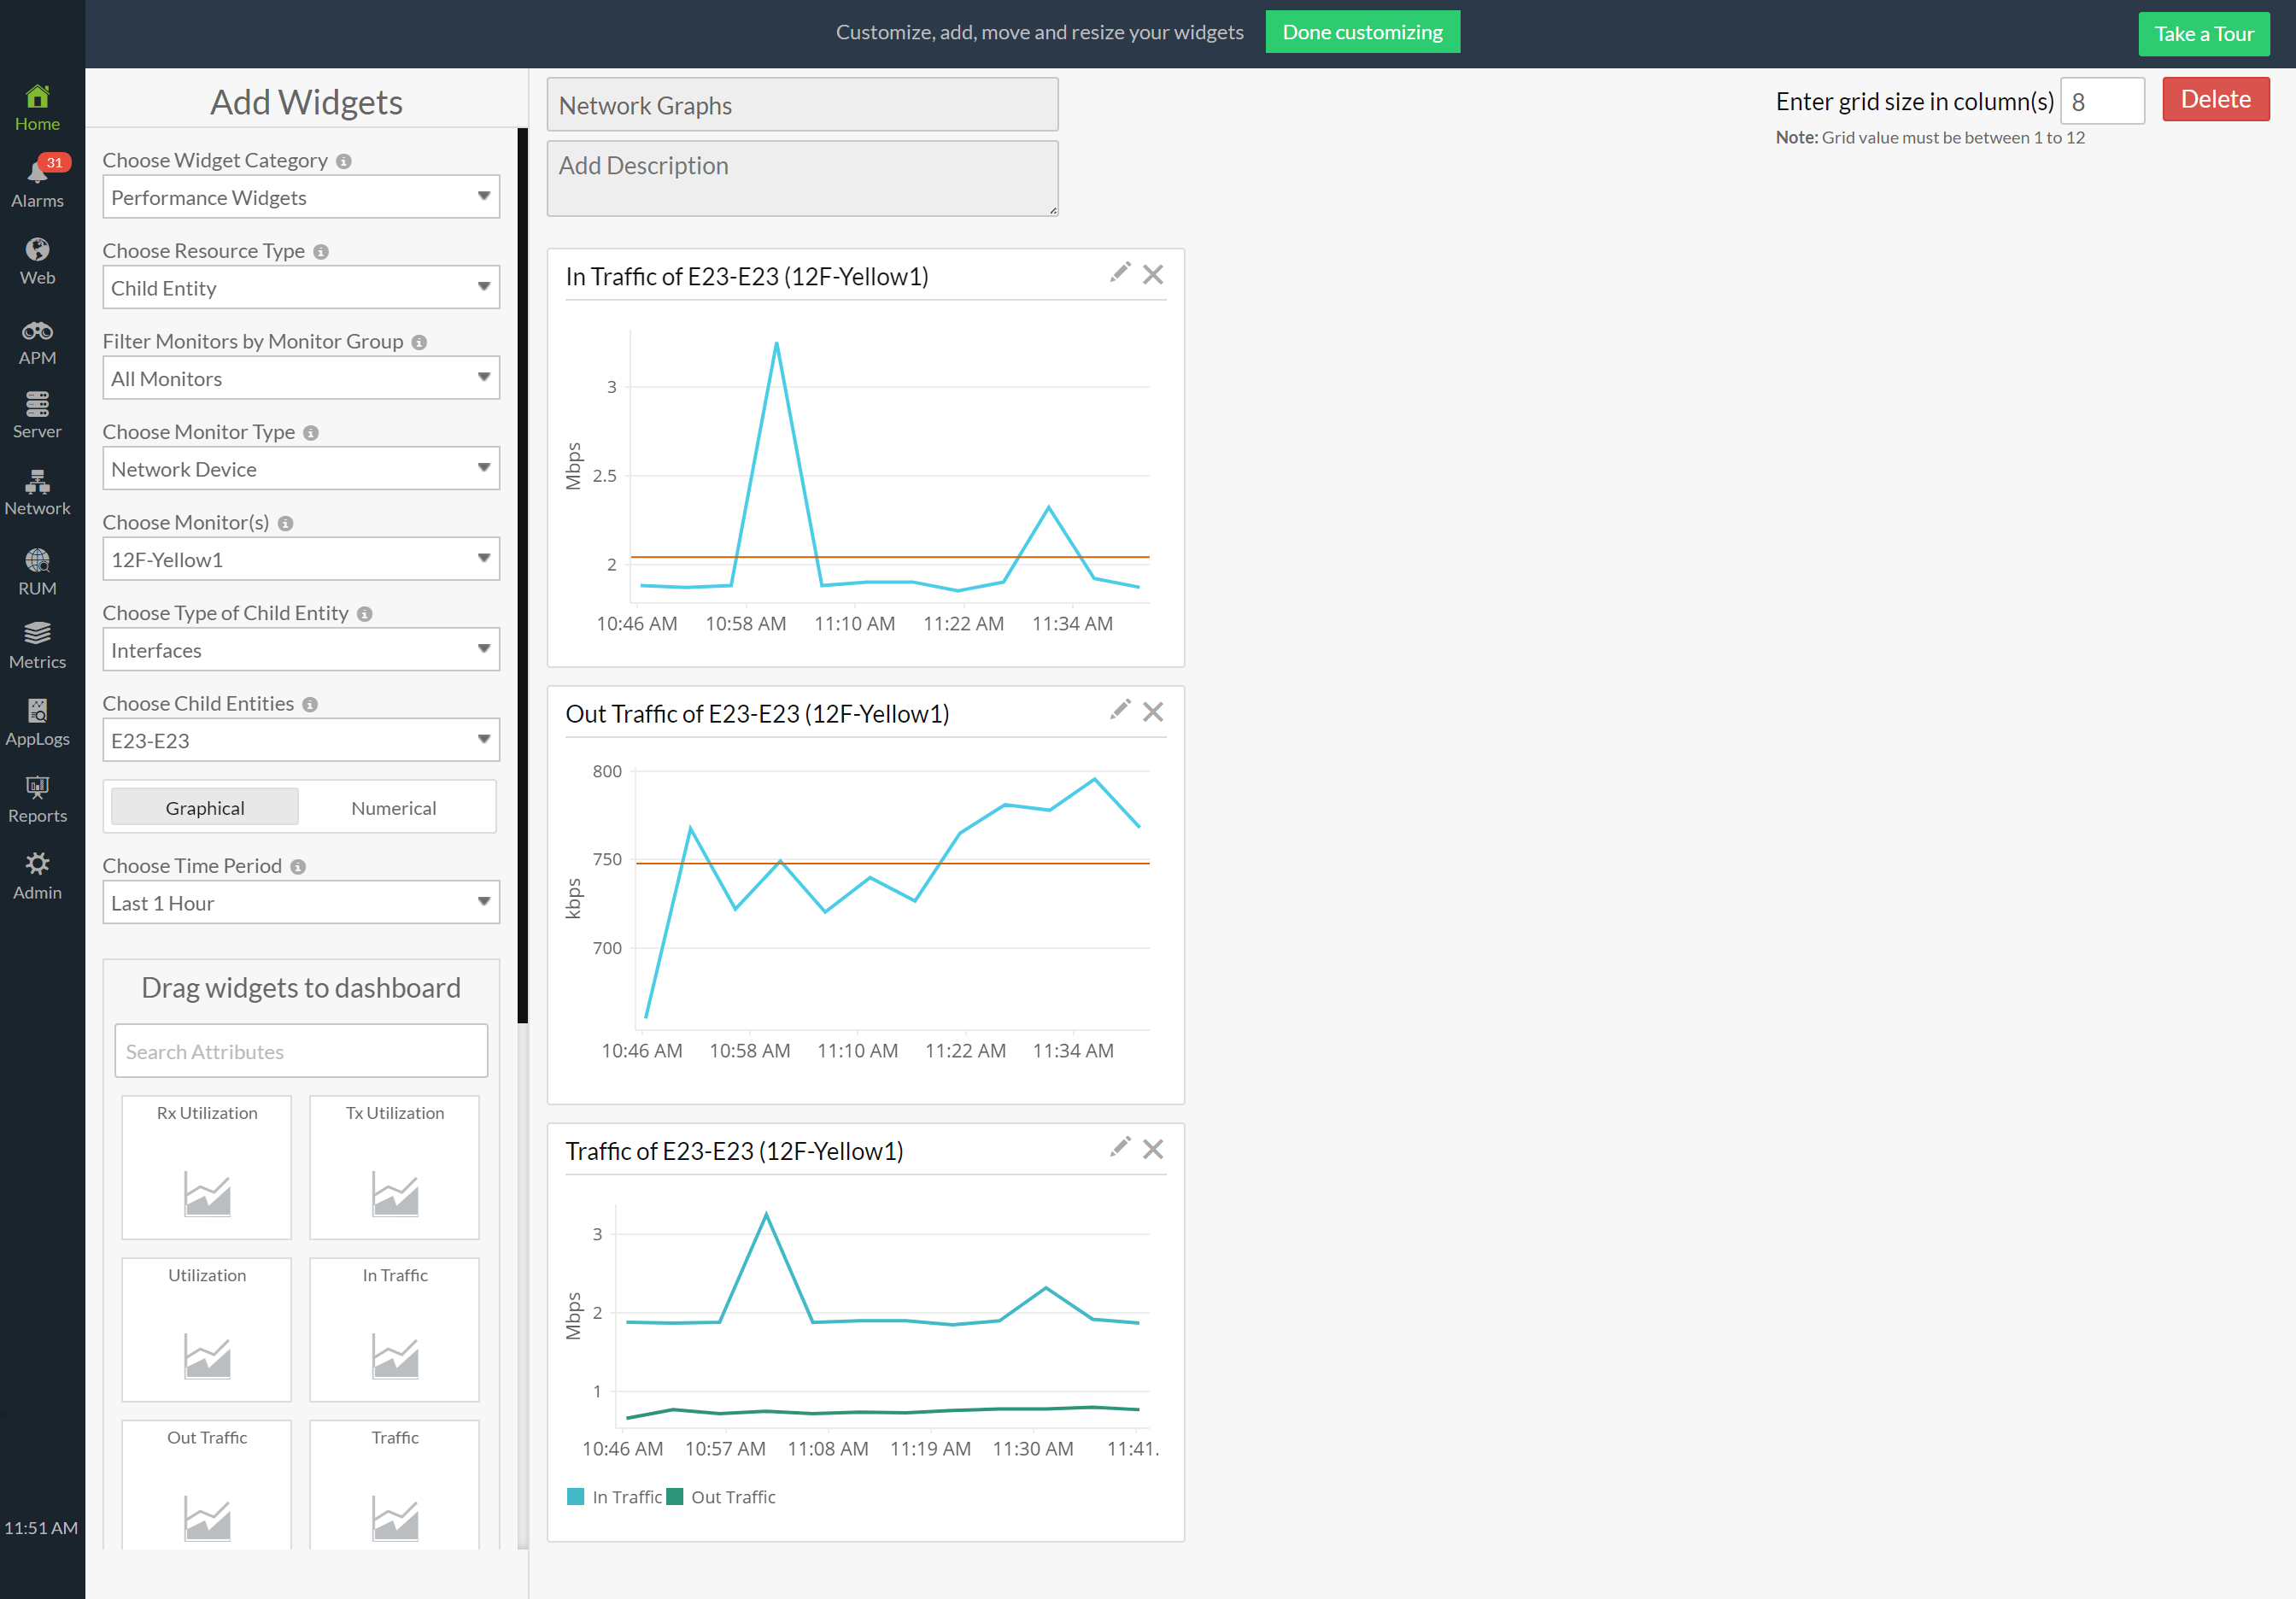
Creating a custom dashboard
- Log in to Site24x7.
- From the Site24x7 menu bar, select Home > Dashboards > + Create New beside the title Custom Dashboards.
- Type the dashboard's title, or keep the default name. Add a brief description to communicate the purpose of the dashboard.
- Choose the Widget Category: Performance Widgets.
- Choose the Resource Type: Child Entity.
- Choose the Monitor Type: Network Device.
- Choose Monitor(s): Choose the desired Network device from the drop-down menu.
- Choose Type of Child Entity: Interfaces.
- Choose Child Entities: Choose the required network interfaces from the drop-down menu.
- Drag and drop the desired widgets.
Viewing Interface reports
Navigate to Reports > Network Device > Interface Reports. Here, you can filter based on the device and view interface reports specific to the device.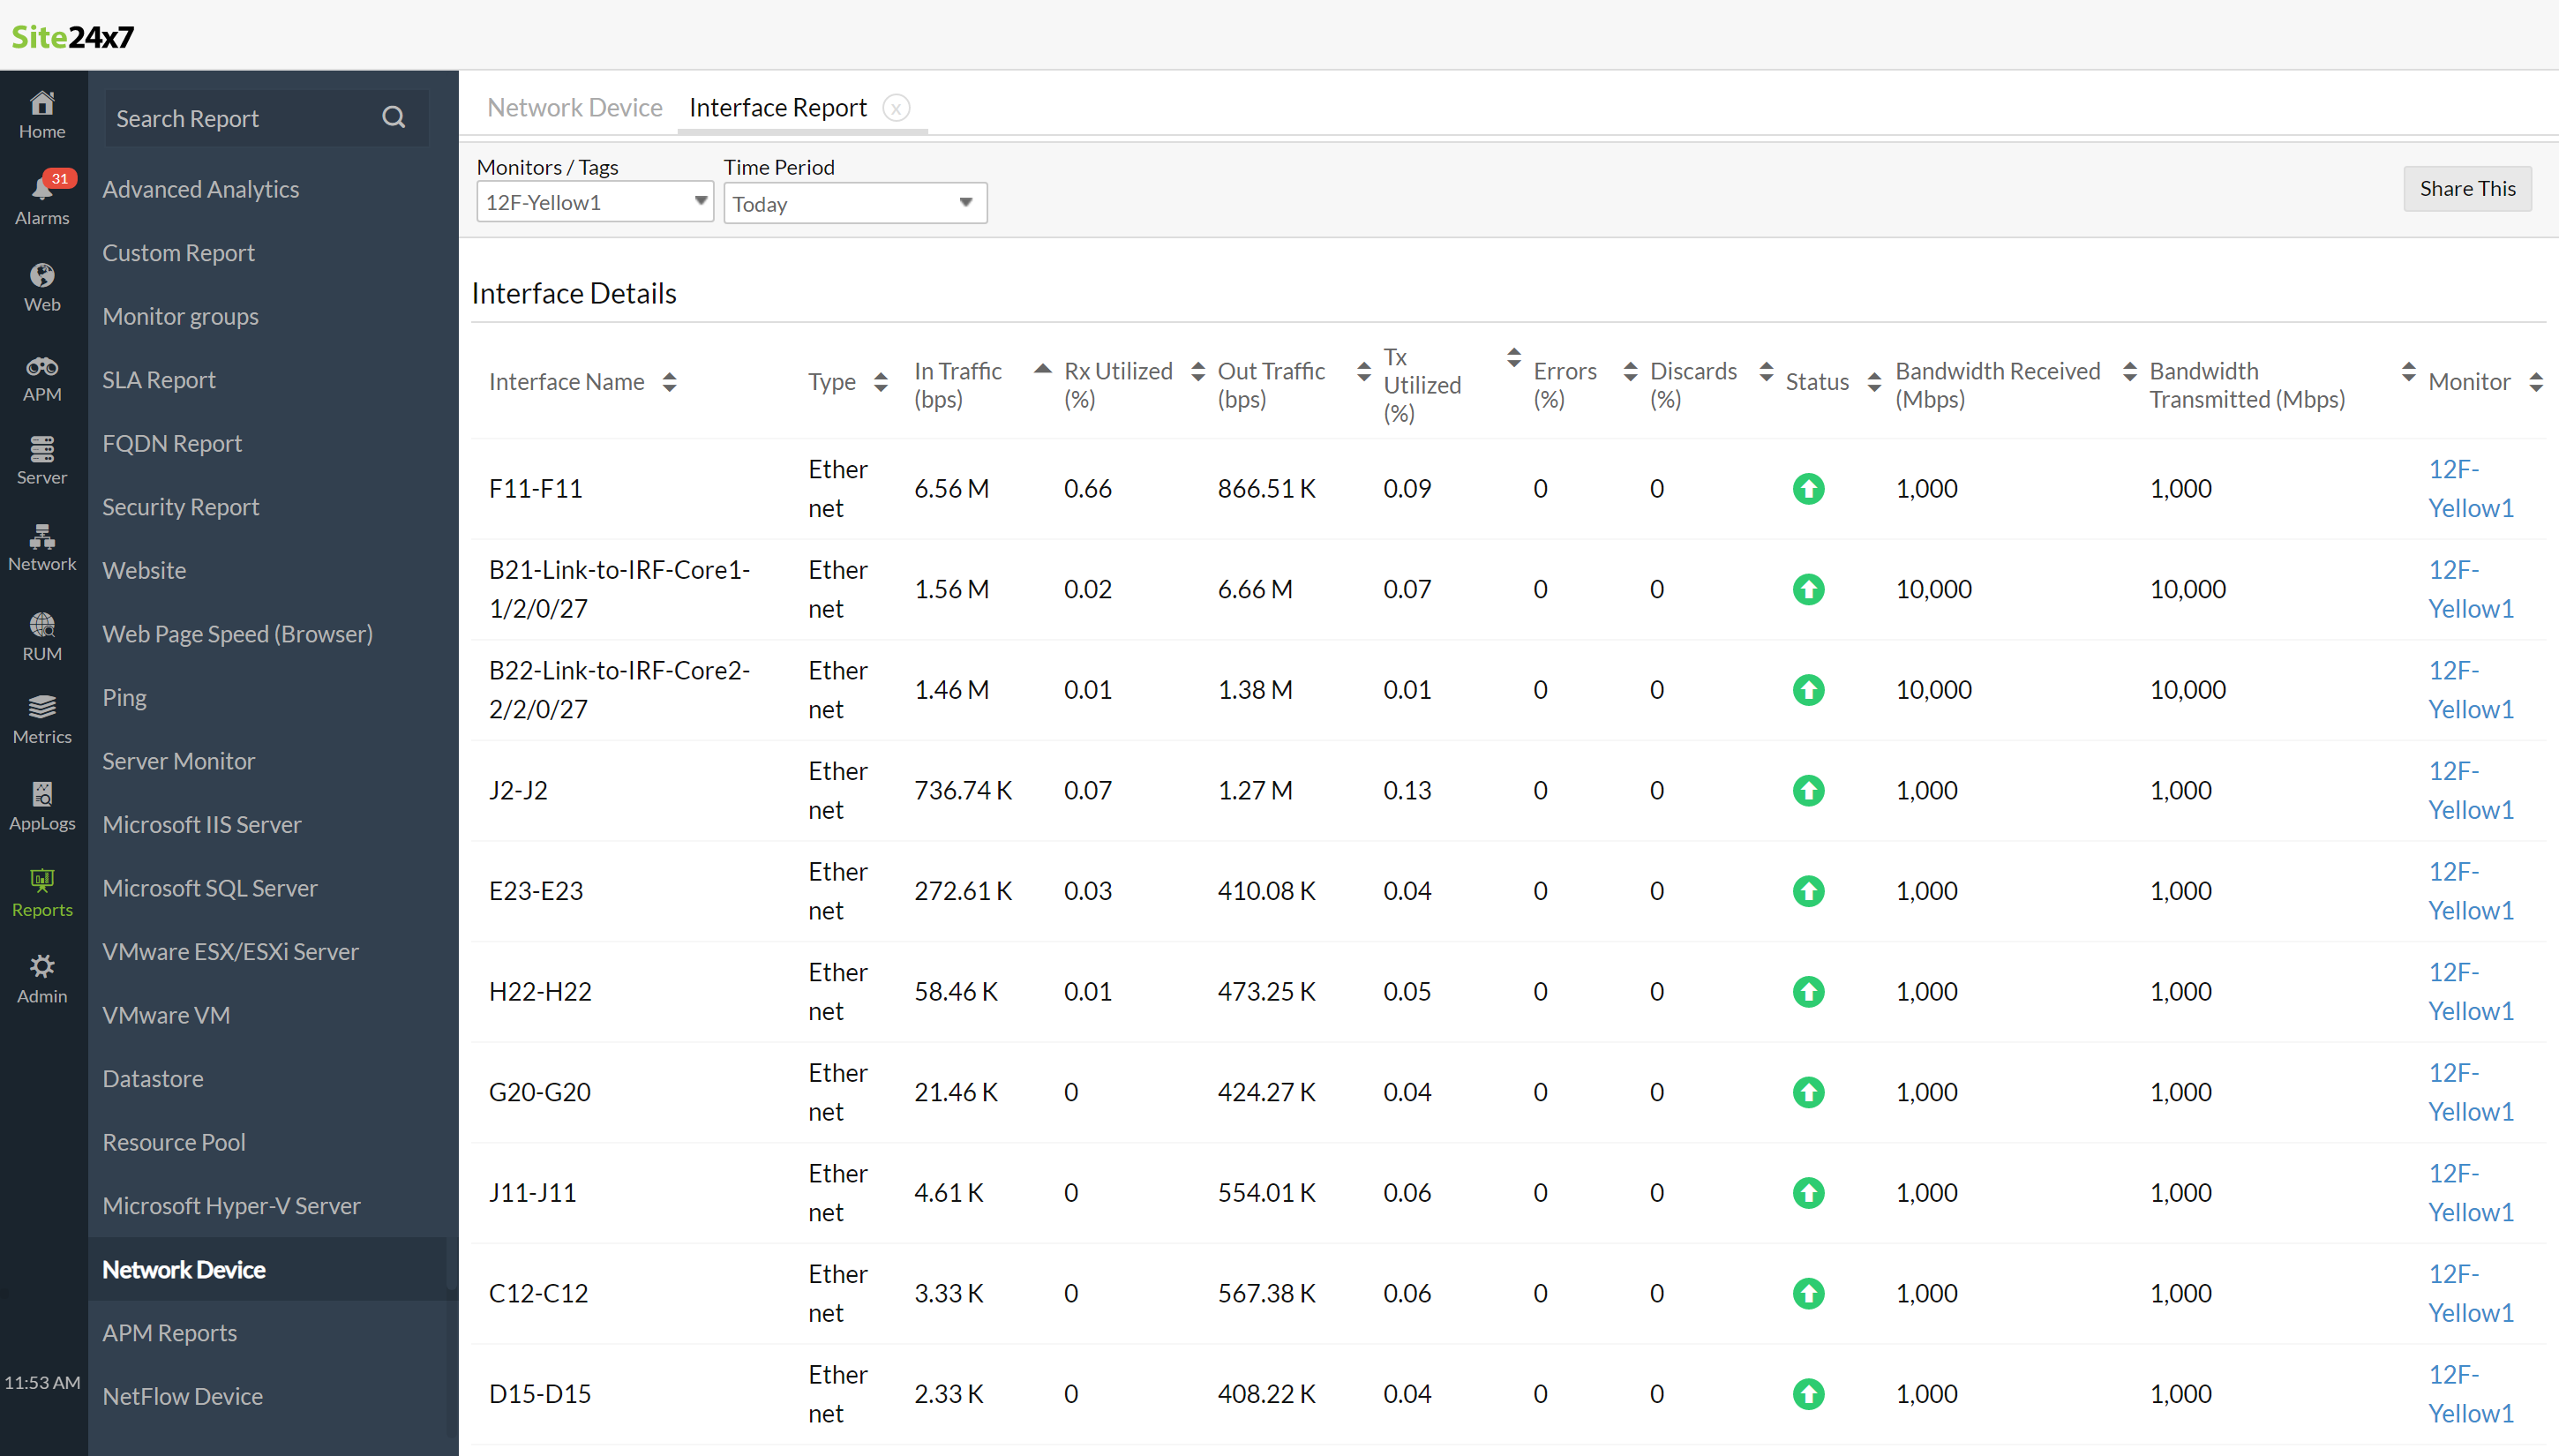
Hope this helps. Please get back to us for further clarifications.
Thanks,
Santhi
Like (0)
Reply