Hi Team,
please need to below requirement and confirm, we are looking for setup on very urgent bases.
|
#Portal having one Tab which we can download the Service up-time Performance report/Availability and Response time report vai Group Bases/Individual, bandwidth utilization. |
|
#Set the Response thresholds value and it should be customized against monitoring |
|
# Feature request on displaying the downtime description while moving the cursor over the monitor on the status page, rather than showing at the bottom of the page. |
|
# AD Integration using Zoho Accounts, where the logged in users access the status page |
|
# Network Monitoring for Gateway interface. |
|
# Displaying the Throughput of the monitor along with Response time in Status Page. |
|
#Auto Chat response if users asking any query related to IT issues. |
|
# Feature request on displaying the downtime description while moving the cursor over the monitor on the status page selected locations showing the interruption time reason(Reason for outage) during that time. |
Thanks
Warm regards
Deepesh Sharma
<Phone number removed by Admin>
"Feature request on displaying the downtime description while moving the cursor over the monitor on the status page, rather than showing at the bottom of the page."
The purpose of a status page is to see the current status of whatever it is that you are displaying on that page, there is no other data presented on the initial part of the status page except that something is having issues, even on other status pages I have not seen this feature, but rather the standard way that Site24x7 is doing it which is more details a bit down in the page.
Even Status Page which is considered the leader in status pages doesn't do what you ask for. See https://status.status.io/
Hi Deepesh,
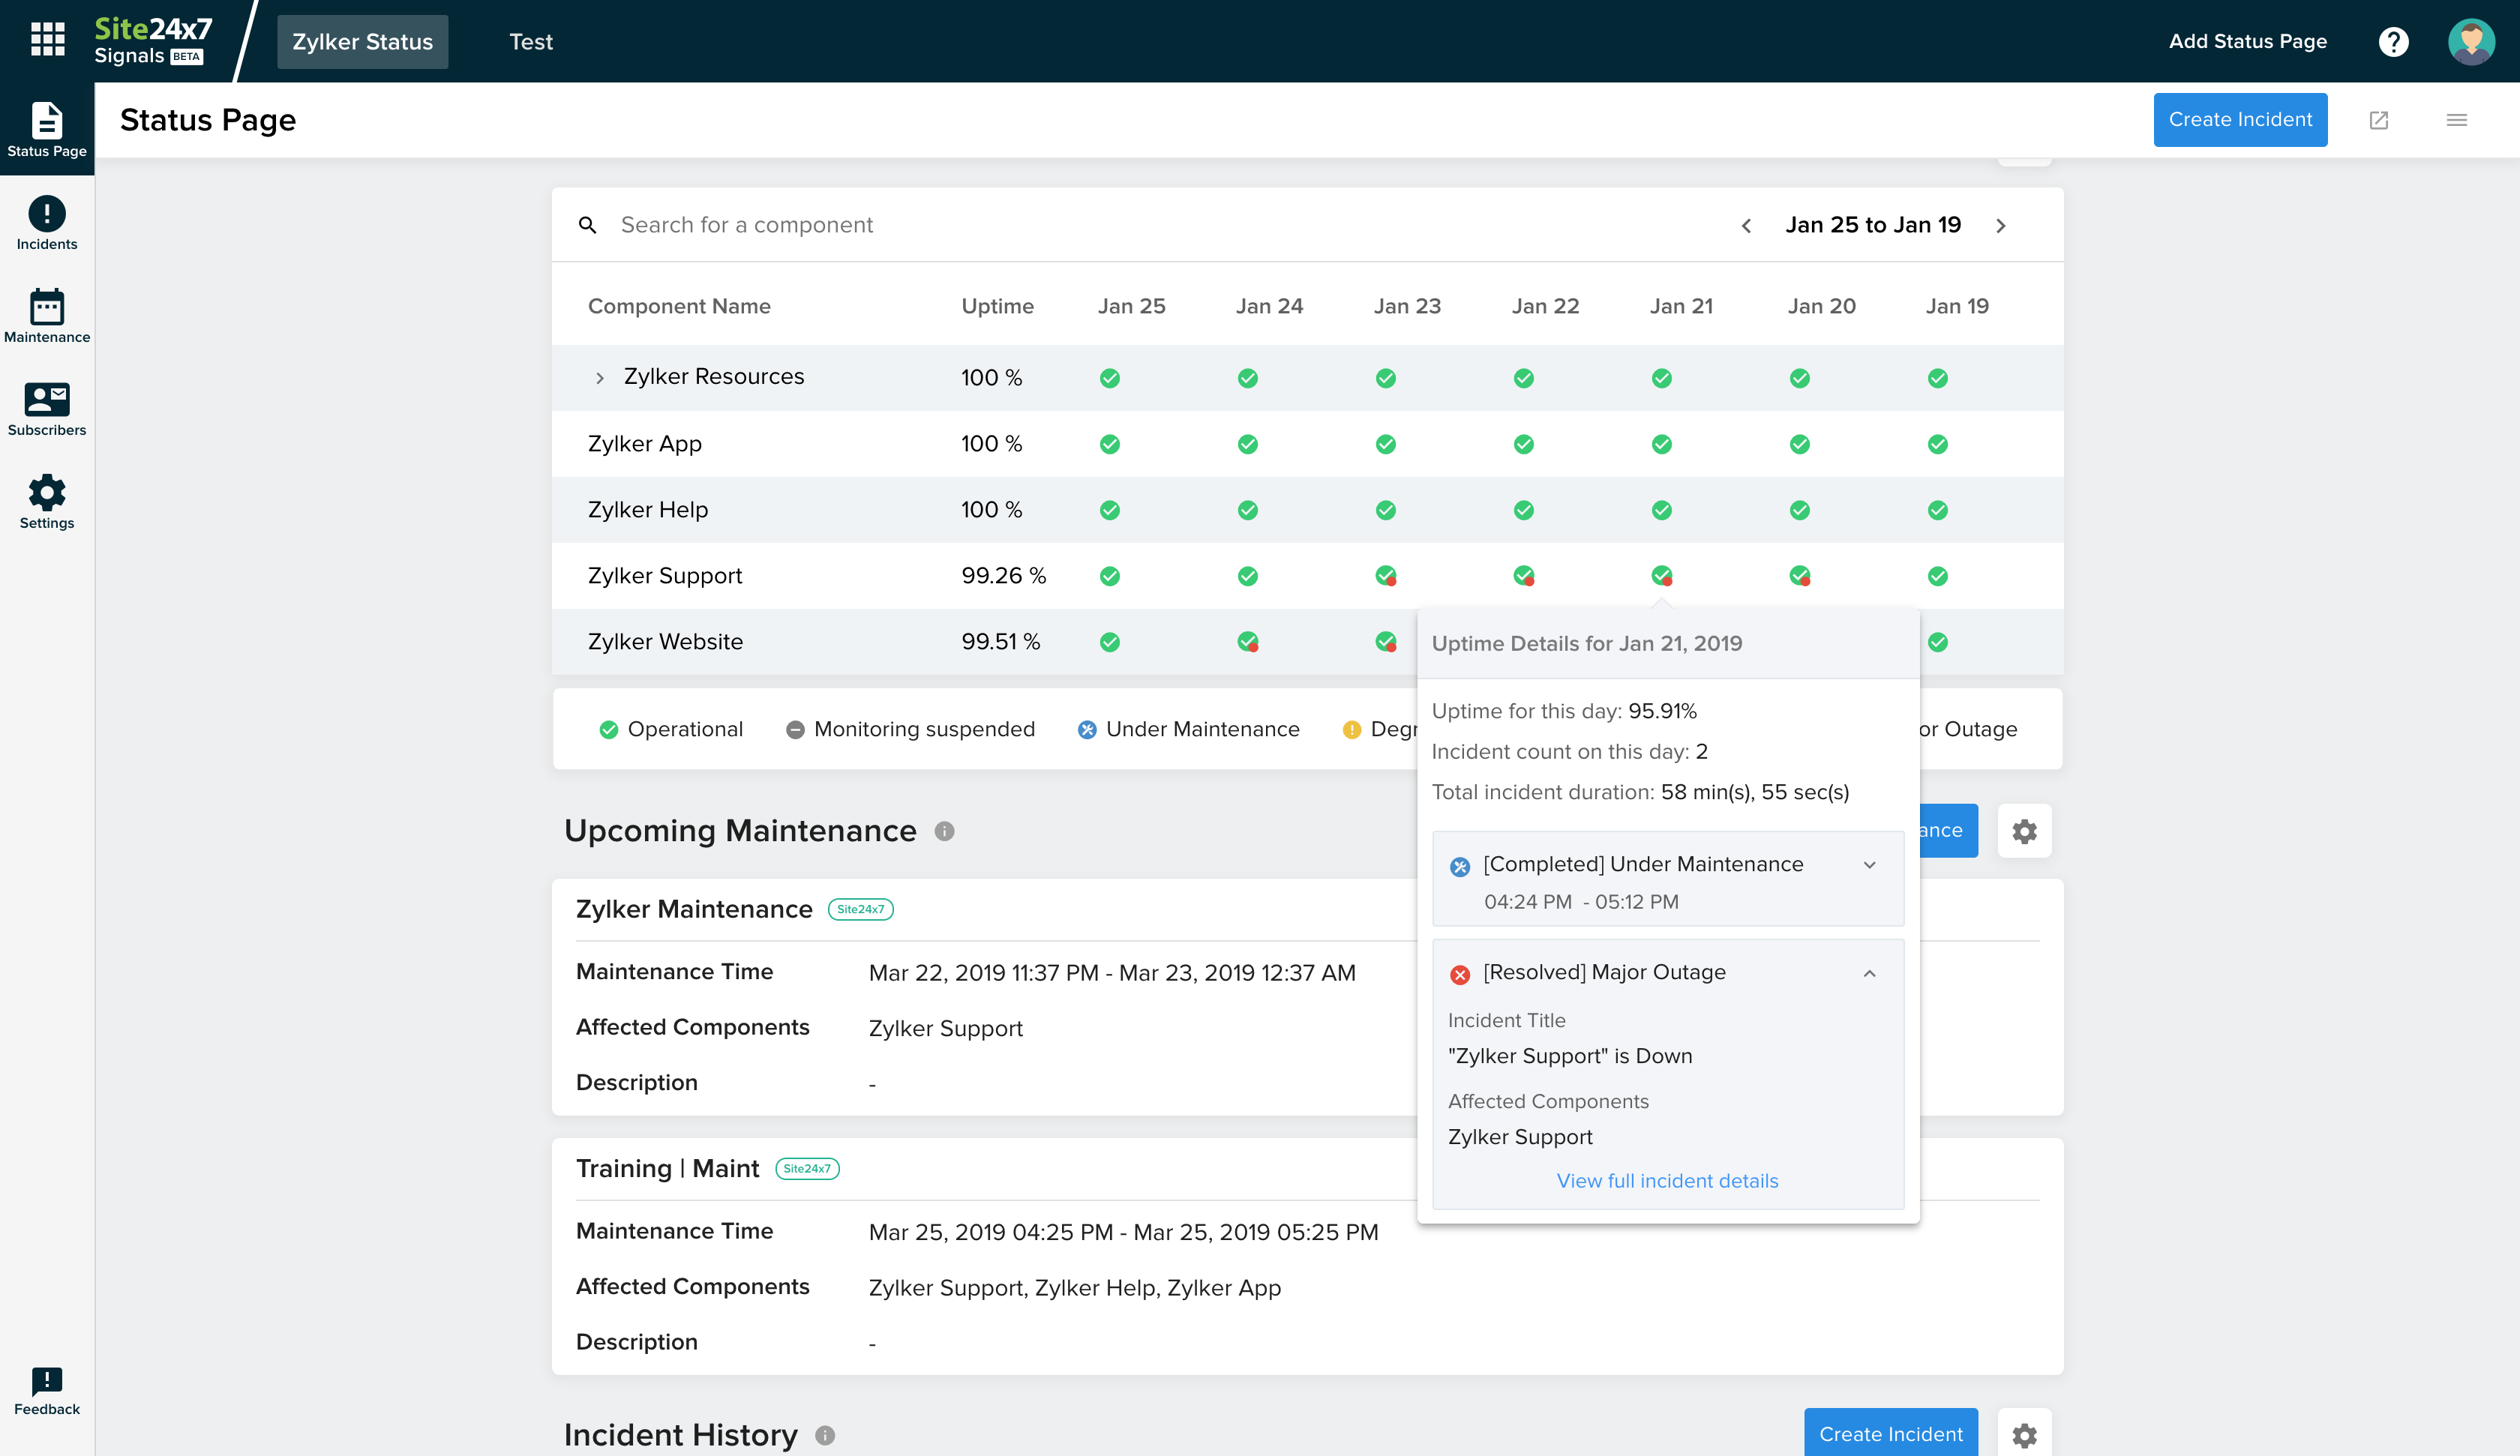
#Feature request on displaying the downtime description while moving the cursor over the monitor on the status page selected locations showing the interruption time reason(Reason for outage) during that time
We have implemented this feature and it is updated in live. You can see the downtime description/associated incident on clicking status icons in status history section.
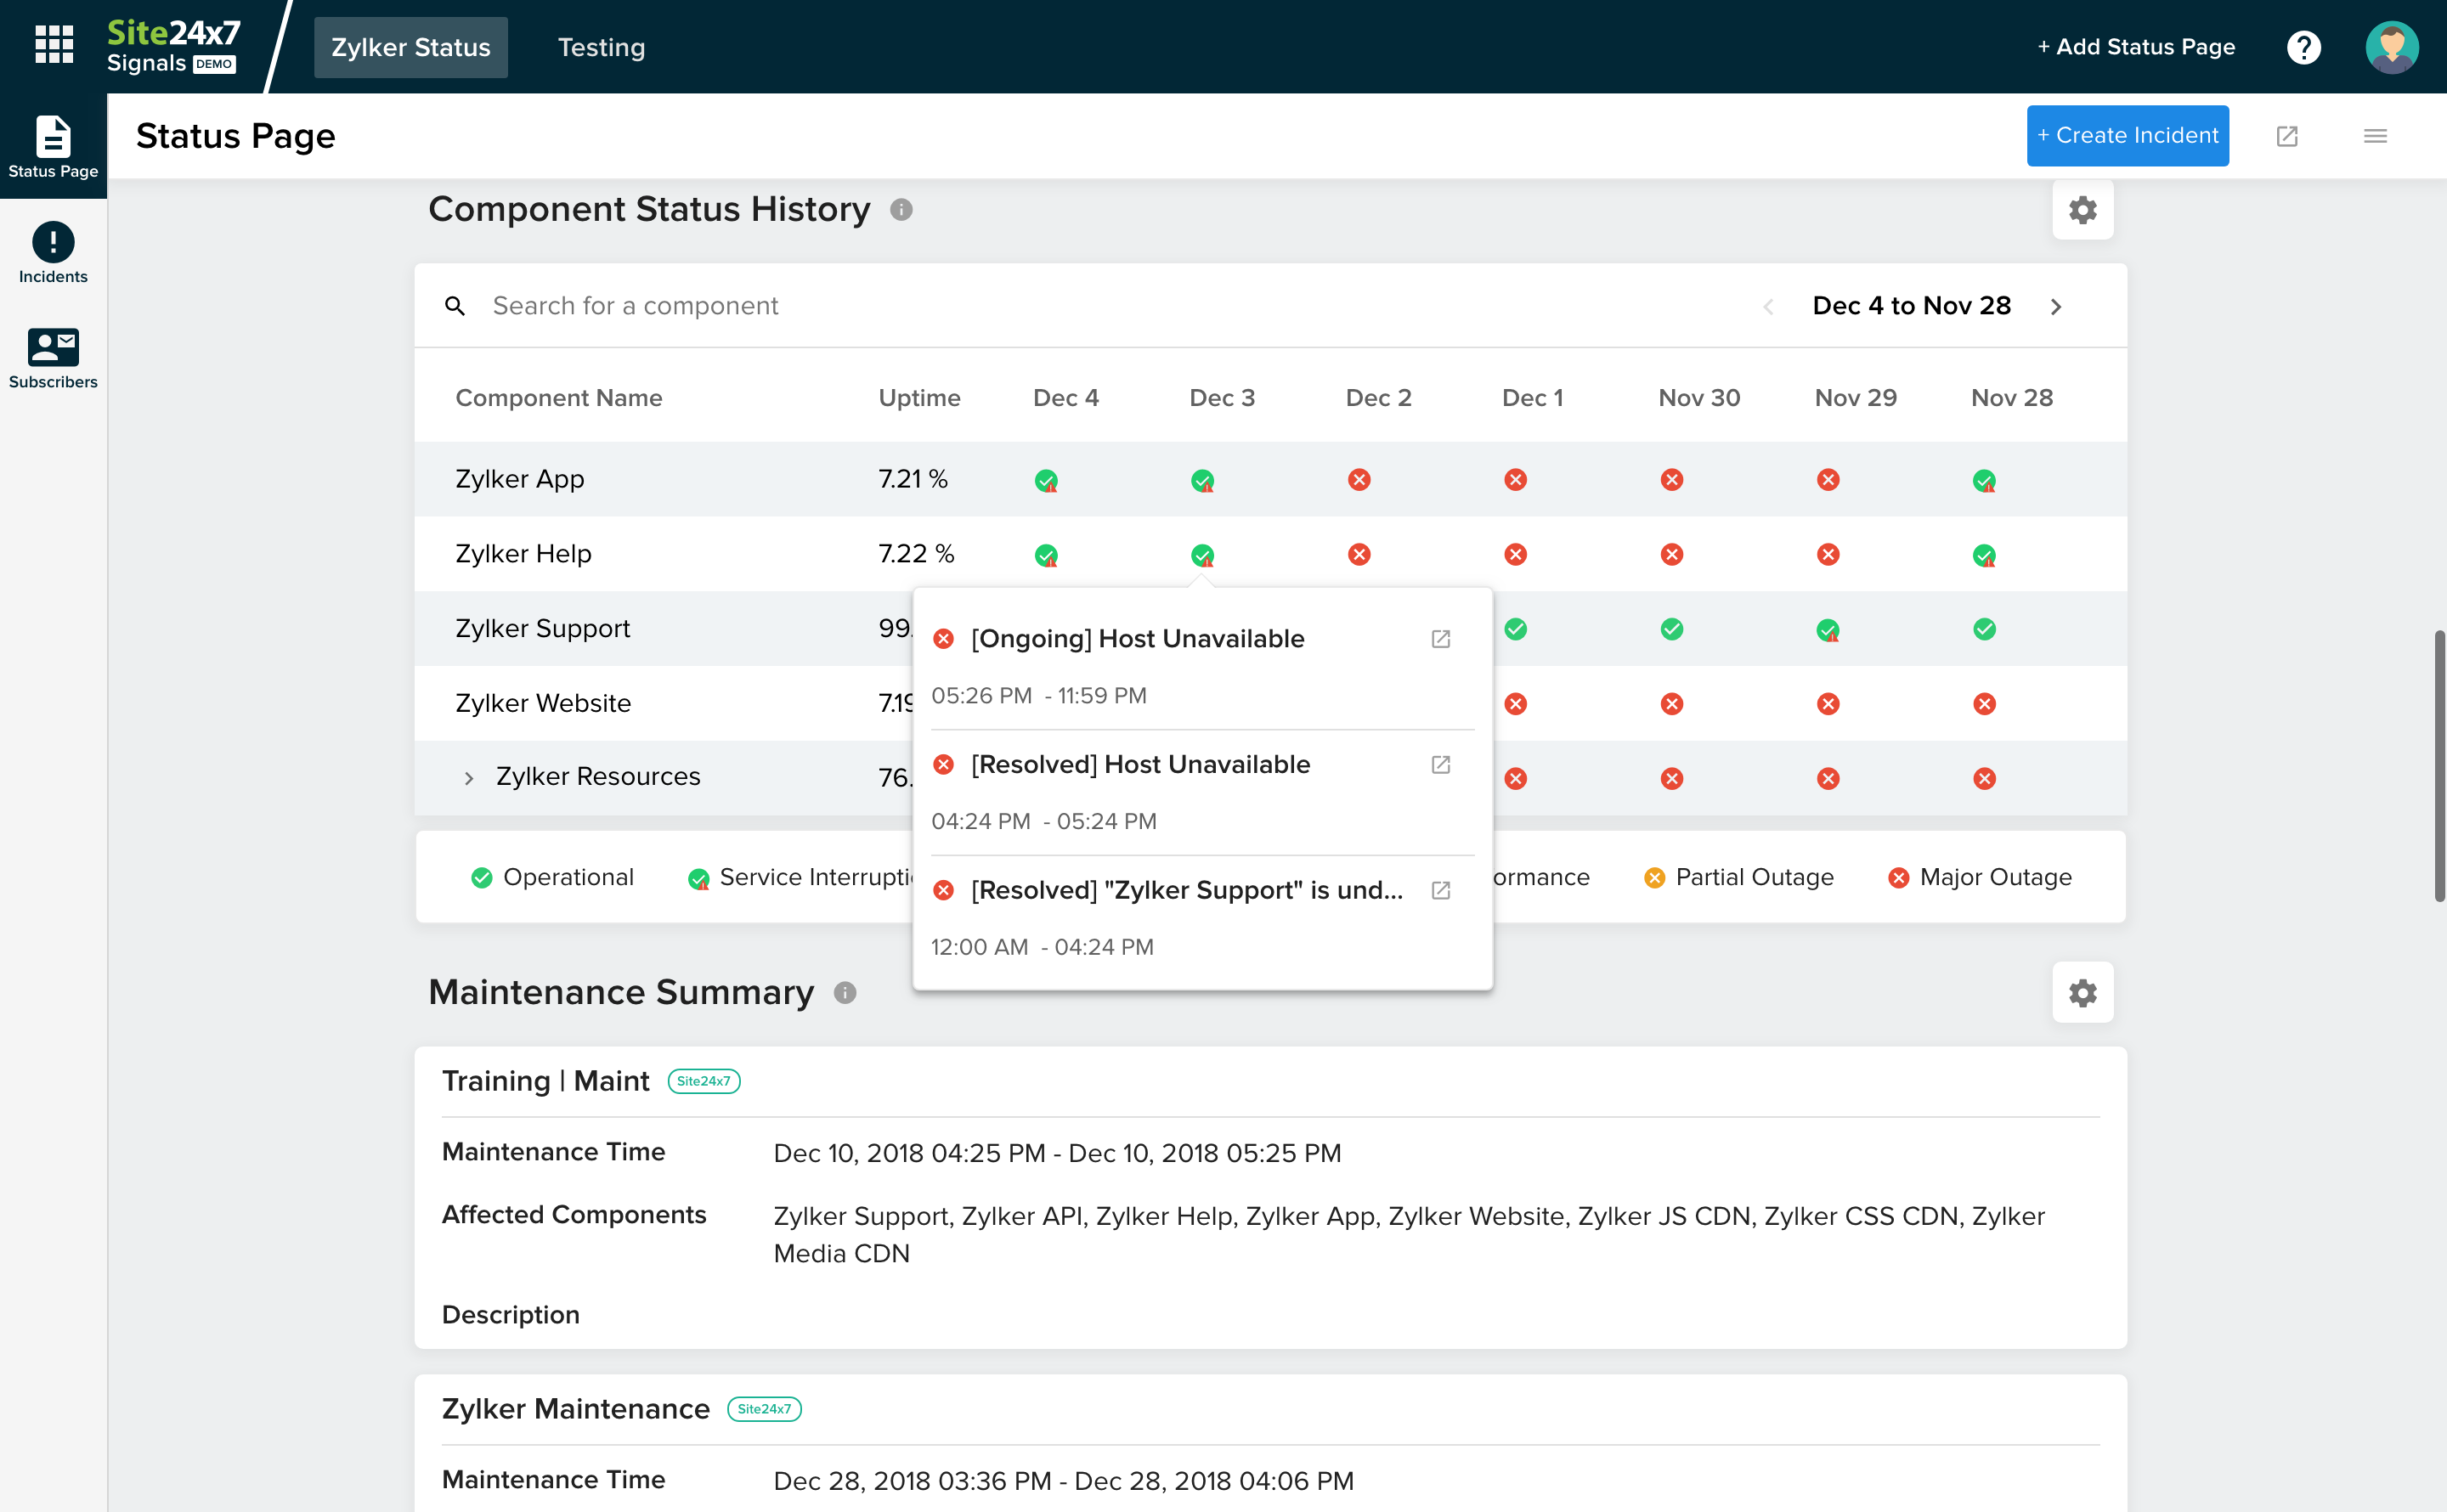
Kindly check it once and provide your feedback.
Regards,
Laxmikanth
Hi Deepesh,
We have enhanced our “Component Status History” info panel. From now onwards it will show,
- Total uptime of the component for that day
- Total incident count in which the component has been affected
- Total incidents duration for the day
- List of all the related incidents
You can also view the complete incident details by clicking each related incident.
Regards,
Karthik