by Jenifer P
Hello there!
Managing containerized workloads on Podman often means switching between CLI tools and performing manual checks to view your hosts, pods, and containers. Without centralized visibility, finding a resource-heavy container or a failing pod quickly is difficult, and the impact may already have occurred before you notice.
By using Site24x7's Full-Stack Agent, you can now monitor your Podman infrastructure and get a unified view of all Podman resources, from hosts to containers.
Key benefits of Podman monitoring
Here’s what you can achieve with Podman monitoring in Site24x7:
- Monitor hosts, pods, and containers from a unified console: Gain complete visibility into your Podman environment by tracking the health and performance of hosts, pods, and containers from a single interface.
- Track real-time performance metrics: Monitor critical metrics such as CPU usage, memory consumption, RSS, swap usage, OOM events, disk I/O, and network throughput for containers and pods in real time.
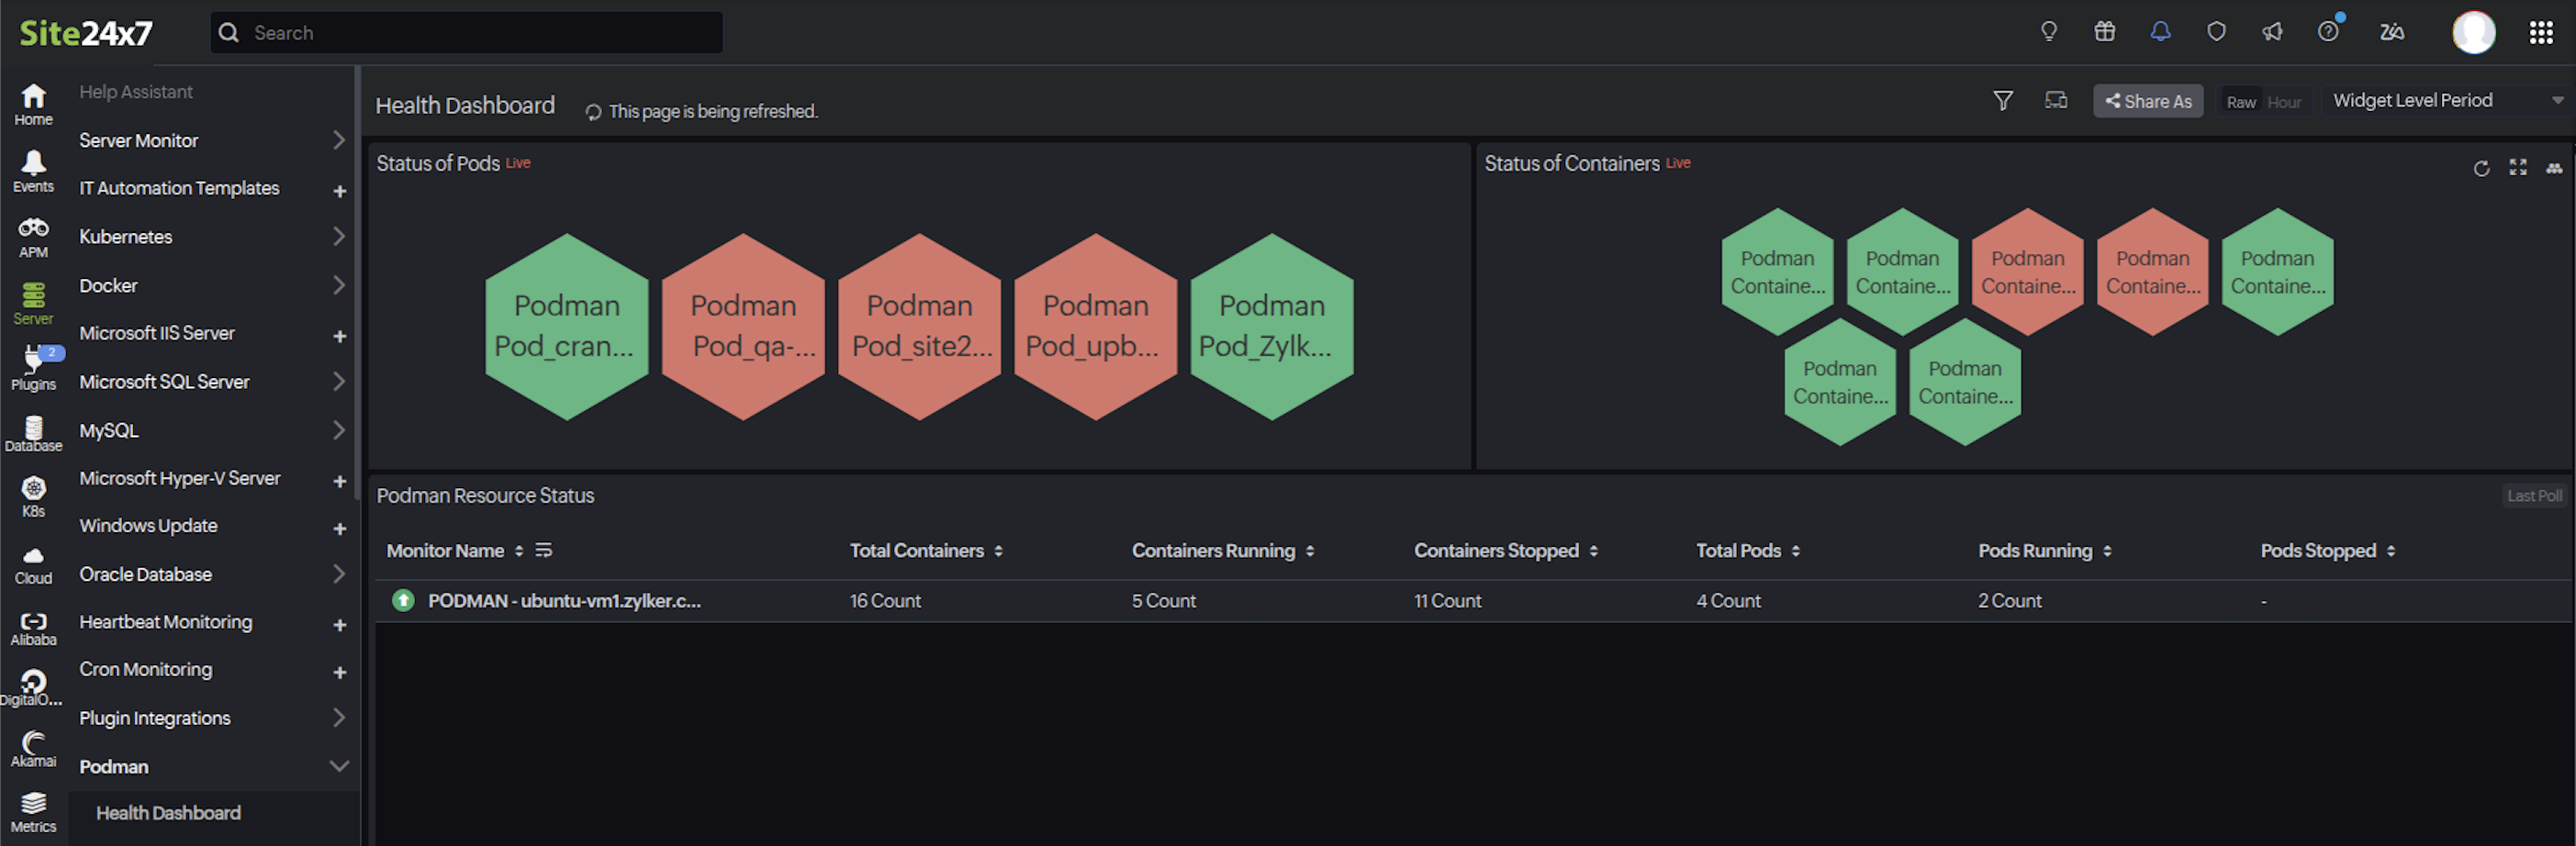
- Get an instant view of resource health: Use the Health Dashboard to view live pod and container statuses, top CPU and memory usage reports, and an overall Podman Resource Status summary for quick troubleshooting.
- Configure precise threshold-based alerts: Set custom thresholds for metrics like CPU utilization, the restart count, and OOM events to receive immediate alerts when predefined limits are exceeded.
Getting started
Discovering Podman is quick and simple, and you can begin collecting and analyzing metrics in just a few steps.
Refer to the Podman monitoring help documentation for the complete setup guide, performance metrics reference, and configuration rules.
Do you have any thoughts or questions? Feel free to share them in the comments below!
Warm regards,
The Site24x7 team
Like (0)
Reply
Replies (0)