Being able to get the monitor group summary elements to be presented into a dashboard would be incredibly powerful.
Being able to see monitor group stats is one of the most powerful things in this platform the number of outages, and top 10 down count would be incredibly powerful for everyone.
With the dashboards being able to be presented to customers and inserted into Microsoft Teams, this would be wonderful to have.
Hi Adam,
Thanks for your feedback. We will add Down count and Top 10 monitors by down count widgets in the future.
Hope you have tried other monitor group level metrics available in dashboards. However, let me take this opportunity to explain to the community about the same.
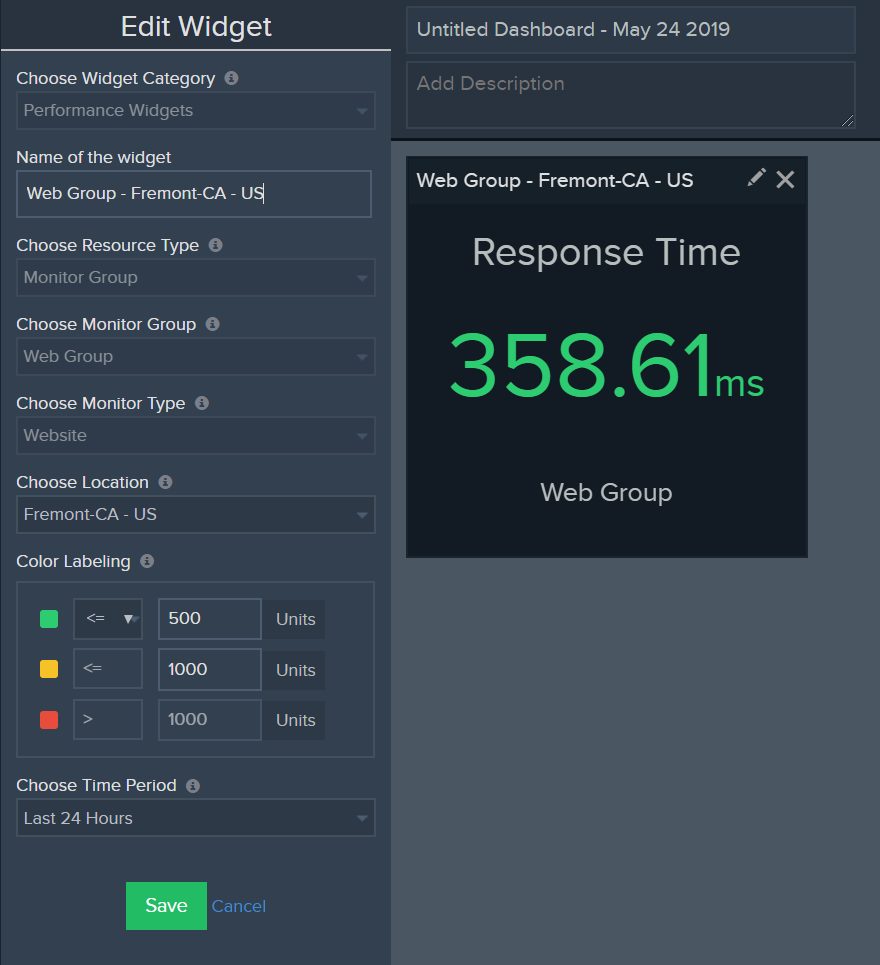
Performance: By selecting a monitor group in "Performance Widgets - Numerical" category, you can get the average performance, for example, the response time of all the websites, in the group. In addition to that, you can also have color labeling based on your preference.
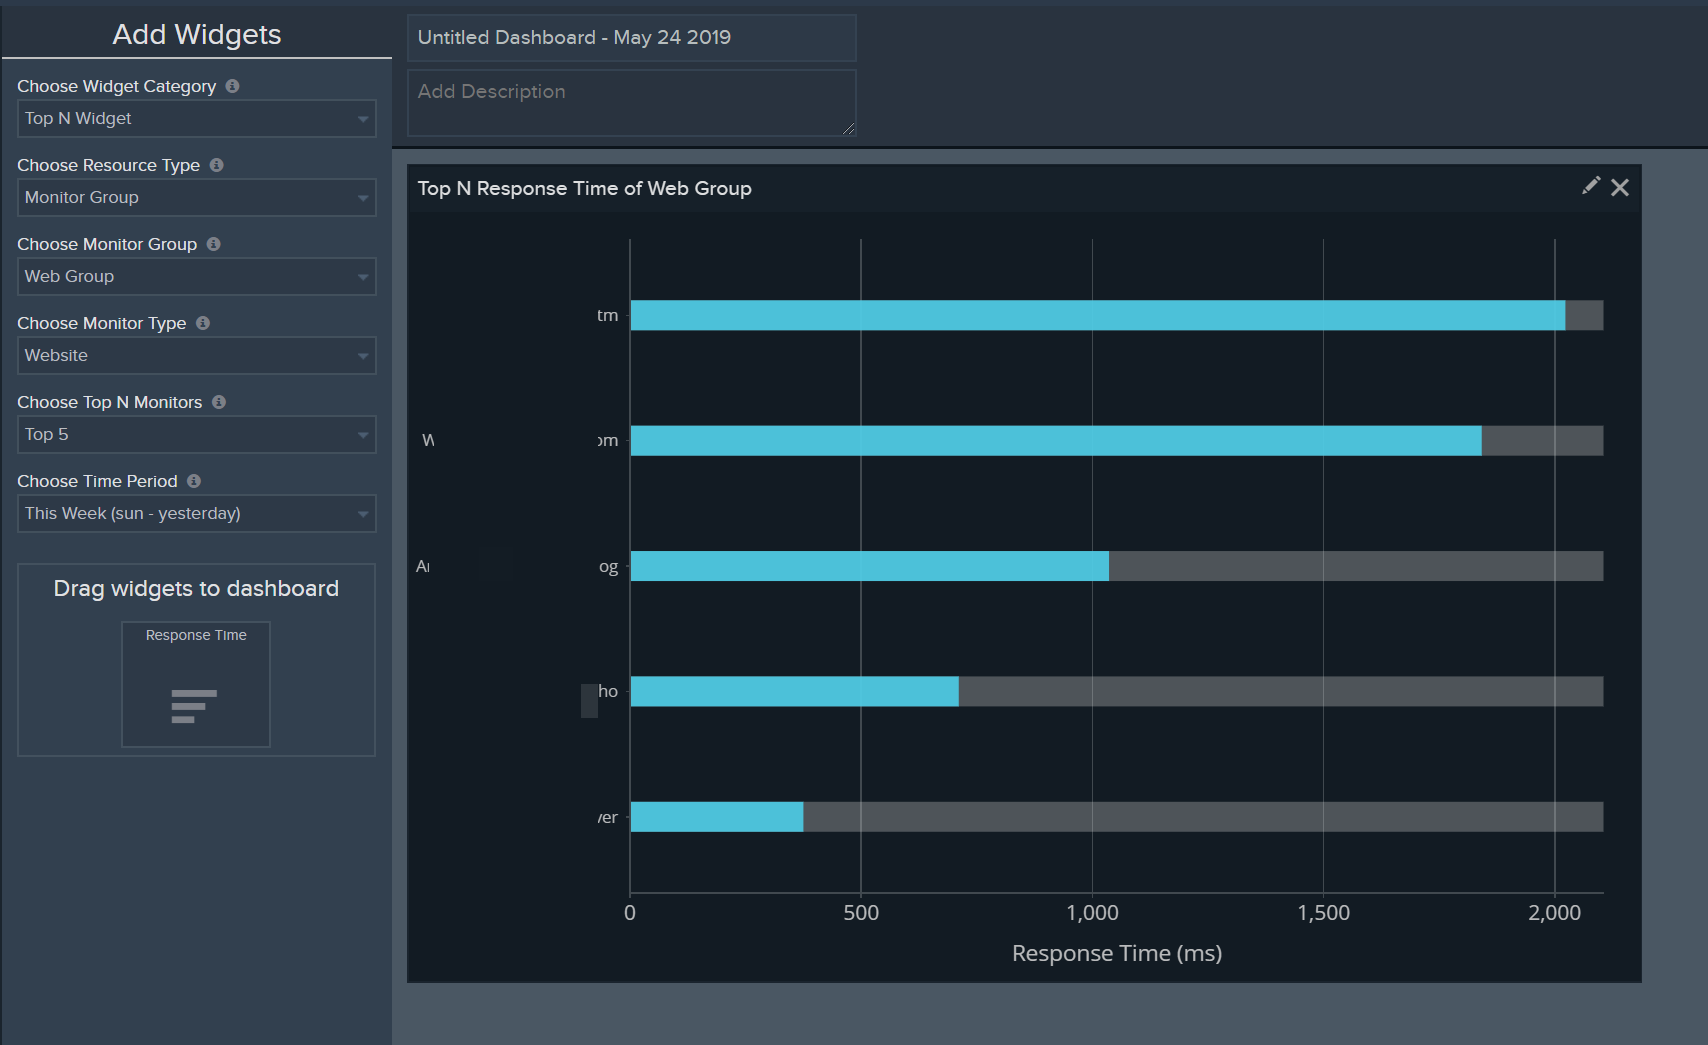
Top N Performance: In "Top N Widget" category, you can get sort the top 5 or 10 monitors having high-performance numbers, say Servers with high CPU usage, within the selected group.
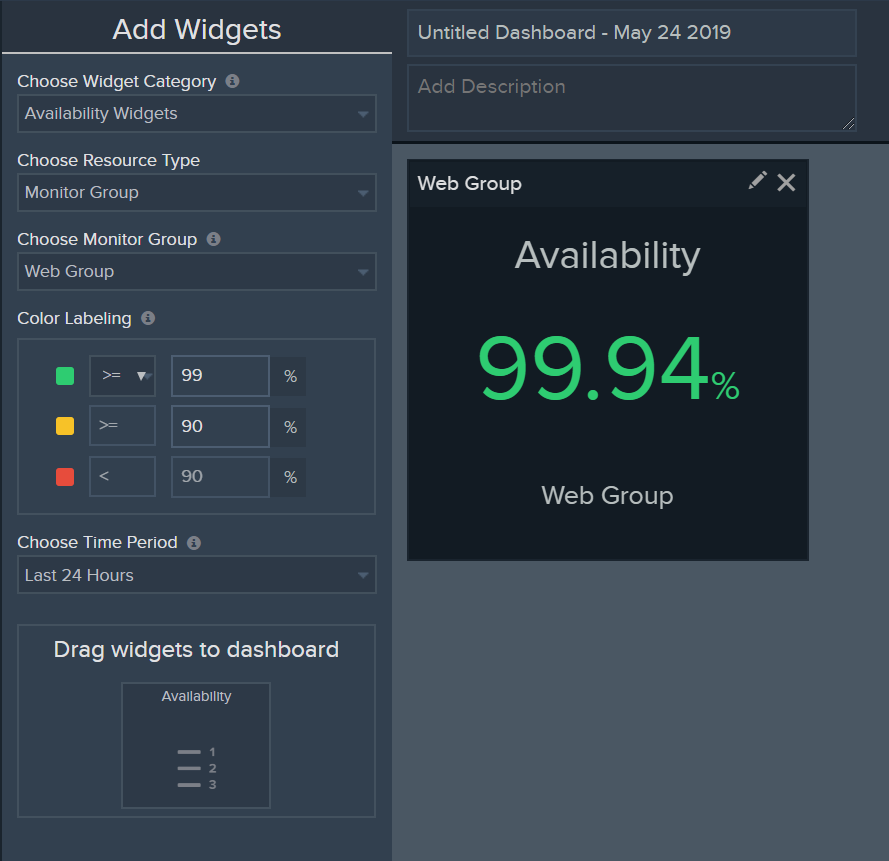
Availability: In the "Availability Widgets" category, Numerical option for a monitor group will show the average availability of all the monitors in the group. This also has color labeling.
"Alarm Widgets", will provide the current down/trouble/critical status monitors count of the selected group.
