A JVM crash is a fatal error where the Java Virtual Machine terminates unexpectedly, typically leaving behind an hs_err_pid.log file or a system core dump. While the JVM is highly stable, it can crash due to native memory exhaustion, segmentation faults (often linked to bugs in JNI or native code), or even underlying hardware issues like faulty RAM. Understanding the root cause of a JVM crash is critical to restoring your application's uptime quickly.
Troubleshooting JVM crashes is vital, especially when they involve mission-critical systems. Consider a financial application that relies on notifications from a payment processor to process payments. If this application encounters a JVM crash, it will lead to the loss of crucial notifications from the payment processor. Consequently, the users of the application would be adversely affected, as their payments would be processed without them receiving the corresponding value.
This guide helps you diagnose and troubleshoot system crashes efficiently. You will learn to navigate fatal error logs and apply advanced diagnostic techniques, ensuring the stability and dependability of your Java applications.
System crashes occur when the JVM or underlying system on which it runs unexpectedly fails, resulting in the abnormal termination of running Java programs. Therefore, it's crucial to understand the likely causes of system crashes and how best to troubleshoot and respond to them.
The following are common reasons why a system crash may occur.
The JVM allocates memory for Java objects and data, with reference-type objects in the heap and primitive values in the stack. When the heap memory is full, an OutOfMemoryError may occur. Garbage collection frees up unused objects but the error remains if not enough memory is freed.
Running out of memory can cause the JVM to crash due to the following reasons:
Monitoring memory usage and adjusting heap sizes is crucial for optimal application performance. Site24x7's Java monitoring tool is a valuable resource for monitoring JVM metrics. It gives a complete picture of your Java application's performance and also helps you identify anomalies in real time. For instance, it monitors the number of active threads in the JVM, providing insights into thread utilization, thread pool management, and potential thread-related issues such as thread contention or deadlocks.
Segmentation faults, or "segfaults," occur when the JVM accesses invalid memory locations or performs illegal memory operations, often when executing Java bytecode. It's common in native languages like C and C++.
Segmentation faults can cause the JVM to crash in the following ways:
To avoid segmentation faults, you should minimize the use of native code with JNI, leveraging Java's built-in features like lists, iterators, maps, and heaps for automatic memory management. Prioritize thorough testing to address potential memory-related issues and ensure program stability. Also, keep JVM libraries and plugins up-to-date for bug fixes, performance enhancements, and security patches that reduce the risk of memory errors and vulnerabilities.
While software bugs are a frequent culprit, hardware issues such as faulty RAM are a common, yet often overlooked, cause of unpredictable JVM crashes. Running memory tests like memtest86 can help rule out physical memory failures. Additionally, crashes often originate outside the JVM in third-party libraries, native agents (such as performance profilers), or JNI-based drivers. Using JDK diagnostic tools like jhsdb or system-level debuggers like gdb on OS core dumps can help pinpoint whether a bug in native code or hardware is triggering the crash.
Failed assertions in Java are rare, especially in more recent versions of Java like Java 8 and beyond. Failed assertions typically indicate a fundamental issue with the JVM version being used.
Failed assertion errors can occur when the JVM fails to detect certain expected program states. For example, if you add an object multiple times to a list, you would expect multiple references to the same object to be stored in subsequent indexes of the list. However, if only one instance of the object reference is found in the list, it indicates a deviation from the expected behavior of Java.
Encountering a failed assertion error means that Java is not behaving according to its specified rules. In the past, users who experienced failed assertions in Java 1.5 and Java 1.6 versions reported that it often resulted in the termination of the JVM.
Whenever a JVM crash occurs, a fatal error log is created, typically named hs_err_pid<pid>.log. The fatal error log contains critical information about the JVM crash and the state of the JVM at the time of the error. Analyzing the hs_err_pid.log is the primary method used to troubleshoot a JVM crash and determine its root cause.
The fatal error log file is divided into different sections, which include the following:
A bare-bones log file can be found in this GitHub gist https://gist.github.com/ehizman/e4152ba4562dada95b28d92b9d932c4b.
On Windows computers, the fatal error log is, by default, created in the directory where the Java process encountered the crash. The default location where fatal error logs are created is usually the current working directory or the installation directory of the Java application.
On Linux and Unix-like systems, the JVM fatal error logs are typically generated in the /tmp directory.
The following sections provide a hands-on example of troubleshooting a JVM crash using fatal error log files. You'll reproduce a JVM crash and subsequently analyze the fatal error log that's created.
The example uses a Windows computer, the IntelliJ IDE, and JDK 17.0.4.
In this example, you'll reproduce a segmentation fault that leads to a JVM crash. Consequently, the JVM crash should create a fatal error log in your program's root directory.
Create a Java file called Crash.java, then copy and paste the code shown below into the file:
import sun.misc.Unsafe;
import java.lang.reflect.Constructor;

public class Crash {

    public static void main(String[] args) throws Exception {
        final Constructor<Unsafe> unsafeConstructor = Unsafe.class.getDeclaredConstructor();
        unsafeConstructor.setAccessible(true);
        final Unsafe unsafe = unsafeConstructor.newInstance();
        System.out.println(unsafe.getAddress(0));
    }
}
Note that the Java sun.misc.Unsafe package is used in the program above. This package gives Java developers access to low-level operations like manipulating the program memory directly.
The program above attempts to read from an invalid memory address during program execution. After running the program, you'll notice that a log file was created in the root directory of the folder in which your Java program runs. In this example, the created log file is named hs_err_pid30080.log:
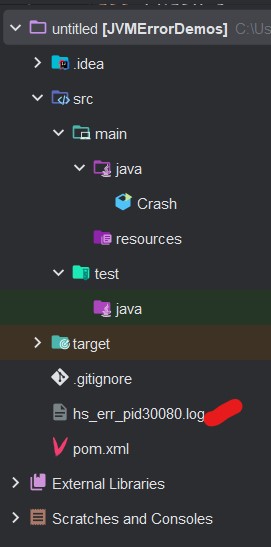 Fig. 1: Screenshot showing fatal error log created in program directory
A fatal log file starts with a header section that contains a brief description of the crash. Below is a snippet of the header section from the hs_err_pid30080.log file created above:
#
# A fatal error has been detected by the Java Runtime Environment:
#
#  EXCEPTION_ACCESS_VIOLATION (0xc0000005) at pc=0x00007ff9ce8e51f3, pid=30080, tid=20684
#
# JRE version: Java(TM) SE Runtime Environment (17.0.4.1+1) (build 17.0.4.1+1-LTS-2)
# Java VM: Java HotSpot(TM) 64-Bit Server VM (17.0.4.1+1-LTS-2, mixed mode, sharing, tiered, compressed oops, compressed class ptrs, g1 gc, windows-amd64)
# Problematic frame:
# V  [jvm.dll+0x7a51f3]
#
# No core dump will be written. Minidumps are not enabled by default on client versions of Windows
#
# If you would like to submit a bug report, please visit:
#   https://bugreport.java.com/bugreport/crash.jsp
#
This header section contains a summary of the crash. The line below shows that the JVM crashed on a memory access violation, where the JVM attempted to read from or write to an invalid memory address:
EXCEPTION_ACCESS_VIOLATION (0xc0000005) at pc=0x00007ff9ce8e51f3, pid=30080, tid=20684
The logs show the problematic frame as V [jvm.dll+0x7a51f3]. The JVM has stack memory for storing program instructions and method arguments. The stack is divided into blocks of memory called frames. A frame, also known as a stack frame, is a fixed-size block of memory used for organizing and managing data like function calls, pointers, temporary variables, and function arguments. V represents the VM frame type, while [jvm.dll+0x7a51f3] points to the specific location where the crash occurred in the JVM.
Please refer to the Java troubleshooting guide https://docs.oracle.com/en/java/javase/11/troubleshoot/fatal-error-log.html#GUID-DDFA3BD4-49F6-44EC-AD22-F7B93463D1F9:~:text=Table%20A%2D3%20Frame,including%20compiled%20Java%20frames for information about other frame types.
The header section also contains information about the Java Runtime Environment (JRE) and the Java Development Kit (JDK) used to run the code. This information allows you to evaluate your JDK and JRE versions for any known bugs. If you encounter a JVM crash, you may want to check Java support groups for any known failures of your JVM version to see if they align with what you are currently experiencing.
The header section of the fatal error log also contains a subsection titled "SUMMARY." This subsection contains information about the system on which the JVM runs and the command line arguments that were used to start the JVM. From what you see here, no extra command line argument may have caused the crash. For security, some information about the computer used in the example has been hidden in the log below:
---------------  S U M M A R Y ------------

Command Line: -javaagent:C:\Program Files\JetBrains\IntelliJ IDEA
2022.2.1\lib\idea_rt.jar=61279:C:\Program Files\JetBrains\IntelliJ IDEA 2022.2.1\bin -Dfile.encoding=UTF-8 Crash
Host: 11th Gen Intel(R) Core(TM) i7-1195G7 @ xxxxGHz, x cores, xG,  Windows x , 64 bit Build xxxxx (10.xxxxx.xxxx)
Time: Sat May 27 04:46:07 2023 W. Central Africa Standard Time elapsed time: 0.305197 seconds (0d 0h 0m 0s)
The thread section contains information about the thread in which the crash occurred:
---------------  T H R E A D  ---------------

Current thread (0x000001b3e279a2f0):  JavaThread "main" [_thread_in_vm, id=20684, stack(0x000000308e300000,0x000000308e400000)]
Stack: [0x000000308e300000,0x000000308e400000],  sp=0x000000308e3fef00,  free space=1019k
Native frames: (J=compiled Java code, j=interpreted, Vv=VM code, C=native code)
V  [jvm.dll+0x7a51f3]
C  0x000001b3ea01d621

Java frames: (J=compiled Java code, j=interpreted, Vv=VM code)
j  jdk.internal.misc.Unsafe.getLong(Ljava/lang/Object;J)J+0 java.base@17.0.4.1
j  jdk.internal.misc.Unsafe.getAddress(Ljava/lang/Object;J)J+20 java.base@17.0.4.1
j  jdk.internal.misc.Unsafe.getAddress(J)J+3 java.base@17.0.4.1
j  sun.misc.Unsafe.getAddress(J)J+4 jdk.unsupported@17.0.4.1
j  Crash.main([Ljava/lang/String;)V+32
v  ~StubRoutines::call_stub

siginfo: EXCEPTION_ACCESS_VIOLATION (0xc0000005), reading address 0x0000000000000000
Information about the failed thread is available in the following excerpt:
Current thread (0x000001b3e279a2f0): JavaThread "main" [_thread_in_vm, id=20684, stack(0x000000308e300000,0x000000308e400000)]
From the above log:
0x000001b3e279a2f0 is the pointer to the threadJavaThread_thread_in_vm indicates that the thread is running in the VMid=20684 indicates the ID of the threadstack(0x000000308e300000,0x000000308e400000) indicates the stackYou can find more information about thread components in Oracle's documentation.
The thread information also contains details about the stack trace of the Java code leading up to the crash. In the example, the stack trace includes both compiled and interpreted Java code:
V  [jvm.dll+0x7a51f3]
C  0x000001b3ea01d621
The above lines indicate the presence of native frames, suggesting that the crash might be related to native code or interactions with the underlying system
Furthermore, the thread section also gives information about the signal that caused the JVM to terminate:
siginfo: EXCEPTION_ACCESS_VIOLATION (0xc0000005), reading address 0x0000000000000000
The signal indicates that the violation occurred while attempting to read from the memory address 0x0000000000000000.
Based on this information, the JVM crashed due to an EXCEPTION_ACCESS_VIOLATION, indicating a memory access issue. The crash occurred at the stack frame where the instruction to read from address 0x0000000000000000 was executed by the JVM.
It's important to note that JVM system crashes can result from different causes. To effectively identify and address the root causes, it may be necessary to conduct a thorough analysis as well as monitoring and profiling of the specific crash scenarios. Consulting the documentation and support resources provided by the JVM vendor is also advisable.
Nevertheless, there are a few steps you can take to potentially resolve or avoid JVM crashes.
Keeping your JVM updated with the latest version is essential. JVM updates often include bug fixes, performance improvements, and security patches that can help prevent crashes. Regularly check for updates provided by the JVM vendor and apply them as necessary.
The heap size should be configured, taking the memory capacity of the host system into consideration. If the Java heap specified by the JVM is larger than the memory allocated by the host system, the JVM might not start or run out of virtual memory. This is because the host system does not have enough memory to perform operations like loading native libraries into memory, bytecode optimization, and compilation, which must be performed before the JVM starts. On the other hand, if the program requires more heap memory than is allocated, it is most likely to encounter an out-of-memory error because it does not have enough space to store objects created during your program’s execution.
Therefore, you must consider the specific case and consult your JVM’s documentation and guidelines for managing heap memory. Application monitoring platforms like Site24x7's Application Monitoring platform can also help you monitor and profile your application’s memory usage, providing you with insights into the current heap usage, object allocations, and potential memory leaks that can happen on your application.
If the JVM exceeds the maximum virtual memory available, it may crash. To avoid this, you can increase the maximum virtual memory of the system, which will provide more resources for the JVM to operate. You can do this by adjusting the system settings or configurations specific to the operating system.
It's essential to identify and fix memory leaks to prevent your system from crashing due to running out of memory. These leaks happen when objects are not properly released, causing memory usage to increase constantly. To address this issue, carefully review your code for any potential memory leaks and release resources correctly. It's also essential to use effective memory management techniques and ensure proper management of object lifecycles. Application monitoring tools like Site24x7 APM Insight can help you monitor your Java application's memory usage in real time.
The JVM uses a stack to keep track of method calls and local variables. If the stack size is too small and the program exceeds its limits, it can result in a JVM crash. Increasing the stack size can help prevent stack overflow errors and crashes. You can achieve this by adjusting the JVM configuration parameter -Xss (stack size) to a larger value.
If your code is inefficient or not optimized properly, it can cause the JVM to crash. Therefore, you need to identify the areas where your code is not performing well and optimize them. This involves improving your algorithms, reducing object creation, enhancing I/O operations, and using caching techniques to reduce resource consumption and improve performance.
The guide provided tips and guidelines to help you effectively identify and resolve system crashes, leading to more stable and reliable Java applications.
Furthermore, with Site24x7's Application Monitoring platform, you can effortlessly monitor your websites, servers, applications, and network infrastructure through a comprehensive and easy-to-use platform. Site24x7 offers a range of robust features and proactive monitoring capabilities to ensure that your website performs smoothly and delivers a top-notch user experience.
Site24x7's APM Insight provides real-time JVM metrics, including thread utilization and heap memory usage, helping you quickly identify the root causes of crashes like OutOfMemory errors.
Yes, Site24x7 monitors Java application memory usage in real time, allowing you to track current heap usage, object allocations, and identify potential memory leaks before they cause a crash.
Site24x7 monitors the number of active threads in the JVM, offering insights into thread pool management and sending alerts on potential thread-related issues such as thread contention or deadlocks.