Comprehensive Juniper monitoring from the cloud
Automatically discover the devices and monitor your whole network with detailed stats on the status, availability, and performance of every Juniper router, switch and firewall. Simply connect to your devices' SNMP MIBs to get started. Track the traffic of any device at the interface level and monitor all the key performance metrics for effective monitoring.
With over 10,000 default device templates, monitoring is very comprehensive and easy. Stay on top of outages with instant alerts on your mobile device for complete Juniper network management.
Monitor Juniper firewalls and other network appliances for a complete virtual private network (VPN) monitoring.
SNMP-based Juniper performance monitoring
Bandwidth Metrics
- Big buffer hits
- Big buffer misses
- Buffer create failures
- Buffer failures
- Buffer utilization
- Drop events statistics
- Medium buffer hits
- Medium buffer misses
- Open socket (s)
- Outbound counters
- Outbound counters for non-ATM
- Small buffer hits
- Small buffer misses
- Total huge buffer hits
- Total huge buffer misses
- Total large buffer hits
- Total large buffer misses
- Total number of collisions
CPU Metrics
- Component operating status
- CPU load
- CPU usage (one-minute average)
- CPU usage (five-minute average)
- CPU usage (five-second average)
- CPU utilization
- CPU utilization (Last one minute)
- CPU utilization (Last 15 minutes)
- CPU utilization (Last five minutes)
- CPU utilization (WLC)
- Firewall CPU utilization
- FRU state
- Switch CPU utilization (five-minute average)
Interface Metrics
- Aborted interfaces in packets
- Backplane utilization
- Ignored interface (s) in packets
- Input packet drops
- Interface collisions
- Interface in CRC errors
- Interface in giants
- Interface in runts
- Interface input bits
- Interface output bits
- Interface reset count
Memory Metrics
- Disk utilization
- DRAM size
- Free 1550K buffers
- Free 256K buffers
- Free 4K buffers
- Free 80K buffers
- Free memory
- Jabber packets
- Largest free memory
- Memory utilization
- Memory utilization (WLC)
- Number of fragments
- Output packet drops
- Output queue size
- Packets received
- Packets to BC address
- Packets to MC address
- Rate of tail dropped packets
- Router memory utilization
- Switch memory utilization
- Tunnel in-drop packets
- Tunnel in-octet
- Tunnel in-packets
- Tunnel out-drop packets
- Tunnel out-octet
- Tunnel out-packets
- Undersized packets
- Used memory
Other Metrics
- Active session count
- Associated mobile stations
- Associated mobile user (s)
- Average delay
- Component operating temperature
- IronPort temperature
- Juniper temperature
- Label switched path state
- LSP utilization
- Mail transfer threads
- Outstanding DNS requests
- Oversized packets
- Pending DNS requests
- Redundancy switchover
- RSS session failure count
- RSS session count
- Temperature (WLC)
- Total number of octets
Out-of-the-box support for Juniper devices
In addition to supporting the following Juniper Devices, you can monitor 'n' number of them by creating custom device templates.
Firewalls
- Juniper IDP8200
- Juniper JNX FiltersAndPoliciers
- Juniper MAG6611
- Juniper NetScreen Series
- Juniper SA Series
- Juniper SRX Series
- Juniper SSG Series
- Juniper SSL Series
- Juniper juniSsx Series
- Juniper netscreenNs Series
- Juniper usSrx
Routers
- Juniper ACXxx00
- Juniper E Series
- Juniper ERX Series
- Juniper Ericsson-GGSN
- Juniper J Series
- Juniper M Series
- Juniper MX Series
- Juniper SRX Series
- Juniper SSX Series
- Juniper Txx00
- Juniper TX Series
Switches
- Juniper ChassisEX Series
- Juniper EX Series
- Juniper QFX Series
- Juniper Redline-EX3200
- Juniper VariationEX8xxx
Wireless devices
- Juniper ISM200WXC
- Juniper WX Series
- Juniper WXC Series
Others
- Load balancer
Juniper WXC-2600
- Server
Juniper SR-20
- Unified Computing System (UCS)
Juniper CTP 2024
How Site24x7 monitors Juniper devices?
- Automatically discovers SNMP devices by connecting to its MIB.
- Chooses from over 10,000 default templates or allows you to customize based on your requirements.
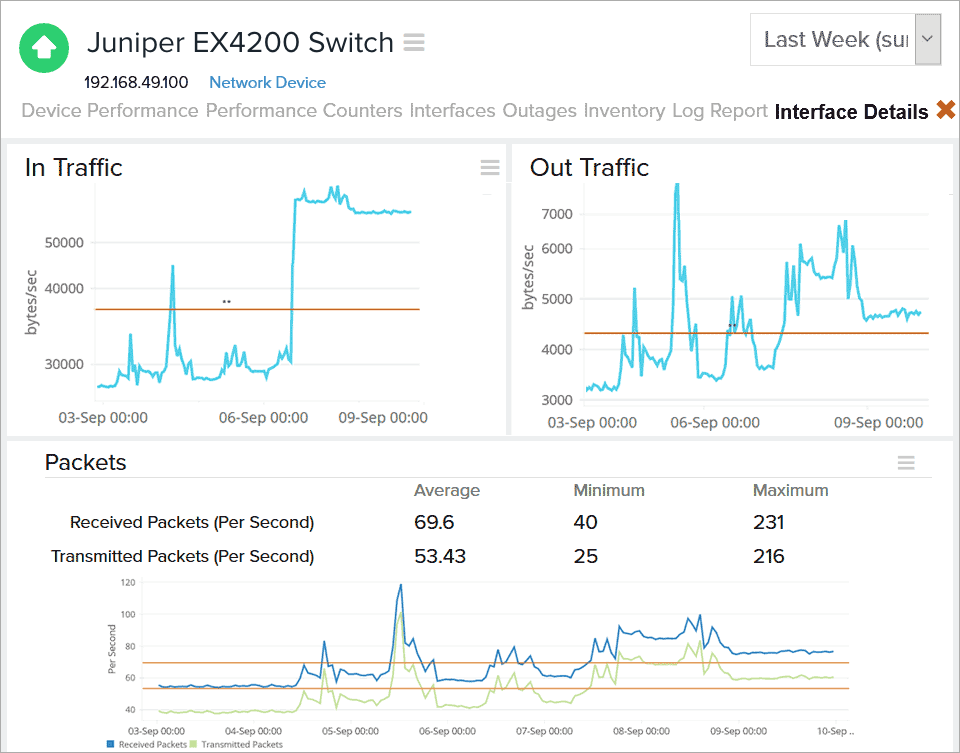
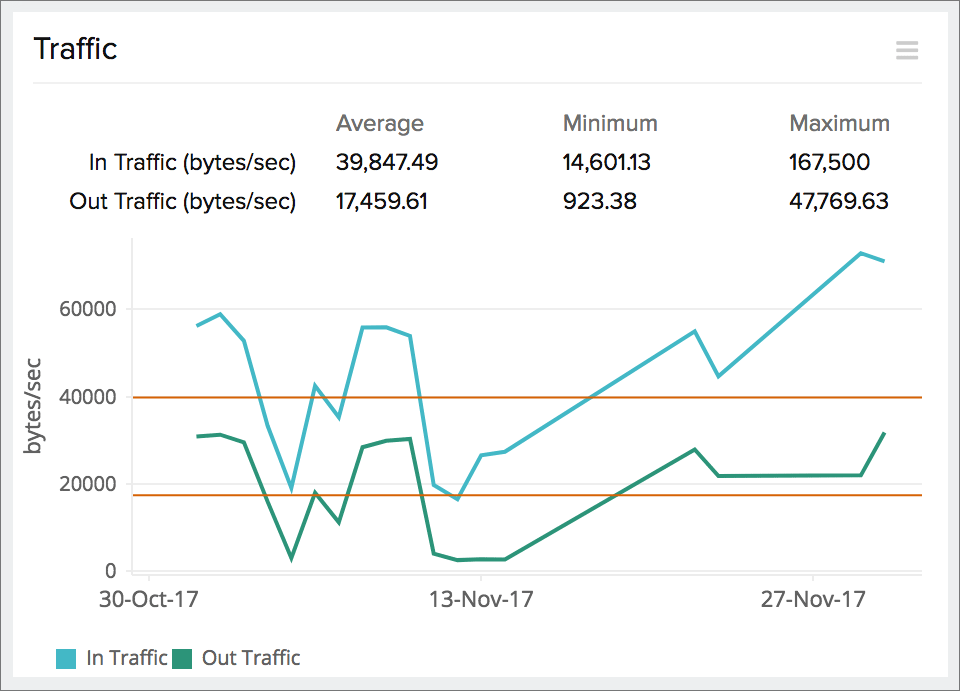
- Thoroughly monitors key metrics at the interface level.
- Allows you to add over 100 performance counters of your choice.
- Sends processed SNMP trap messages from your devices.
- Creates layer 2 maps and topology maps.
- Sends prompt alerts about downtime.
- Displays graphs of key performance stats.
- Generates predefined and customizable reports.
Get more than just performance data
Scalability
Scales to monitor thousands of network devices
Network Discovery
Add multiple devices at once using an IP range
Alerts and Reports
Get timely downtime alerts, and view reports with graphs
High Availability
Ensure high network availability by optimizing bandwidth allocation