| |
April 2025 |

 Product highlights
|
Stay ahead of configuration changes with the Kubernetes Change Tracker
Unexpected configuration changes can lead to performance issues, security risks, and compliance violations. Site24x7's Kubernetes Change Tracker provides real-time visibility into YAML modifications, helping you quickly identify changes, compare versions, and maintain cluster stability. Detect unauthorized updates, troubleshoot faster, and ensure seamless deployments—before issues impact your applications. |
|
Enhance the user experience with RUM Session Replay
Session Replay lets you visually replay real user sessions on your website. Understand user journeys, troubleshoot issues faster, and optimize your application by seeing exactly how users interact with your site—from clicks and scrolls to errors and performance bottlenecks. |
|
Monitor PHP apps on Azure Web Apps
Easily install the APM Insight PHP agent in an Azure Web App and gain code-level visibility and performance insights with minimal manual configuration. |
|
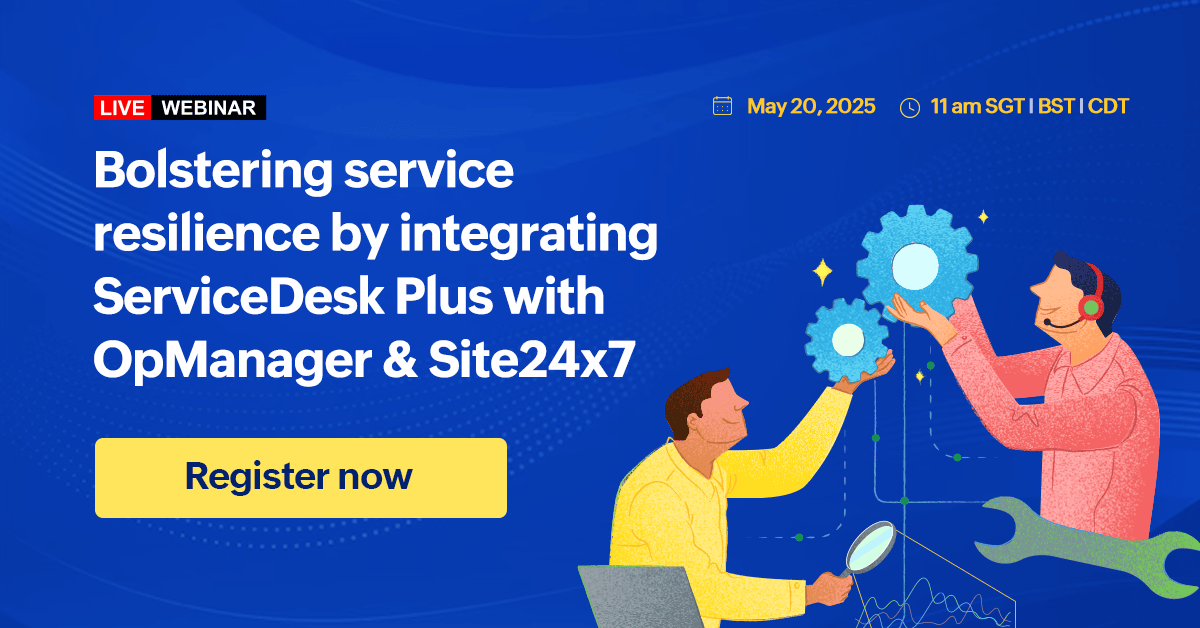
Streamline your ITSM with Site24x7's latest integrations with the CMDBs in ServiceDeskPlus Cloud and ServiceNow!
Manage your incidents and configuration data more efficiently with these powerful integration updates: |
|
|
Log Tagging: Organize, search, and monitor logs with ease
Finding important log entries shouldn't be difficult. Log Tagging helps you categorize logs automatically, making it easier to search, filter, and track key events. Detect sensitive data, monitor security threats, and set up alerts effortlessly—ensuring better visibility and faster response. |
|
Free disk space monitoring in Google Cloud SQL
This feature enables proactive tracking of available disk space in Cloud SQL instances, helping to prevent downtime caused by storage limitations. It provides insights into storage trends and generates recommendations to optimize disk usage, such as enabling auto-growth or manually increasing storage capacity. With this, you can ensure seamless database performance and reliability. |
|
Application-pool-level monitoring with Microsoft IIS monitoring
Be aware of the load on every single application pool in your Microsoft IIS setup with our built-in IIS server monitoring capabilities. With business-critical metrics like processor time, thread count, and memory and I/O metrics for each application pool, keep your application pools healthy, which will keep your sites healthy. And the best part? Onboarding is touch-free. Our server monitoring agent monitors your IIS servers automatically without demanding you to spend time and effort. |
|
Slow disks cause slow applications—not anymore with disk latency monitoring
Performance bottlenecks are hard to pinpoint in enterprise-grade IT infrastructures. With Site24x7's server monitoring agent, you can now monitor your server disks' read latency and write latency, which could indicate performance bottlenecks and impending hardware failures. |
|
Manually updating Key Vault monitors? Not anymore with auto-discovery
Managing secrets, certificates, and keys in dynamic cloud environments is no easy task. With Site24x7's Azure Key Vault monitoring, you can now automatically discover all Key Vault components—no manual configuration needed. Stay ahead of expirations, gain complete visibility, and ensure your vault's health and security with ease. |
|
|
Optimize PostgreSQL performance effortlessly with the new Health dashboard
Boost PostgreSQL performance by instantly spotting slow queries, connection overloads, and deadlocks with the latest PostgreSQL Health dashboard. Identify top instances and databases needing attention and make faster, data-driven decisions with visual insights. No more guesswork—just clear, actionable metrics to keep your PostgreSQL environment healthy. |
|
Monitor your Pacemaker cluster environments
Enhance your Pacemaker cluster management with the Pacemaker cluster monitoring plugin. This plugin tracks node health, resource status, service operations, and quorum metrics to help ensure everything runs smoothly. With real-time alerts and a unified dashboard, you can quickly detect issues, simplify cluster operations, and improve fault tolerance. |
|
Uncover hidden UX issues with RUM Events
RUM Events give you deep insights into how real users interact with your website—beyond just load times and response rates. Track behavioral patterns like dead clicks, rage clicks, quick backs, excessive scrolling, and custom events to uncover usability problems and friction points in your web app. Use the Events Query feature for advanced filtering and custom analysis. |
 Free tools
|
XML to XSD
Convert your XML files into XSD schemas effortlessly to validate data structure, ensure compliance, and accelerate development with accurate, reusable definitions tailored to your data. |
|
XML to JSON
Transform XML into JSON to make your data lighter and easier to work with in JavaScript environments and better suited for APIs and modern web services. |
 Featured articles
- Bridging the gap between DevOps and business goals through APM
- Mastering MySQL Connection Pooling: Why monitoring matters
- Monitoring for Kubernetes API server performance lags
- Website monitoring checklist
- Common Google Cloud deployment issues and solutions
- When to use Azure Container Apps vs Azure Kubernetes Service
- Troubleshooting trigger-related errors in Azure Functions
- A complete guide to monitoring cross-platform apps using APM
 Sneak Peek
-
Define custom roles to tailor user access
Customize granular permissions for users to control access to monitors, features, and sensitive actions, along with operational restrictions like View, Write, and Delete, using custom roles in user management.
-
Gain complete control over Azure backup with Veeam
Get comprehensive oversight into your Azure backup environment with Veeam Azure backup monitoring. Gain visibility into the health, performance, and guaranteed data protection across your Azure ecosystem.
-
Explore app interactions with Site24x7's Flow Map
Explore your APM infrastructure effortlessly with Site24x7's Flow Map, offering a comprehensive overview of application connections and external components.
| Training Program • Product Demo • Subscribe to Newsletter | |
|
|
| © 2025. Site24x7 is a trademark of Zoho Corp. | |
| 4708 HWY 71 E | Del Valle, TX 78617-3216 |