What Is Real User Monitoring (RUM)? The 2026 Guide
Real User Monitoring (RUM), also known as passive monitoring, captures performance data from actual users visiting your site. Unlike synthetic testing, RUM shows you exactly how real-world variables—like device type, network speed, and location—impact Core Web Vitals and user experience. This guide covers everything you need to know about RUM, from key metrics to its critical role in SEO.
Explore related topics
Introduction
Real user monitoring enables organizations to make informed decisions to enhance user experience, optimize application performance, and ultimately drive user engagement. It plays a crucial role in ensuring that applications run smoothly for end users, leading to better retention and satisfaction.
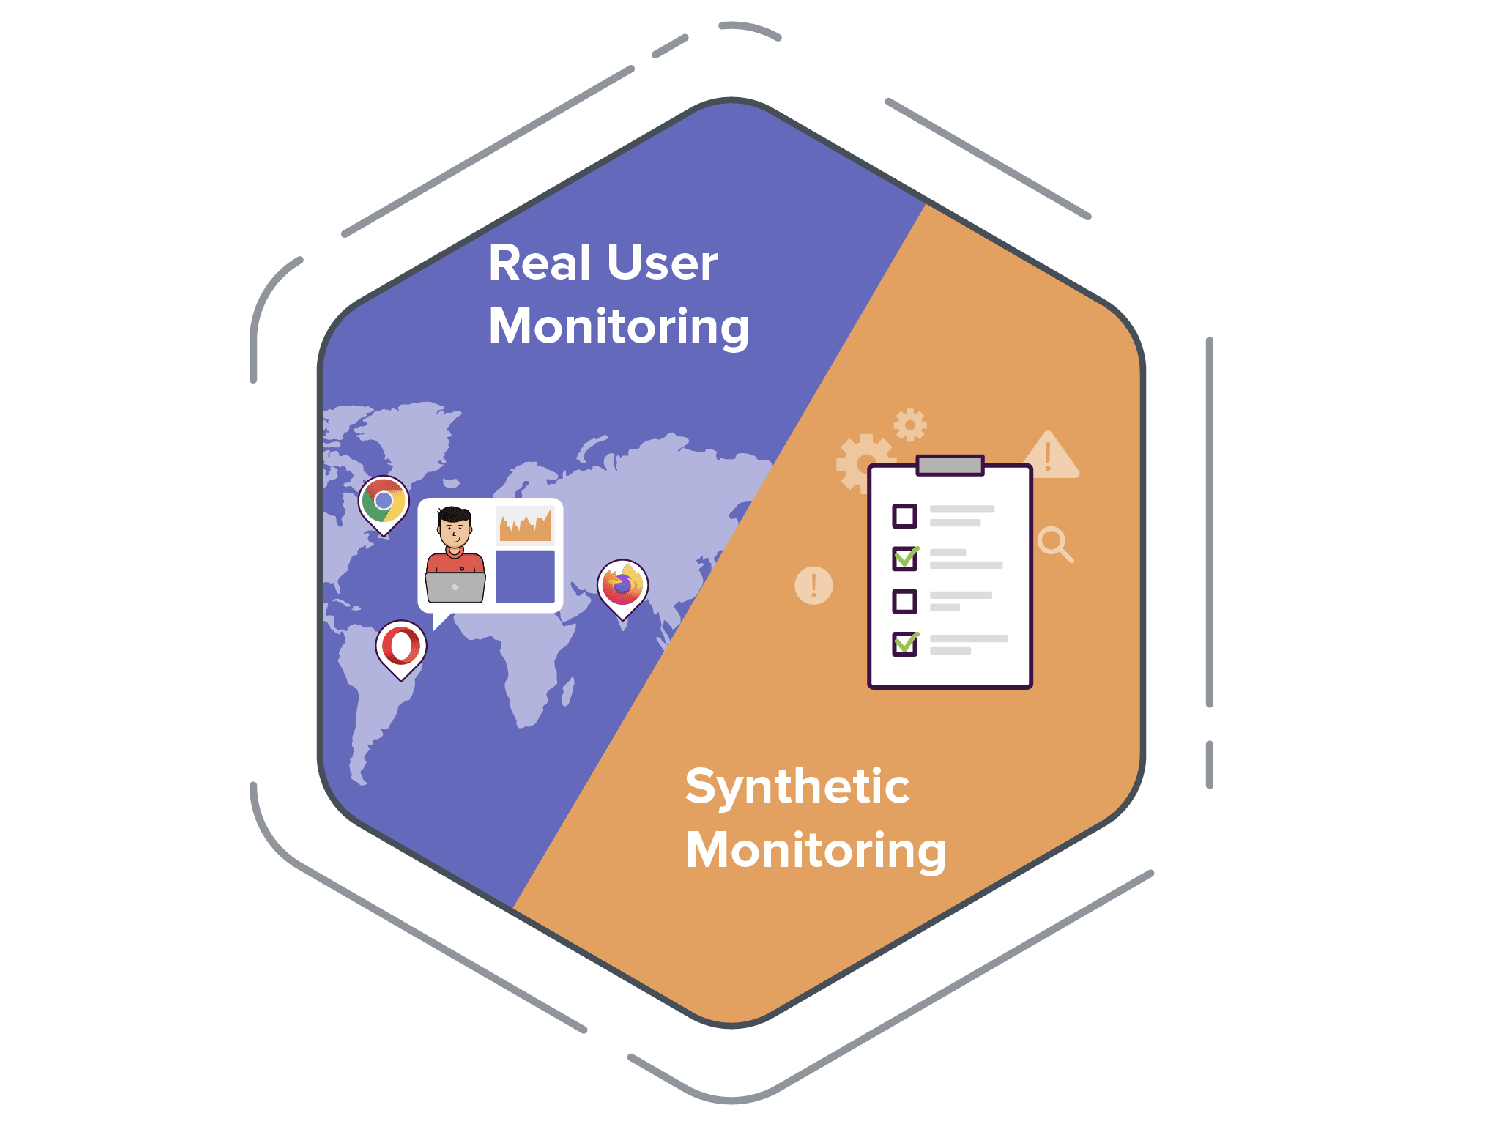
Unlike synthetic monitoring, which simulates user behavior, RUM gathers data directly from actual user sessions, providing a real-time view of how users experience your website or application.
How does real user monitoring work?
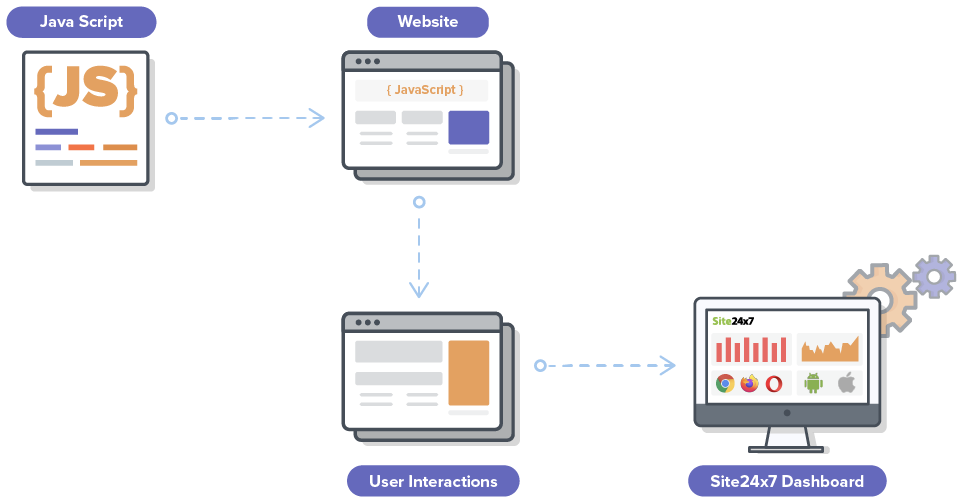
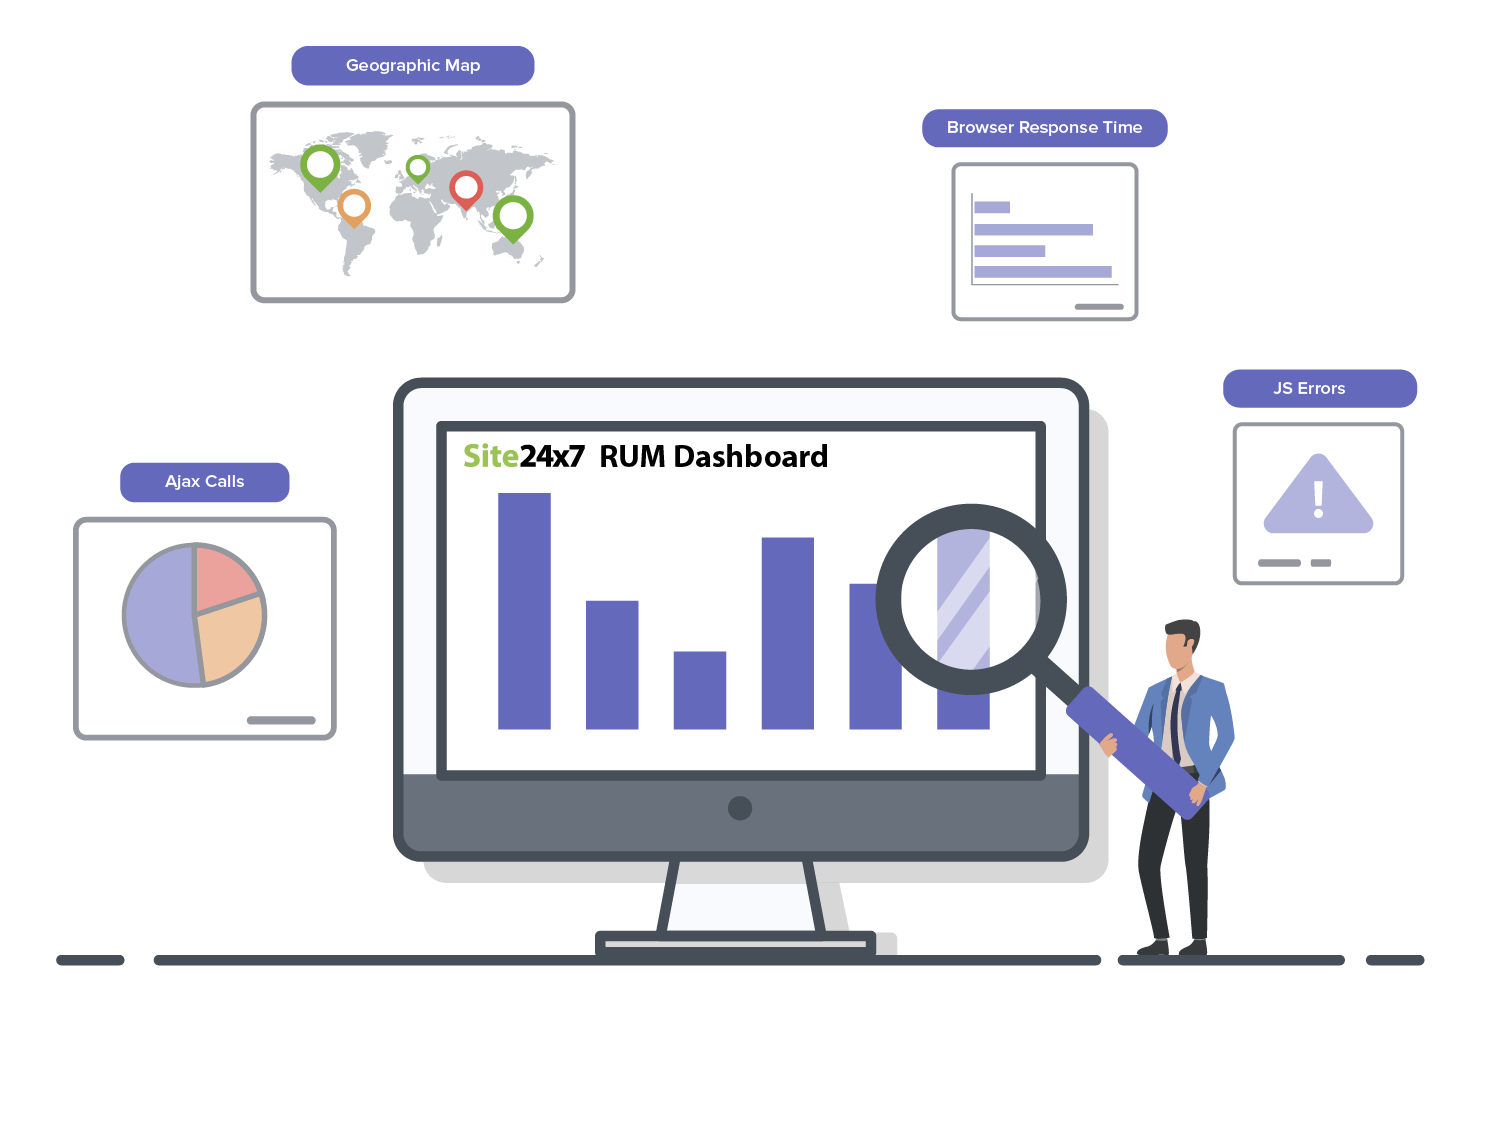
For web applications, a small JavaScript code is injected into the website's header or footer. This script passively captures all performance data as the webpage loads. Metrics like redirection time, JavaScript errors, AJAX calls, DNS lookup time, and network latency are collected and sent to the reporting dashboard.
For native mobile applications (iOS and Android), RUM works differently. Instead of JavaScript, a lightweight SDK (Software Development Kit) is added directly to the application package. This SDK monitors native interactions, app crashes, and screen load times across the diverse landscape of mobile devices and carrier networks.

Key RUM metrics & Core Web Vitals
Modern RUM tools track three main categories of metrics: Core Web Vitals, performance timings, and user engagement data.
- Core Web Vitals (Google's Ranking Signals):
- Largest Contentful Paint (LCP): Measures loading performance. Ideally < 2.5s.
- Interaction to Next Paint (INP): Measures responsiveness. Replaced FID in March 2024. Ideally < 200ms.
- Cumulative Layout Shift (CLS): Measures visual stability. Ideally < 0.1.
- Performance timings:
- Time to First Byte (TTFB): Server responsiveness.
- DNS Lookup & Connection Time: Network latency metrics.
- Page Load Time: Total time to render the full page.
- User Context & Engagement:
- Session Duration & Bounce Rate: How long users stay.
- JavaScript Errors: Console errors that break functionality.
- Device/Browser/Geo: Performance breakdown by segment.
Tracking these metrics in real-time allows you to pinpoint exactly *where* and *why* users are facing issues.
How RUM improves SEO
Since 2021, Google has used Core Web Vitals as a direct ranking factor. However, Google uses "Field Data" (data from real Chrome users) to determine your score, not lab data.
This is why RUM is critical for SEO:
- See what Google sees: RUM tools collect the exact same field data (CrUX) that Google uses to rank you.
- Fix mobile issues: Google uses mobile-first indexing. RUM shows you exactly how mobile users experience your site (4G vs 5G, older phones).
- Reduce bounce rate: Faster sites keep users longer. Dwell time and bounce rate are indirect SEO signals that RUM helps you optimize.
RUM vs. synthetic monitoring
RUM and synthetic monitoring are both used to assess application performance, but they employ different data collection methods and provide unique insights.
| RUM | Synthetic monitoring | |
|---|---|---|
| How it collects data | Monitors actual user interactions. | Simulates user interactions. |
| What it's best for | Understanding long-term trends. | Identifying and addressing short-term performance issues. |
| Benefits | Captures performance across devices, browsers, networks, and geographic locations. | Can be used to monitor at every stage of development in a controlled environment. |
| Considerations | Requires traffic for generating data. | Challenging to assess all the unpredictable factors that influence situations in real time. |
Together, RUM and synthetic monitoring track a variety of metrics that identify potential patterns and anomalies, providing crucial insights for analyzing the digital experience of users. When combined with an application performance monitoring (APM) tool, you can gain full visibility of your application's performance across the entire stack.

A guide to digital user experience management
Learn how to combine insights from real user monitoring and synthetic monitoring to ensure the best digital user experience.
Download the free ebook
Advanced real user monitoring capabilities
While basic page load times provide foundational visibility, modern digital businesses require deeper context. Integrating advanced monitoring capabilities ensures a comprehensive understanding of user experience.
Full-stack correlation with a one-click pivot
Frontend performance metrics only tell part of the story. To eliminate team silos and accelerate troubleshooting, organizations must integrate frontend RUM data with backend traces and application logs. A modern RUM tool allows a seamless "one-click pivot" from a slow browser interaction directly to the specific backend trace or database query that caused the bottleneck. Combining this with zero-config auto-instrumentation ensures rapid deployment and comprehensive full-stack observability.
Visual debugging as the standard troubleshooting workflow
Metrics alone cannot fully explain user frustration. Incorporating session replay enables teams to visually reconstruct real user journeys through high-fidelity, video-like recreations. This visual debugging approach instantly identifies specific UI/UX friction points, such as rage clicks, dead clicks, or confusing navigation flows. Session replay is no longer a luxury; it is a core capability for rapidly diagnosing frontend issues that metrics fail to capture.
Business observability and conversion impact
Connecting performance data to actual business outcomes is crucial for prioritizing engineering efforts. By capturing custom user IDs and tracking specific, business-critical actions—such as clicking a "Checkout" button or completing a form—organizations can calculate the direct impact of latency on conversion rates. Advanced RUM tools can visually demonstrate how a 100ms improvement in performance correlates to a percentage increase in revenue, enabling a shift from tracking purely technical metrics to true business observability.
Benefits of real user monitoring
- Real-time insights: RUM provides immediate data on how actual users interact with your application, allowing for quick identification of issues.
- User experience optimization: Analyzing real user behavior helps in identifying areas for improvement, thereby enhancing overall user satisfaction.
- Performance metrics: RUM metrics provides insight into critical elements such as load times, response times, and interaction events, helping teams understand performance from the user's perspective.
- Device and browser analysis: RUM offers insights into how different devices, browsers, and operating systems impact performance, enabling targeted optimizations.
- Identifying bottlenecks: RUM helps detect performance bottlenecks and potential issues that could disrupt the user experience.
- Data-driven decisions: RUM data helps you make informed decisions about application enhancements and resource allocation.
- Business impact analysis: Correlate performance metrics with conversion rates and revenue to prioritize fixes that drive business growth.
- Improved retention and engagement: By enhancing user experience, RUM can lead to higher retention rates and increased user engagement.
- Comprehensive coverage: RUM data is captured from all real user interactions, providing a complete picture of application performance across various conditions.
Why is real user monitoring important?
-
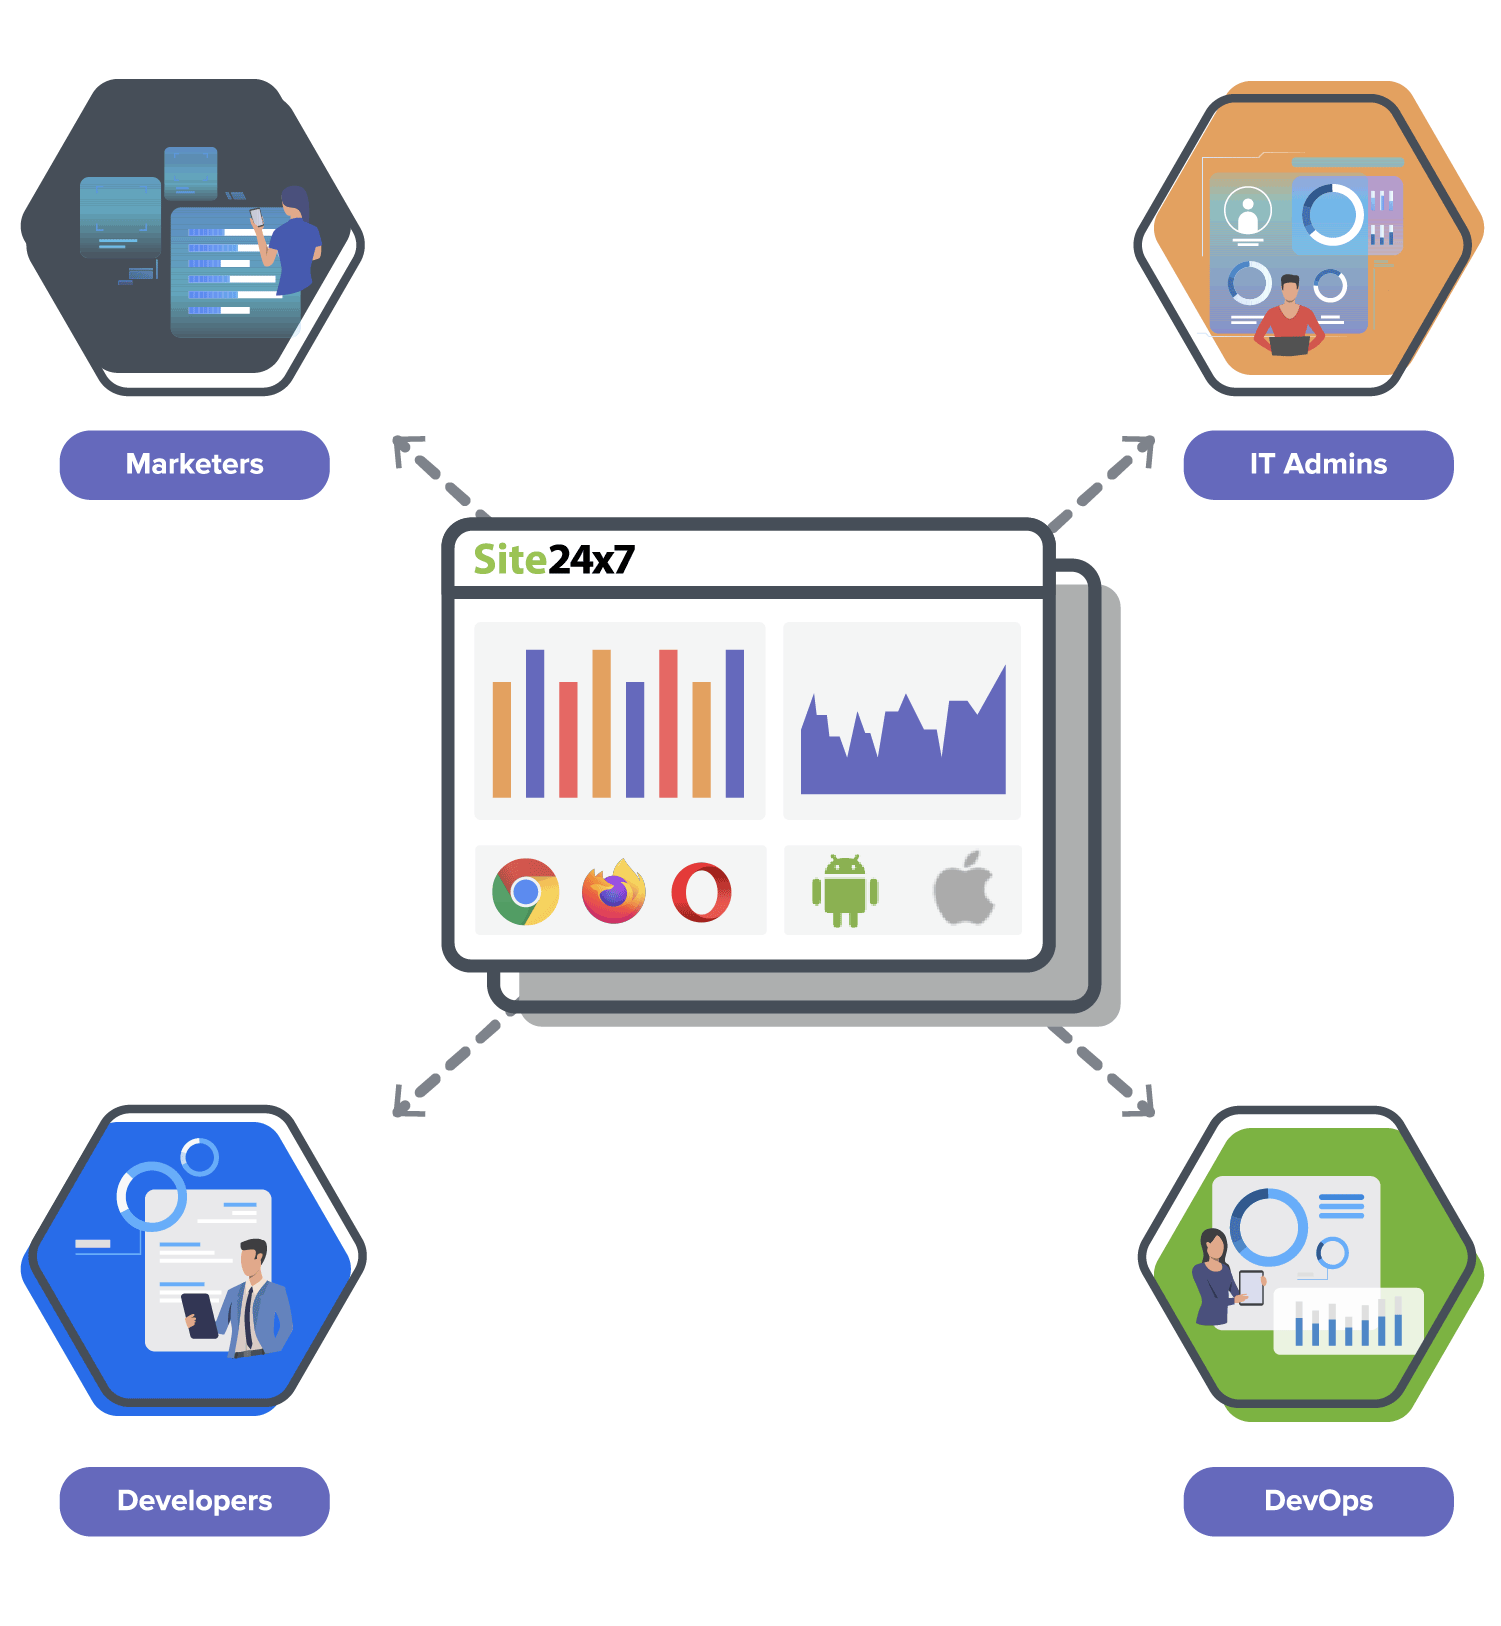
RUM is used by people in various roles, including developers, DevOps, IT admins, and marketers.
-
Monitor the performance of single-page applications (SPAs): Static HTML pages are outdated, and SPAs are the rage these days. Tracking asynchronous calls in SPAs, a crucial task for organizations, can be achieved with RUM.
-
Analyze user sessions: Monitor user journeys and analyze the reasons a user exited or abandoned a page.
-
Identify and eliminate JavaScript errors: Pinpoint the exact URL and line of code where a JavaScript error has occurred. You can also trace the user paths contributing to a specific error and analyze the possible triggers.
-
Analyze webpage performance: Identify response time and throughput for individual webpages, as well as load time for resources like images, CSS, and scripts, and optimize them accordingly.
-
Track browser performance: Certain issues, like JavaScript errors, can be browser-specific. With RUM, you can identify and eliminate them as well.

How to choose a RUM tool
Not all RUM solutions are created equal. When evaluating tools in 2026, look for these three critical capabilities:
- Unified Full-Stack Observability: Frontend lag is often a backend issue. Choose a tool that seamlessly connects RUM data with APM, traces, and logs for end-to-end visibility.
- Session Replay: Metrics tell you that an error occurred; session replay shows you how it happened by reproducing the user's screen interactions.
- AI-Powered Alerts: Static thresholds create noise. Look for tools with AI anomaly detection that learn your traffic baselines and only alert you on genuine anomalies.
- Scalable Data Retention: As your application grows, so does your data. Ensure your RUM solution offers flexible data retention policies to support long-term trend analysis and historical investigations without limits.
Site24x7's RUM tool includes all these features—Core Web Vitals (LCP, INP, CLS) tracking, Session Replay, AI alerts, and scalable retention—in a single platform, helping you optimize every digital journey.
Real user monitoring challenges
Although real user monitoring (RUM) is a powerful tool for tracking end-user experiences, organizations often face several challenges when implementing it effectively. Addressing these challenges ensures accurate insights and optimal performance improvements.
| Challenge | Description | Solution |
|---|---|---|
| Data overload and noise | RUM collects vast amounts of data from real users across different locations, devices, and networks. Without proper filtering and segmentation, teams may struggle to derive meaningful insights from this data deluge. | Use AI-driven anomaly detection and intelligent filtering to focus on critical performance metrics like throughput, front-end time, and error percentage. |
| Identifying the root cause of performance issues | While RUM highlights slow page loads and high bounce rates, pinpointing the exact cause—whether it’s server-side latency, front-end issues, or third-party scripts—can be complex. | Combine RUM with Application performance monitoring (APM) to get a full-stack view of performance bottlenecks. |
| Monitoring multi-device experiences | With users accessing websites and apps from diverse devices and carrier networks, inconsistent performance across platforms can hurt user satisfaction. | Ensure RUM solutions provide granular insights into mobile performance, network conditions, and device compatibility. |
| Correlating performance metrics with business impact | Technical performance metrics like time to first byte (TTFB) and First Contentful Paint (FCP) need to be tied to business KPIs such as conversions and revenue. | Use RUM alongside business analytics by integrating with ITSM tools to correlate performance improvements with increased customer retention and revenue growth. |
RUM best practices
To maximize the value of RUM, businesses should adopt the following best practices:
- Establish business objectives
Align RUM data with quantifiable business goals. For example, aim to reduce abandoned carts by 10% by improving checkout page load time. Use RUM to prioritize technical fixes that impact revenue. - Set performance benchmarks
Define KPIs like page speed, load time, time to interactive, and core web vitals to optimize the user experience. - Segment users for insights
Analyze performance by geography, device, browser, and network for a detailed view. - Monitor third-party dependencies
Track CDNs, payment gateways, and ad networks to prevent slowdowns. - Combine RUM with synthetic monitoring
Use synthetic monitoring to simulate user journeys and detect issues proactively. - Automate alerts and anomaly detection
Set AI-driven alerts to address performance drops before users are affected. - Optimize for mobile and slow networks
Ensure a seamless experience across devices, OS, and network conditions. - Continuously audit and optimize
Regularly test and refine performance to meet evolving web standards.
Who uses real user monitoring?
RUM is used by people in various roles, including developers, DevOps, IT admins, and marketers.
- Developers:
Developers are interested in how an individual webpage loads for different end users. RUM sheds light on the different factors contributing to page load time: network attributes, content downloaded for each user, front-end resources consumed for rendering the downloaded content, platform compatibility, and JavaScript errors.
- DevOps:
DevOps teams are interested in how their infrastructure caters to end users of all sorts. RUM helps DevOps teams determine if a spike in response time can be attributed to expected factors (increase in traffic, poor performance in a particular geography) or to unexpected factors (issues with the ISP or CDN).
- IT admins:
RUM gives IT admins a holistic, granular view of front-end performance, including network latency, errors, and user sessions.
- Marketing:
RUM helps marketers dig deep into performance by geography, identify busy hours, and analyze specific pages of importance.

Sign up for a Site24x7 account to start using RUM
Start 30-day free trial Try now, sign up in 30 secondsExplore Site24x7 solutions
Reach out to us today and let's discuss how we can help you transform your practice.
Website performance monitoring
Web security monitoring
WAN monitoring