Detect and resolve Amazon RDS disk I/O bottlenecks
What is an RDS disk I/O bottleneck?
An I/O bottleneck occurs when a database instance’s read/write demands exceed its provisioned capacity or burstable performance. This can result from various factors, such as inefficient queries or inadequate storage configuration.
Symptoms of I/O bottlenecks
- High read latency and write latency
- Increased DiskQueueDepth
- Slow query performance despite low CPU usage
- High transaction times or timeout issues
Performance specifications and storage baselines
For example, with General Purpose SSD (gp2) storage, the baseline IOPS for 150 GB is 450 and the burst capacity reaches up to 3,000 IOPS (depending on burst balance). This burst duration and capacity depend on the available burst credits .

Best practices for resolving I/O bottlenecks
1. Right-size your storage
Upgrade to gp3 or io1 if your workload needs sustained, high throughput.
2. Optimize queries
Review query plans for inefficiencies, reduce unnecessary scans, and add indexes where necessary.
3. Schedule index maintenance
Rebuild or reorganize indexes to avoid logical I/O inefficiencies.
4. Enable auto minor version upgrades
Ensure your database uses the latest performance improvements and bug fixes.
5. Leverage read replicas
Offload read-heavy workloads to replicas to reduce primary instance I/O pressure.
6. Monitor tempdb and log usage (SQL server)
Manage tempdb and transaction log usage to reduce disk contention.
When to consider redesigning storage
If metrics consistently show:
- Write latency > 10 ms
- DiskQueueDepth > 64
It might be time to scale up storage, switch to a higher-performance instance class, or optimize storage distribution.
Important : These values are general guidelines. Optimal thresholds depend heavily on your specific application workload, instance type, and storage configuration. Establish your own baselines and adjust thresholds accordingly.
Monitoring Amazon RDS with Site24x7
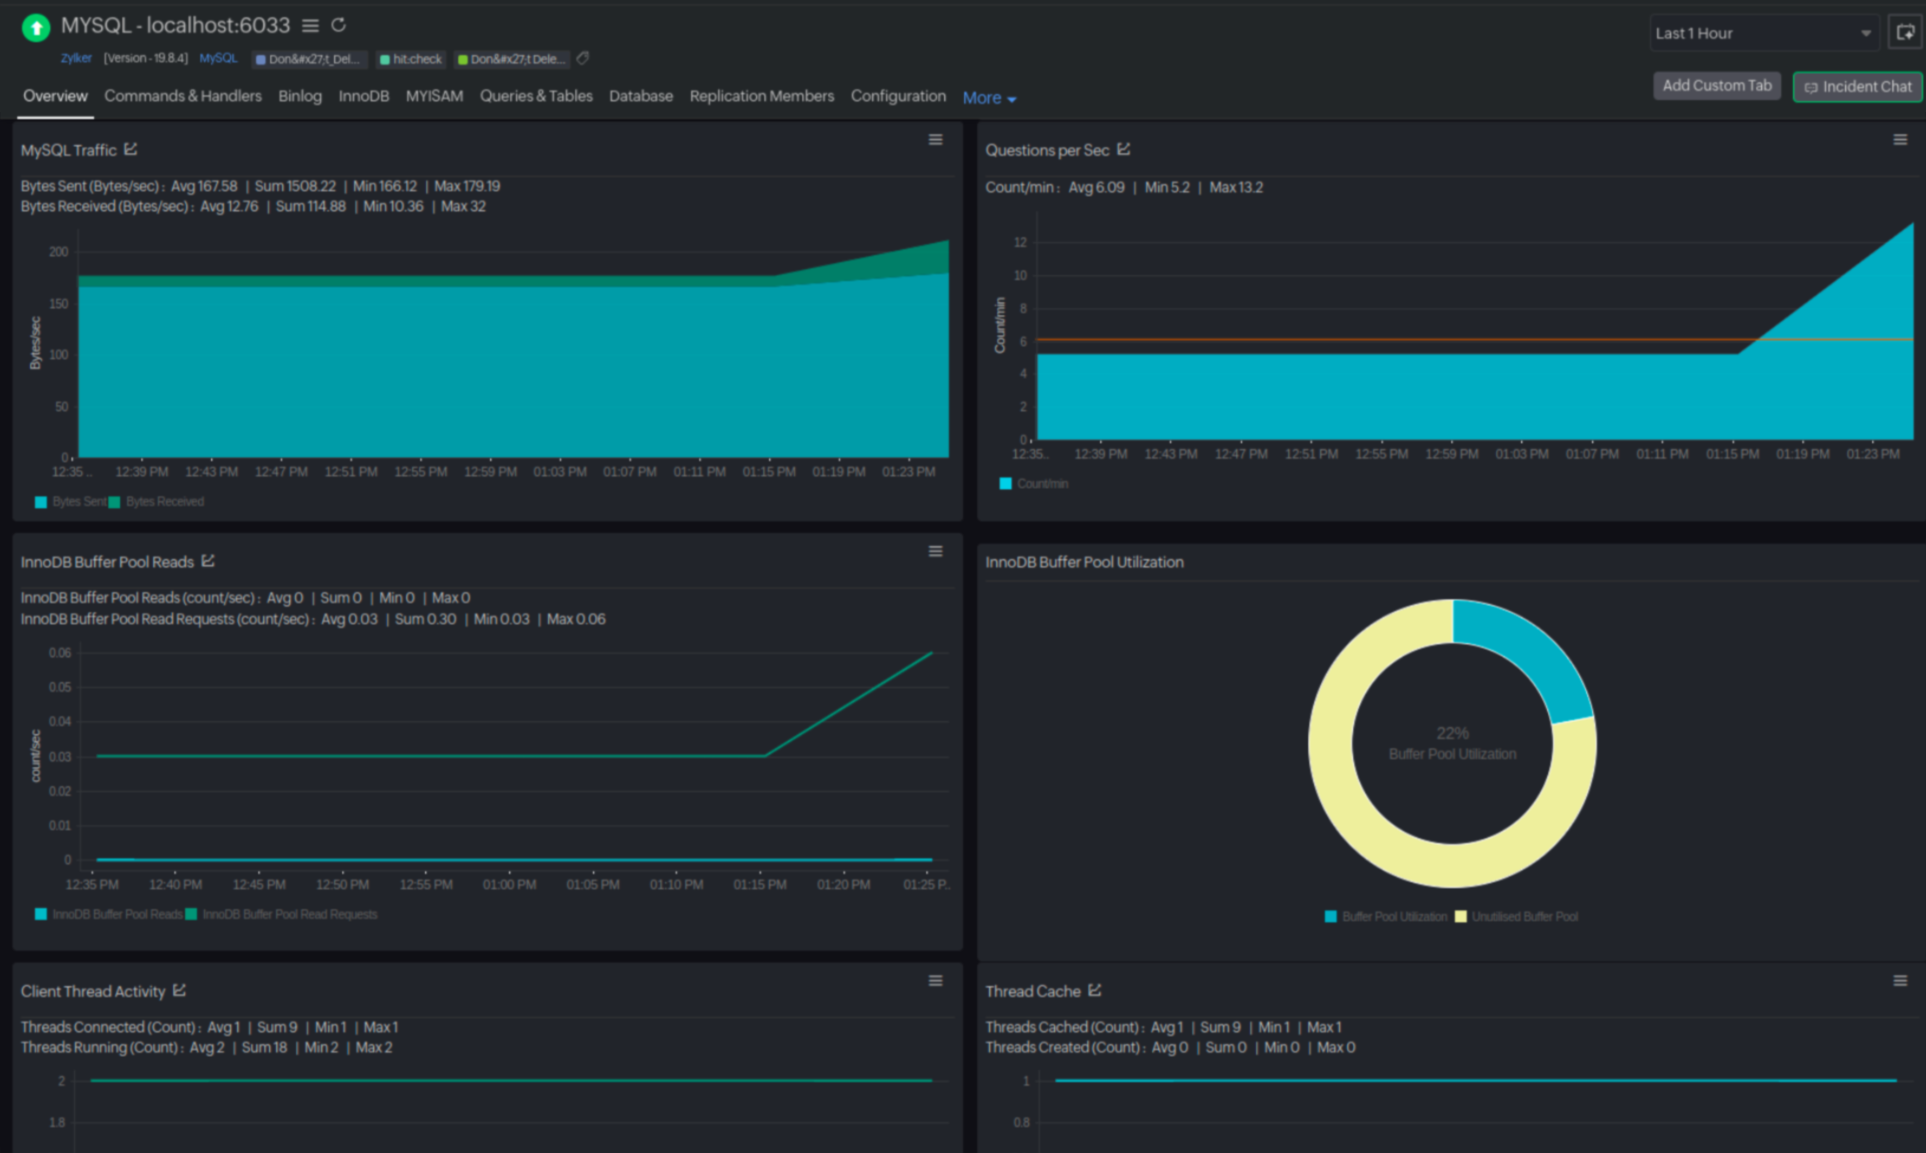
RDS for MySQL monitoring with Site24x7
Site24x7 tracks key MySQL performance metrics like:
- InnoDB buffer pool efficiency : Monitor buffer pool hit ratio and identify when inefficient memory usage causes excess disk reads.
- Slow queries : Identify and optimize slow queries causing high I/O.
- Disk throughput : Track Read Latency, WriteIOPS, and DiskQueueDepth to gauge I/O performance.
Scenario : On the MySQL dashboard, a sustained buffer pool utilization (below 95%) alongside high InnoDB Data Reads indicates the database is frequently reading from disk. Site24x7 allows you to drill down to identify the specific queries causing the most disk I/O, providing you with the insights needed to optimize or rewrite those queries.
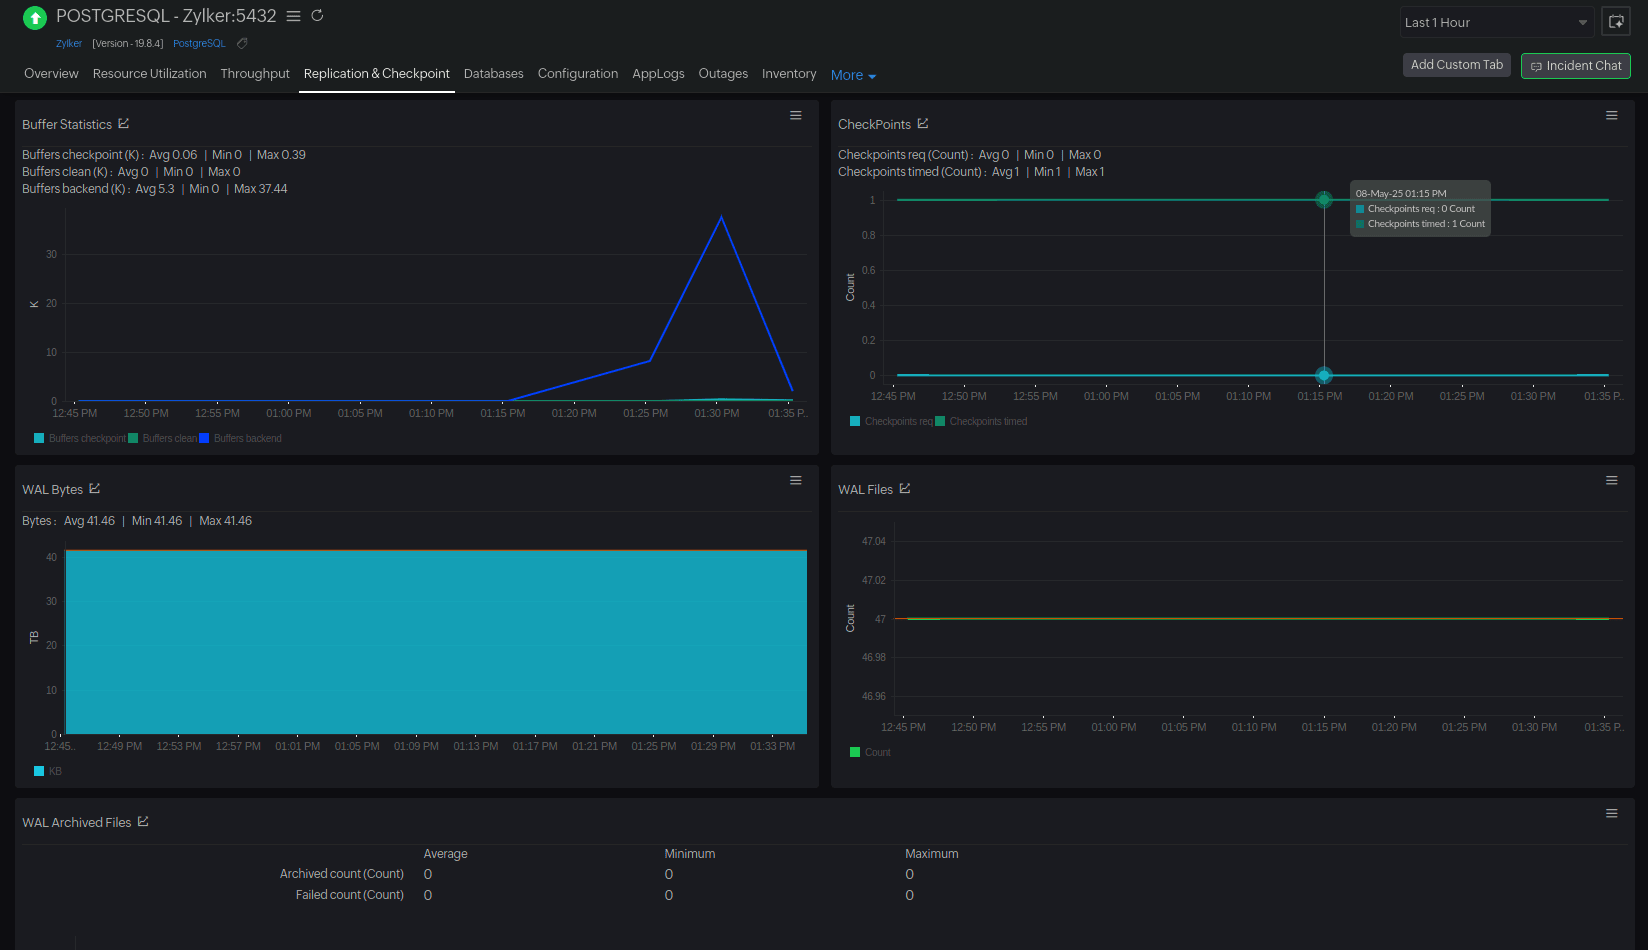
RDS for PostgreSQL monitoring with Site24x7
For PostgreSQL , Site24x7 offers:
- Checkpoint activity : Analyze write behaviors that affect disk throughput.
- Autovacuum performance : Monitor vacuums and tune them to prevent bloated tables that increase I/O.
- Write latency : Track commit latency and correlate it with disk I/O patterns.
Scenario : The PostgreSQL dashboard displays a sudden spike in WAL Bytes, especially when paired with a sharp rise in Updated Rows. This likely indicates that there are write-heavy workloads—such as bulk updates, batch processing, or unoptimized update operations. Site24x7 allows you to spot the spike and alerts you before a potential crash or bottleneck.
AI-Powered anomaly detection and RCA reports
Site24x7 offers AI-powered anomaly detection that flags unusual spikes in I/O latency, correlating them with specific queries.
RCA reports provide a prioritized list of potential root causes, including slow-running queries, resource contention, and configuration issues, along with remediation recommendations.
Final thoughts
Disk I/O bottlenecks in Amazon RDS can be subtle but can significantly degrade database performance. By leveraging AWS tools and Site24x7’s comprehensive monitoring solutions , you can detect and resolve these issues before they impact your workloads. Proactive monitoring, query optimization, and effective storage management are the keys to maintaining a healthy and high-performing Amazon RDS environment.
For end-to-end visibility into your RDS instances—including disk I/O performance, query latency, and resource utilization—consider using Site24x7’s Amazon RDS Monitoring for real-time insights, intelligent alerting, and deep troubleshooting capabilities.