How to overcome Failover Cluster performance issues
In the final portion of our two-part blog on Failover Clusters, we'll utilize a helpful checklist to uncover resolutions for performance and cluster compromise issues, and explore practical solutions provided by ManageEngine Site24x7.
Failover Clusters are advantageous when it comes to maintaining high-availability levels. But they do come with their set of challenges which we have already covered on our blog on the Failover Cluster performance issues.
Read on to discover the checklist for troubleshooting as soon as a failover has occurred and our solution to prevent issues, thereby ensuring maximum availability and optimal performance.
Troubleshooting Failover Cluster performance issues
A failover in a Windows cluster will only occur if there is a genuine problem with one of the cluster's components. The cluster will initiate a basic recovery process, leading to the affected resource failing over to another node due to potential causes like resource failure, networking issues such as node eviction, or Cluster Shared Volume disk failure. As soon as the cluster failover occurs, it is ideal to work on the following checklist immediately.
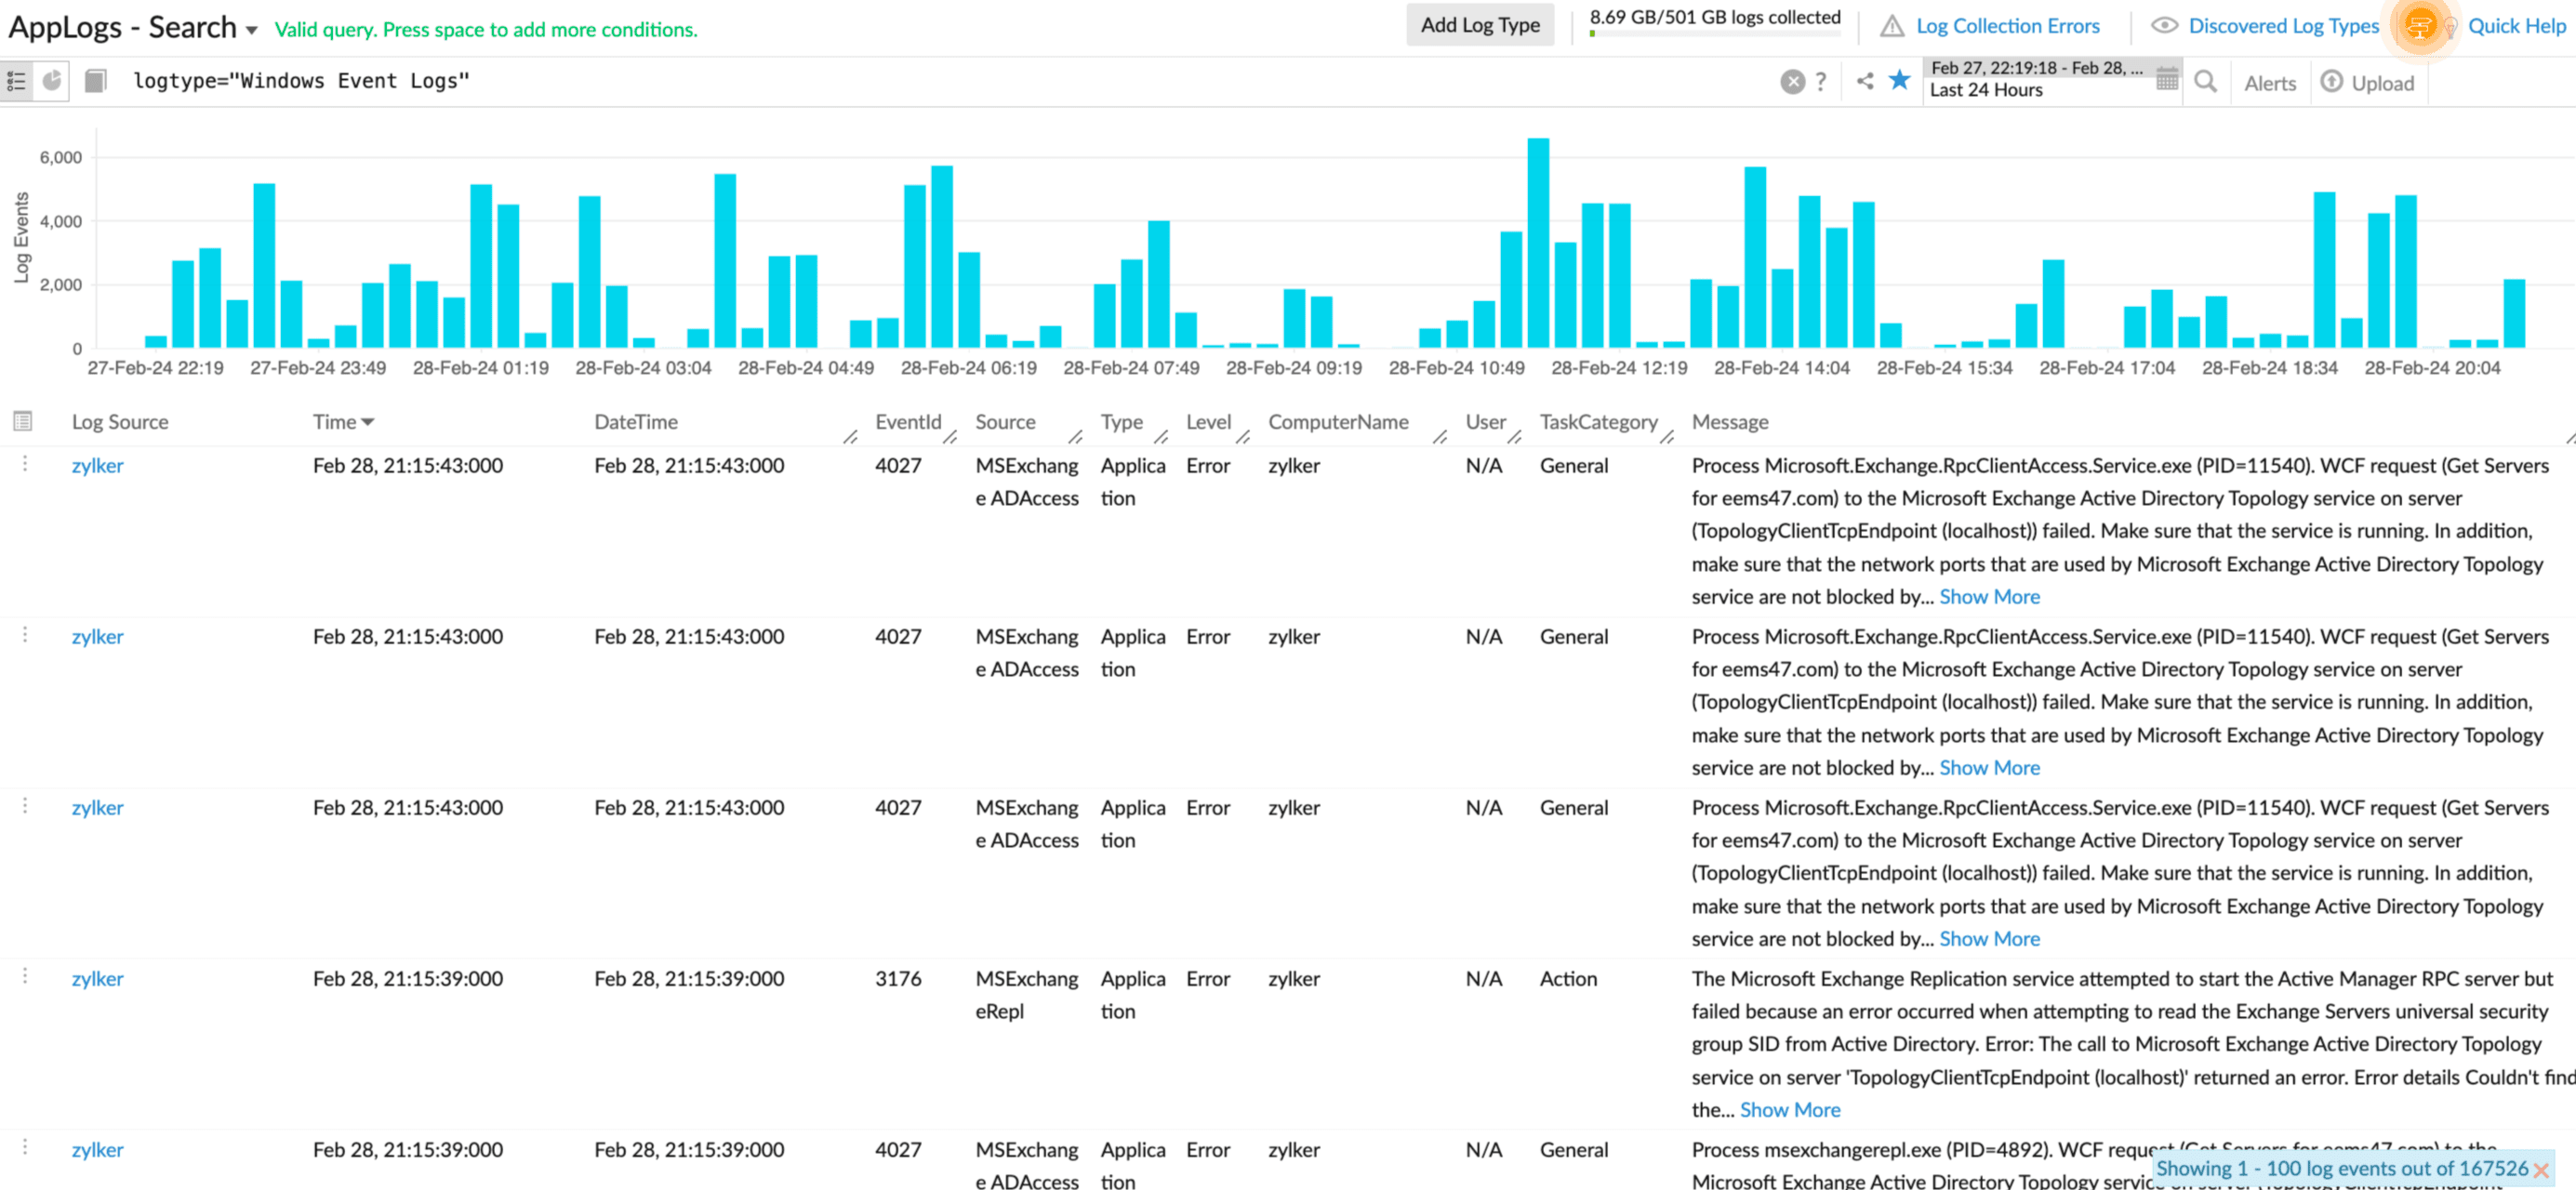
- Troubleshoot issues in the system event log
- Find the timestamp of the occurrence
- Search in the log files for events related to Microsoft-Windows-FailoverClustering
- Review the log for any other potential errors
Exploring these issues will give you an idea of the source or the reason for the failover. After classifying the issue accurately, you will know what actions need to take place to resolve the problem.
The customer base will increase gradually, and the number of transactions and the amount of data processing will amplify. But if your cluster is unable to scale, unforeseen crashes will become inescapable.
How can this be avoided
Would you prefer fixing issues as soon as a node is compromised? Be aware that the entire cluster setup should be manually checked but frequently because a slight delay might result in endangering the operation. It is not impossible, but it can be time-consuming. The best approach is often to proactively detect and prevent problems before they occur. This check can be automated through Failover Cluster monitoring without human efforts and intervention.
A high-performing cluster, if not monitored, can mask hardware or software issues that reduce redundancy. With Site24x7 Windows Failover Cluster monitoring, organizations can receive real-time alerts when a failover has happened, or when a resource group has gone offline, so issues can be spotted and fixed, ensuring all the nodes are active and 100% available 24x7 throughout the year.
Auto-discover all the nodes running in your cluster to get started. Then, you will also know which node is serving now, which resource groups are online and offline, and which application is being served from which node.
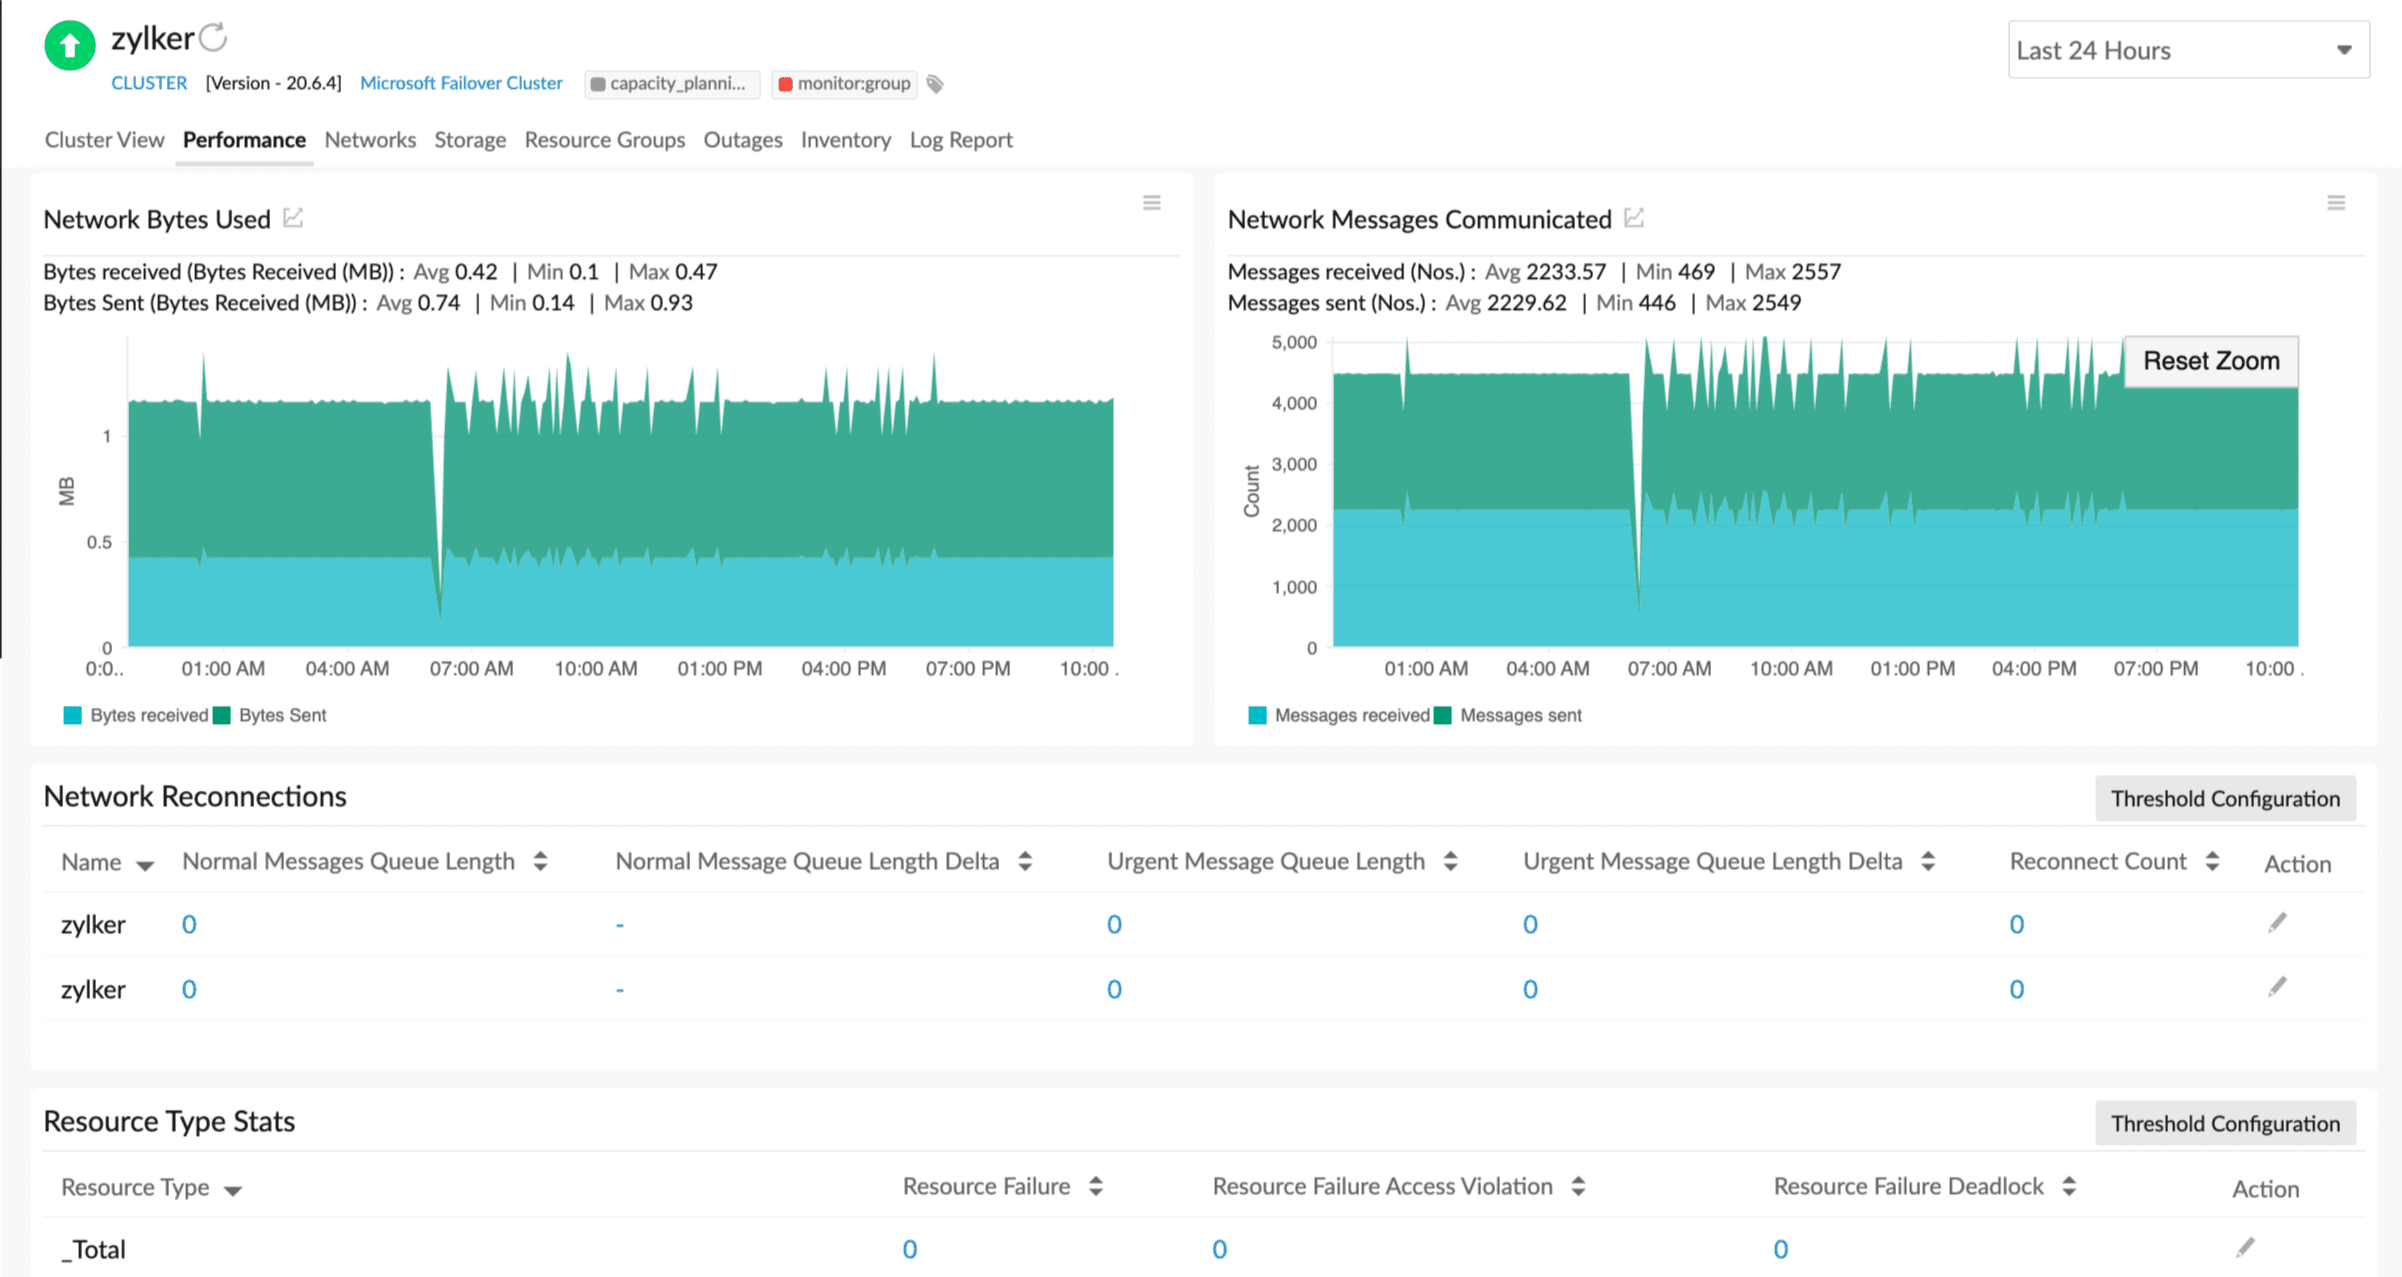
Tracking performance metrics
Keep track of all the critical performance-related metrics as this will help you achieve control over the cluster. Get to know the disk usage data, network messages, storage utilization, and other critical performance metrics. Some of the crucial indicators that Site24x7 Failover Cluster monitoring provides include:
- Cluster details: Quorum path and type, Resources online and offline, Details of the nodes, Disks in use
- Network communication and usage: Network used and communicated, Network reconnections, Urgent messages data, Reconnect data
- Performance: Multicast request reply, Resource type data, Resource failure data, Resource failure deadlocks, Network sent and received
- Storage: Disk partition used and available, Path, Volume label
Based on your business requirement, you can assign thresholds and get alerted when the established threshold is breached.
Resource check monitoring
Manual errors cannot be ignored. Overcome the configuration errors with resource check monitoring. The resource check monitoring aids in assessing resources like URL, port, file, access, permissions, size, last modified, content, directory, subdirectory, availability, event/syslog rules, and regular expressions. For example, the URL resource check focuses on monitoring the accessibility of a local URL on a server and necessitates configuration of a check name and URL. By allowing the monitor to analyze, you will significantly decrease your manual labor.
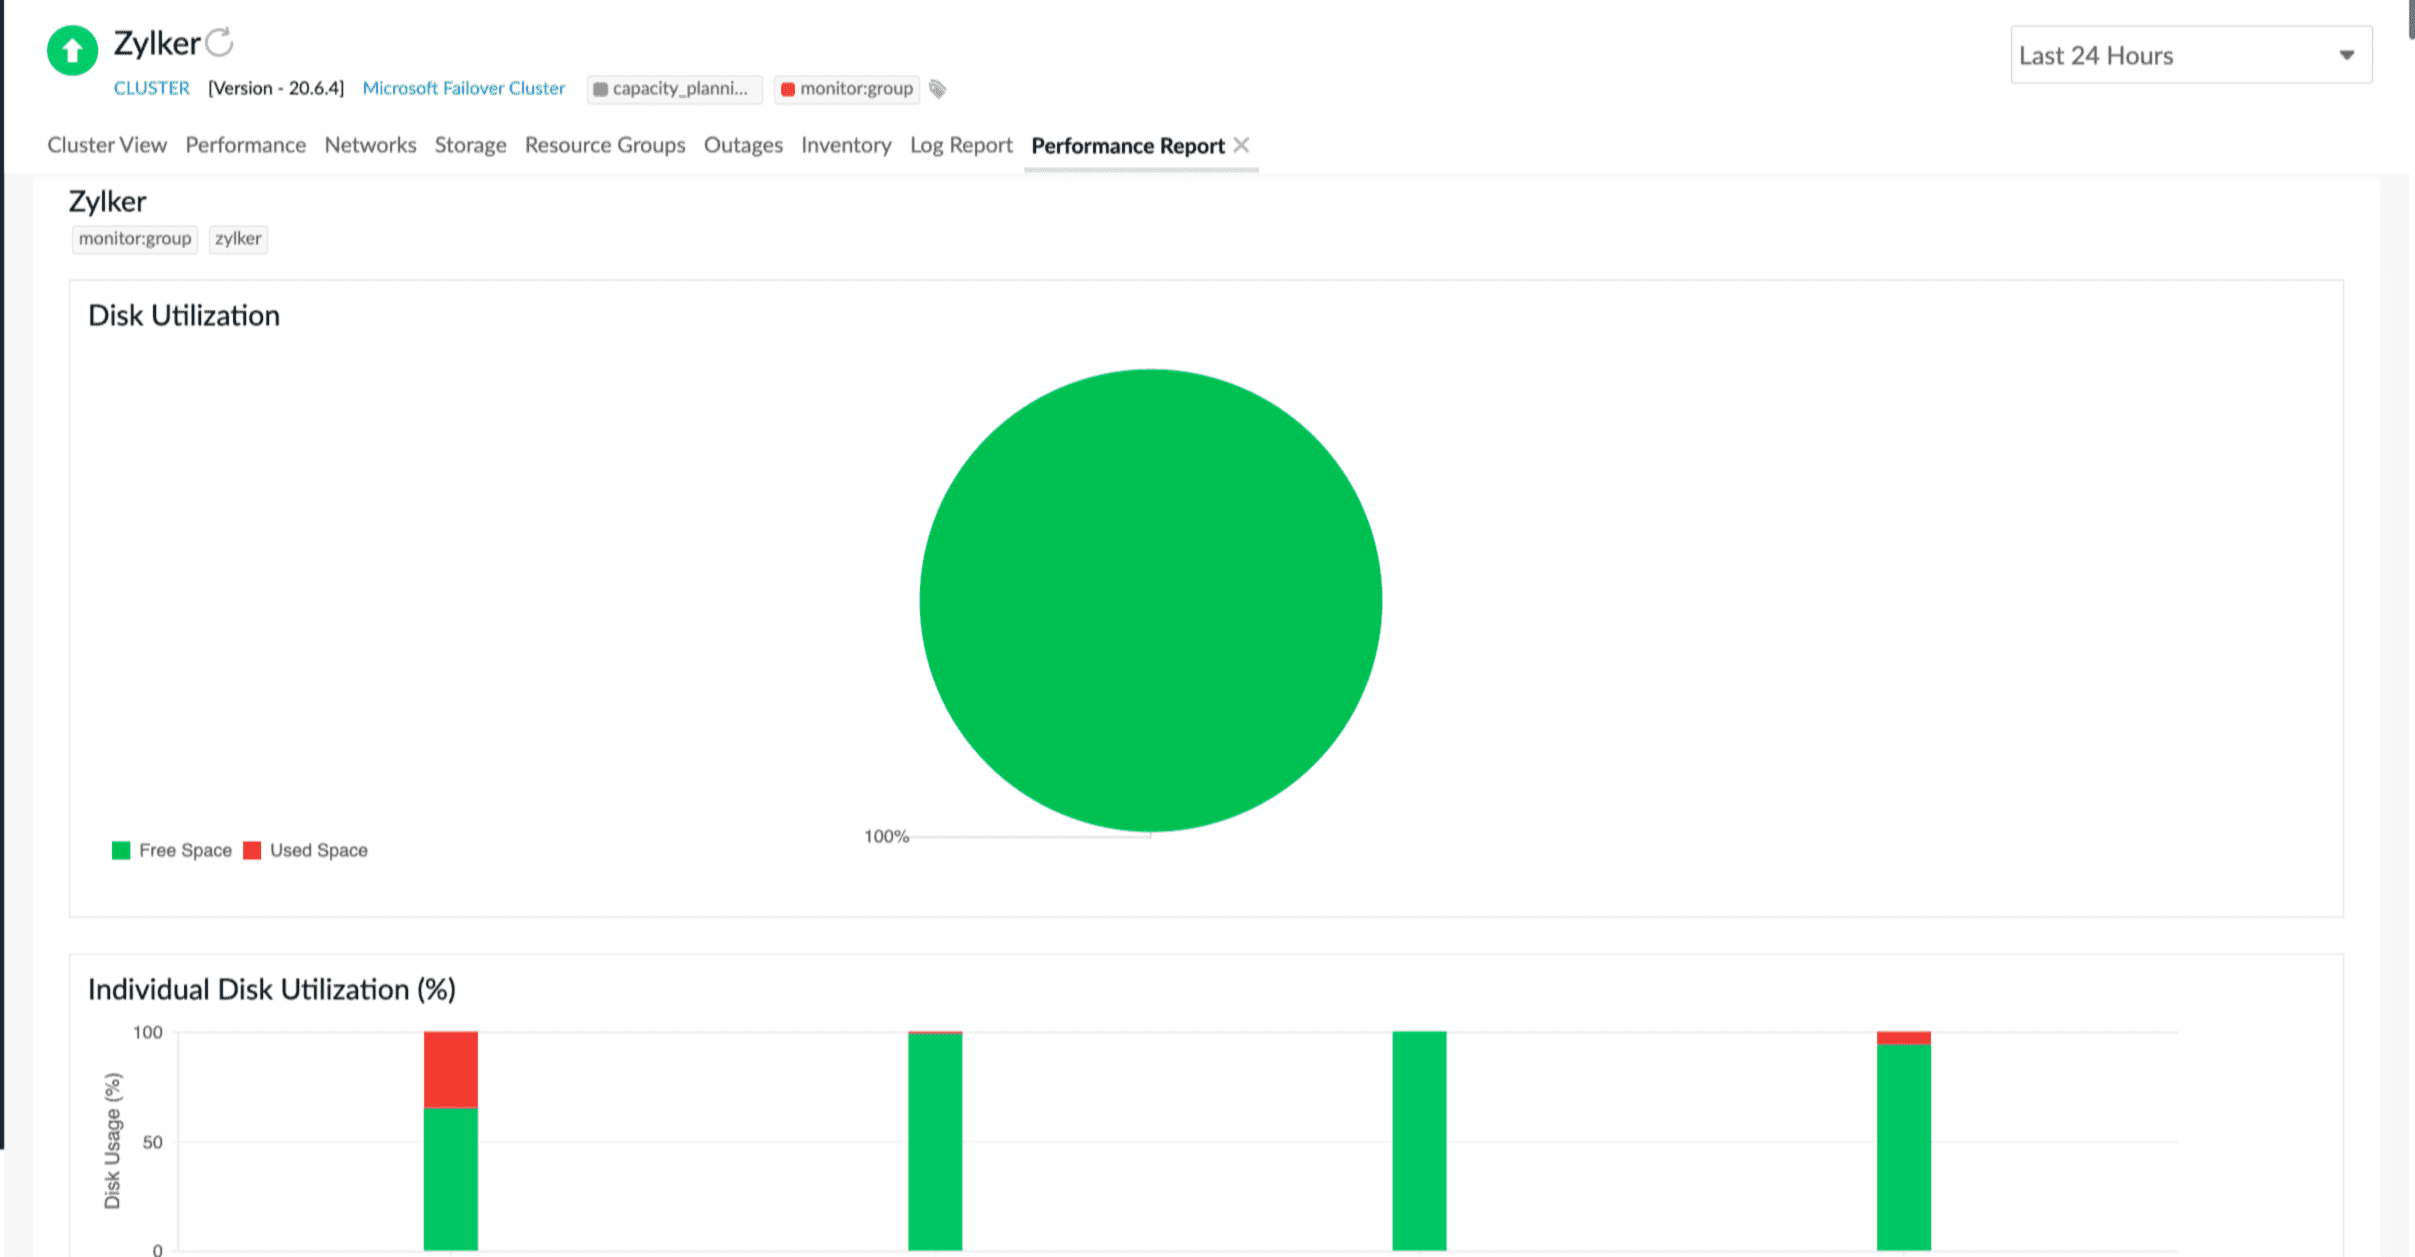
Performance Reports
Obtain a comprehensive overview of the cluster's current state, encompassing availability, peak usage periods, health patterns, performance metrics, and the status of individual cluster nodes with the exhaustive set of performance reports of Site24x7.
Event log assessment
Identify threats, diagnose applications, and avoid operating system failures by trailing the event logs.
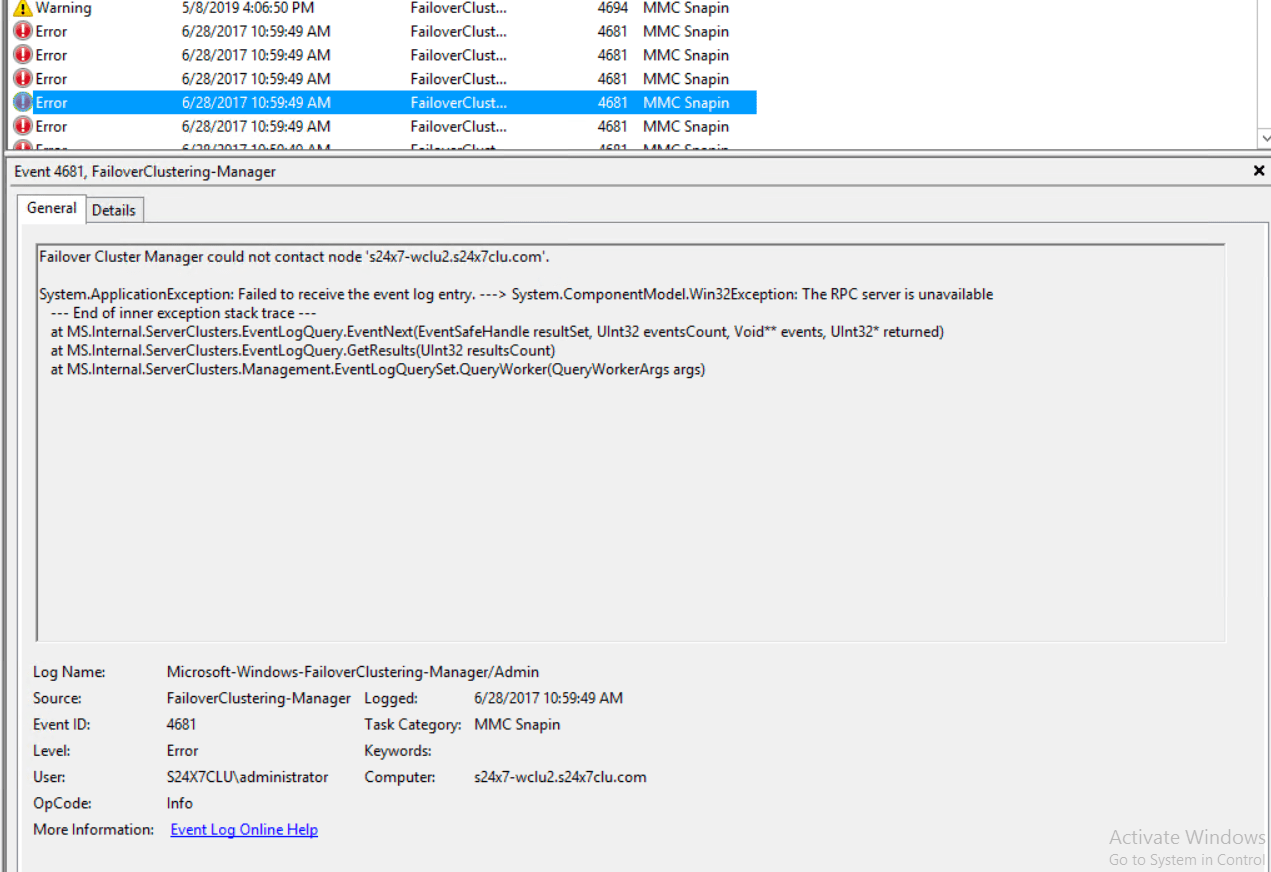
Types of event logs include system, application, and security logs, which track various events such as startup, shutdown, and access changes. Key parameters such as Check Name, Log Type, and Severity Level are essential for configuring the event log checks. When a predefined event takes place, the monitoring system will promptly alert relevant stakeholders, allowing them to address issues promptly.
This enables a more nuanced approach to monitoring, ensuring that alerts are only raised when specific conditions are met.
Analyzing trends with Forecasting
Avert downtimes by locating potential threats. This is feasible by analyzing the health and performance trends using the Zia-based forecast tool. This allows for proactive measures to be taken, such as implementing updates, before any major issues arise. The forecasting engine uses advanced algorithms and data analysis to predict potential problems accurately, giving businesses the opportunity to allowing businesses to proactively address them before they escalate.
Capacity Planning
To ensure streamlined operations, it is imperative to plan for capacity by analyzing performance metrics and setting appropriate thresholds. This facilitates tracking the behavior of instances, providing significant details for resource management. This process also helps identify outliers and diagnose service issues to maintain resource quality.
Remediate IT Automation when breach
Assign automated actions to restore to the ideal standards. Some actions include restarting the node when a set threshold is breached, cleaning up a resource by running a script or server command, or restarting a resource group when it has gone offline using IT automation.
AIOps
Site24x7's cutting-edge IT monitoring and observability platform, powered by AI provides unparalleled insights that help you ensure uninterrupted service, automate remediation, and reduce mean time to repair (MTTR) issues. With real-time monitoring, anomaly detection, and predictive analysis, Site24x7 empowers your DevOps teams and cluster admins to stay ahead of potential problems and resolve them quickly.
Plus, Site24x7 provides data visualization of your entire cluster operations, business intelligence, and predictive analytics to help you make informed decisions. With these advanced features like anomaly detection, automation, and forecasting analysis, Site24x7 is the encyclopedic AIOps solution you need for efficient IT operations management.
With the help of Site24x7's AIOps, you can stay vigilant about what is happening in your cluster environment without losing data, ensuring near-to-zero availability.
We hope you found this blog helpful. In this portion, part 2, we focused on solutions to common issues with Failover Clusters. If you missed or would like to review part 1 that discussed what they are, how they work, and more, click here.
Comments (0)