Optimizing webpage performance with Site24x7's waterfall chart
A slow website equals lost opportunities. Frustrated users abandon slow-loading sites, impacting conversions and search rankings. Prioritize website speed for business success and exceptional user experiences.
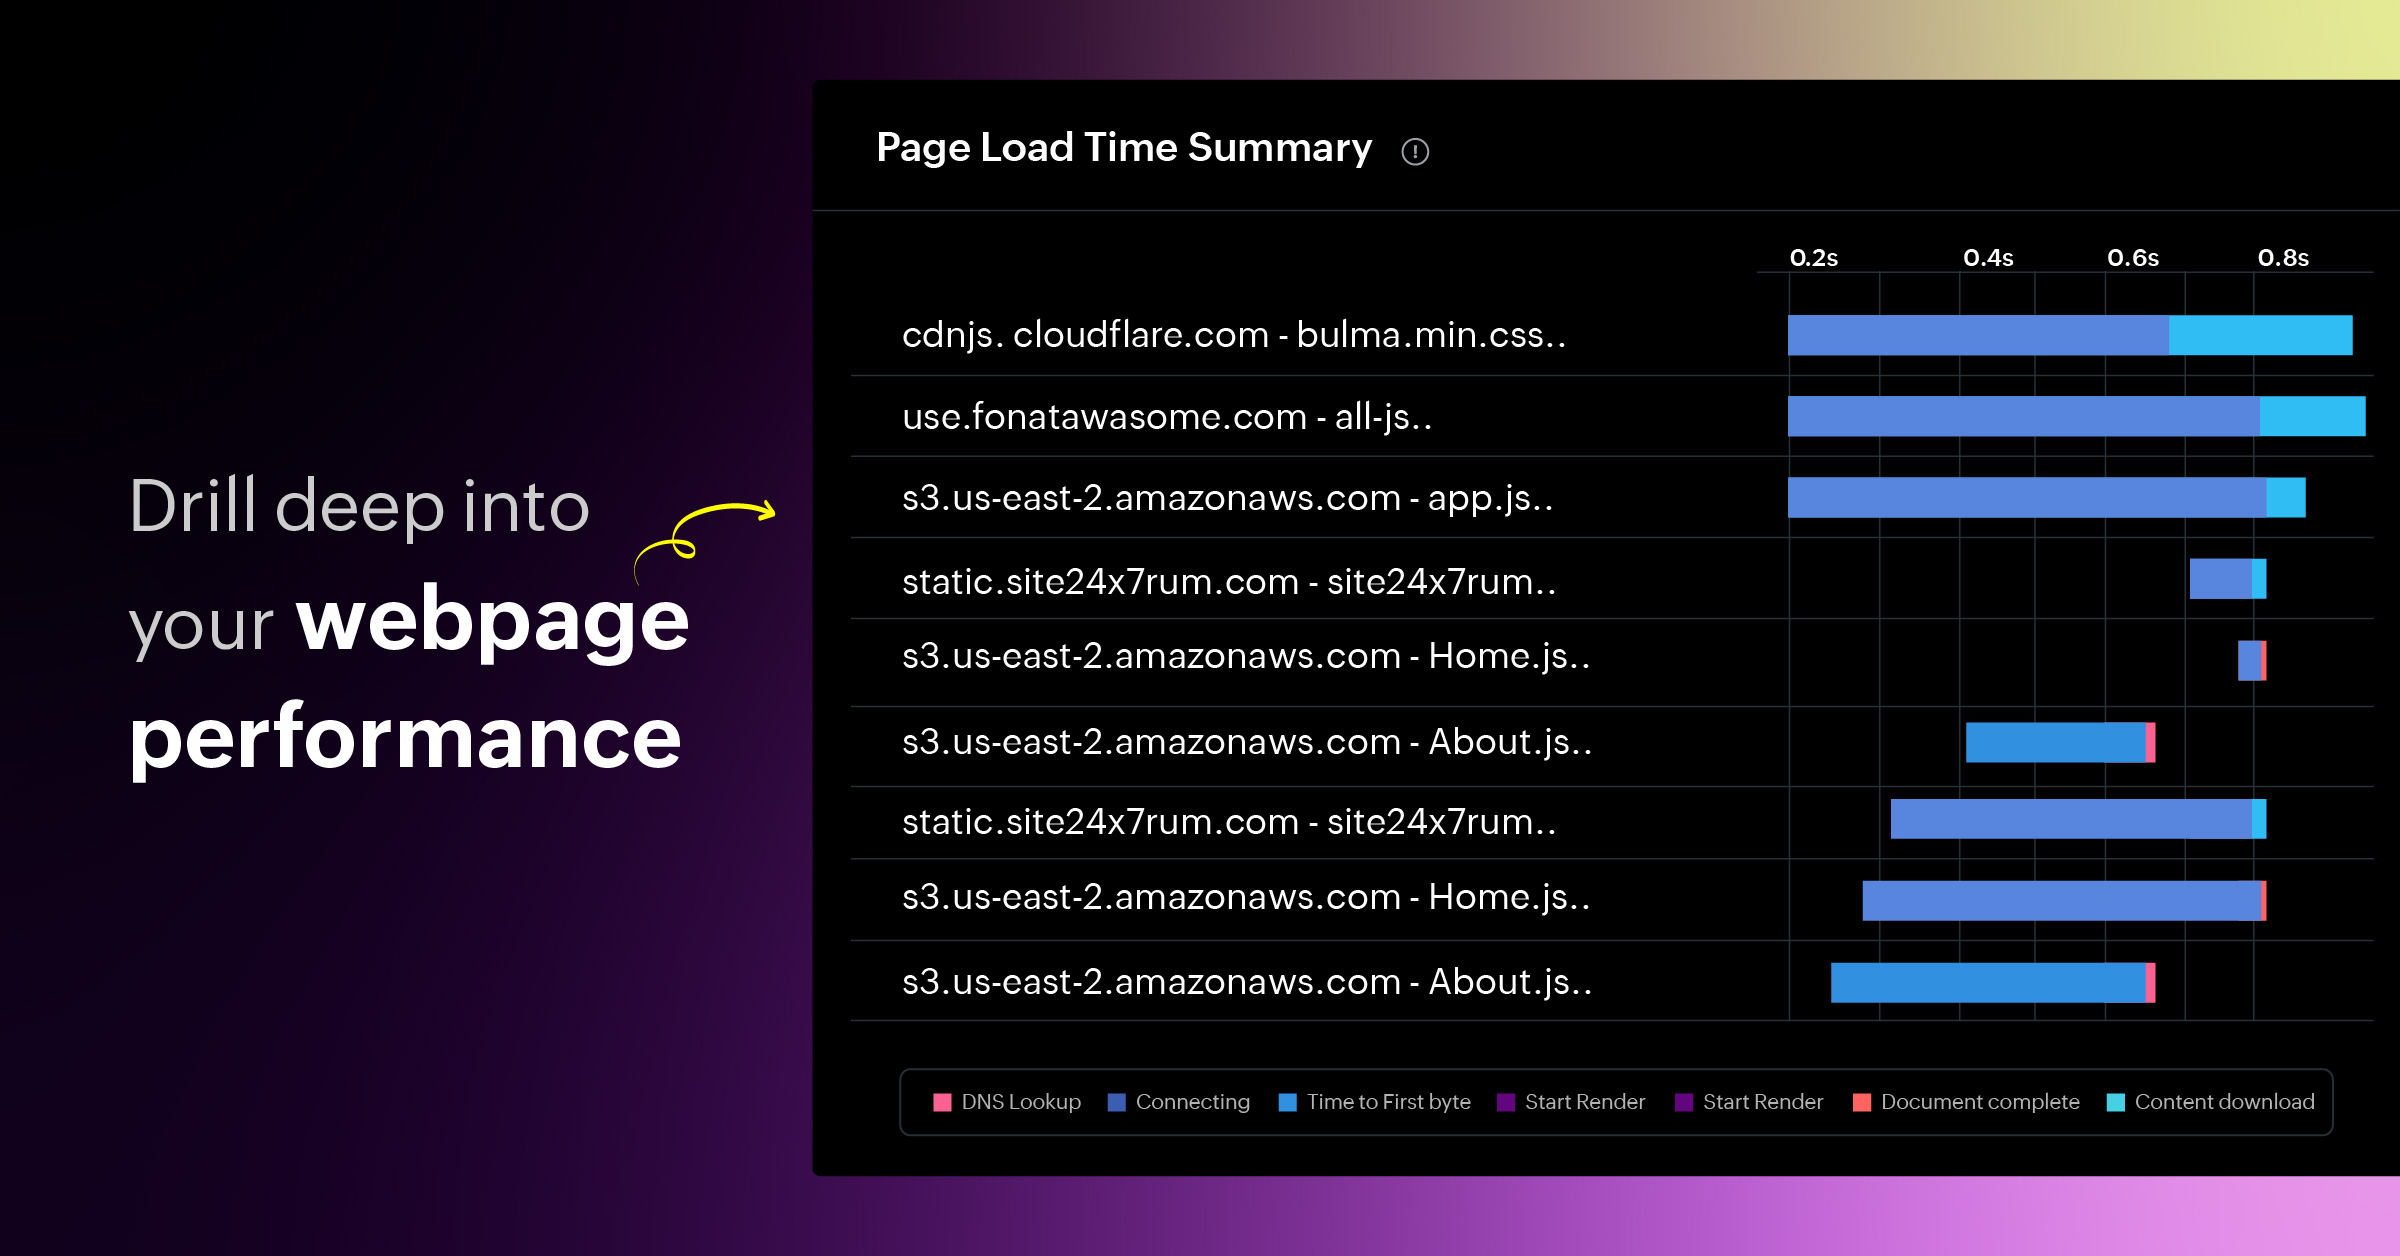
Site24x7's waterfall chart is a critical tool for understanding and optimizing webpage performance. It provides a visual representation of the sequence and timing of resource loading on a webpage. This in-depth breakdown helps identify performance bottlenecks and areas for improvement.
How can Site24x7's waterfall chart help website owners?
Website owners like you can leverage Site24x7's waterfall chart in several ways to improve your website's performance and the user experience. Here's a breakdown with specific use cases:
Identifying performance bottlenecks
Imagine you run an e-commerce website with a photography product section. You suspect the high-resolution images might be slowing down page load times and impacting conversion rates. Using Site24x7's waterfall chart, you can analyze your product pages. You might see long bars that stand for image resources, indicating they take a significant time to load. This highlights how un-optimized images can create bottlenecks.
Prioritizing optimization efforts
Consider that you've integrated a popular social media sharing plugin on your website to encourage user engagement. However, you've noticed a recent dip in website loading speed. You can analyze the waterfall chart and see if the social media plugin script has a longer loading time compared to other resources. This might indicate the script is bloated or causing unnecessary requests. You can prioritize optimizing this script by contacting the provider or exploring alternative, lightweight social sharing plugins.
Monitoring third-party integrations
You might be relying on an ad network to generate revenue from your website. However, you've been receiving user complaints about slow loading times, particularly on mobile devices. The waterfall chart can help identify if the ad network scripts are taking an unusually long time to load, especially on mobile connections. This might indicate inefficient ad delivery by the network. You can use the waterfall chart to monitor the performance of the ad network scripts and consider switching to a faster alternative if necessary.
Debugging performance issues: Identifying slow database queries
You've recently updated your product search functionality on your website. However, users are now experiencing delays when searching for products. Analyze the waterfall chart before and after the search functionality update. After the update, an increase in API response time might be marked. This could indicate inefficient database queries associated with the new search feature. You can use the waterfall chart to pinpoint the problematic queries and work with your developers to optimize them for faster search results.
Compare page load speeds across devices: Optimizing for mobile users
Your website traffic statistics show a significant increase in mobile users. However, you're concerned about the user experience on mobile devices, as mobile conversion rates are lower than desktop. Utilizing Site24x7's features to compare waterfall charts generated from mobile and desktop visits can help. This might reveal resources that load particularly slowly on mobile connections (e.g., large images). You can prioritize optimizing these resources for mobile devices, such as using responsive image formats or implementing lazy loading techniques.
Thus, by leveraging Site24x7's waterfall chart to identify and address website performance bottlenecks, you can significantly enhance the user experience, boost conversions, and drive business growth. Start your free trial of Site24x7 now. For further analysis of the user experience on your page, you can try our digital experience monitoring tool.