Top Log Monitoring Tools
Log files are vital to your organization. From helping organizations troubleshoot IT issues, to investigating security incidents, to locating an application error or isolating an underperforming component, the information that you need to make your life easier is on your logs.
Do you think that your only option for log data monitoring is Splunk? Think again!
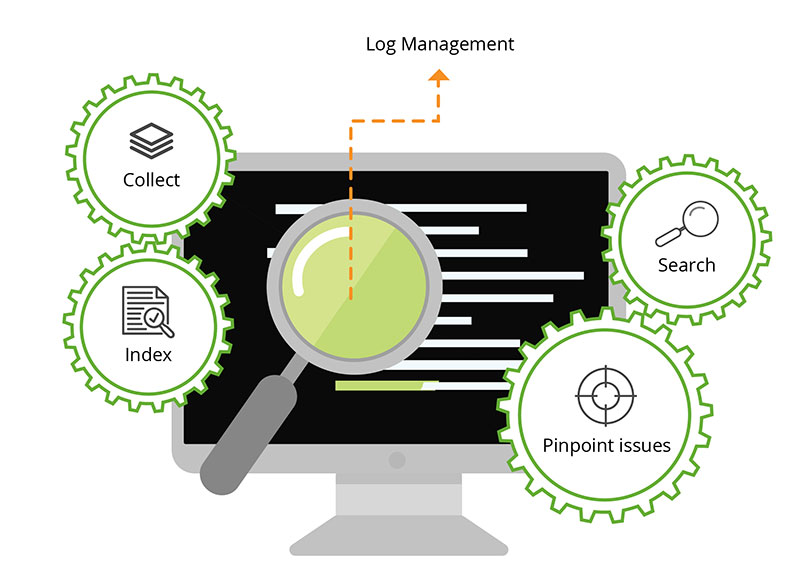
Log management is vital for DevOps and Application Teams looking to simplify and accelerate triage and troubleshooting tasks. For example with Site24x7 Log Management , you can automatically collect, consolidate, index, search, and troubleshoot your servers' logs quickly, using an intuitive, unified web client, all from the cloud.
Similarly, Security Information and Event Management (SIEM) is the practice of automatically collecting, monitoring and analyzing security-related data from events and logs including antivirus software, file systems, firewalls, servers, routers, switches, applications and IDS and IPS systems. You have affordable options ranging from full blown commercial systems like ManageEngine Log360 (a one-stop solution for all log management and network security challenges) or its’ cloud-based counterpart ManageEngine Log 360 Cloud to open source OSSIM and PreludeIDS alternatives.
As you get ready to boost your monitoring by adding log management capabilities to your arsenal here are some tips and tools to help you build the right log management approach that is right for you and your organization.
Identify which logs to monitor.
Every single device and application in your network is logging information. An application crash? An overloaded IIS server? An external database call failure? All logged. Consider assigning priorities and starting small as you build out your log management strategy. For example, you could focus first on those devices (Windows, Linux and Unix devices, switches, firewalls, routers..) and applications (Cassandra, Java, IIS, Apache, custom applications, etc.) that your team is responsible for, those most critical to the business, or systems more prone to errors. You can always expand and manage more logs later on.
Centralize and unify all log data into one single place for easy access and consumption across all functions and teams. Here you can explore open source tools like Logstash (a server‑side data processing pipeline that ingests data from multiple sources simultaneously, transforms it, and then sends it to a "stash" or other outputs), Fluentd (pluggable architecture to collect and route logs into big data, data warehouses, notification systems and more) or Syslog-ng which also collects logs from any source, process them in real time and delivers them to a wide variety of destinations. You could also sign-up for a free Site24x7 log management trial account with advanced auto-discovery capabilities to automatically recognize the format of more than 20 application-related logs, and start collecting records at the click of a button.
Log data retention is important for real-time troubleshooting and analyzing historical incidents and events, as well as baselining and comparing application and system performance. Want to stream data into Hadoop for further analysis and storage? Do you need to retain your logs for forensics evidence or historical comparisons? Check out open sources tools like Apache Flume, LOGalyze, or NXLog Community Edition free version. With ManageEngine Log360 you can also archive logs from syslog devices, perimeter security devices, Linux/UNIX/Windows servers, applications, and more to meet the stringent multi-year storage requirements of regulatory mandates such as PCI DSS, FISMA, HIPAA, SOX, GLBA, GPG 13, and more.
The volume of information you are dealing with is massive, so the ability to index, filter, search, and analyze to derive quick actionable insights is vital for IT Ops and development teams looking to streamline their operations. Compare log management functionality across vendors so you can quickly and easily index and search through piles of data effortlessly. For example, could you combine many types of searches structured, unstructured, geo, metric any way you want? Could you search several days worth of logs in one go? Could you search historical data from last week? Could you associate raw log entries with a set of servers to narrow or broaden your search field?
Real-time notification and alerts when errors are found in your logs (e.g. 404 errors, 408 request timeout…) can help you identify early problem signs, before your users call your helpdesk. For example Graylog open source provides alerting, reporting and exploration across terabytes of data from multiple log sources. With Amazon CloudWatch Logs AWS customers can also monitor their logs for specific phrases, values or metrics in near real-time and get alerted at the first sign of trouble. Site24x7 also offers mobile access, SLA management and alerts to warn you of early problematic signs.
Troubleshooting can be simplified with visual aids to help you locate root cause of problems faster. For example Kibana is an open source log data visualization plugin for Elasticsearch where users can create bar, line and scatter plots, or pie charts and maps on top of the content indexed on an Elasticsearch cluster. With Site24x7 Log Management graphs and charts, you can also troubleshoot faster and pinpoint the number of times a particular log has been indexed. In addition, since you can track server performance and relevant logs together because of seamless integration with Site24x7 Server Monitoring you will save a lot of time and ensure cross-functional alignment.
Keep everybody informed and aligned and periodically distribute log-centric reports. For example you can use X-Pack to generate, schedule and email reports of any Kibana visualization or dashboard. Take it to the next level with Site24x7 all-in-one monitoring solution. All the information and reports that you need across applications, servers and network environments as well as application code and Web user experience are accessible from a single central interface, so you will take better informed decisions.
To make your life easier and reduce TCO, open source tools are also offered as hosted versions at various price points, like Elastic Cloud, the official hosted version of Elasticsearch and Kibana on AWS and GCP. That way there is no major software to install and update, the latest functionality is always available at your fingertips, and users can see value and results in minutes. With an affordable cloud-based solution like Site24x7 Log Management and Site24x7 Windows Event Log Monitoring (included on the server packs) you can easily get logs from servers from branch offices and different data centers into one dashboard with ease, right from the cloud. Just point and click and start gathering and visualizing logs in five minutes or less (both Site24x7 Log Management and Site24x7 Windows Event Log Monitoring are bundled with a Site24x7 Server Monitoring agent).
OTHER LOG MONITORING OPTIONS:
Loggly. Cloud-based log management service with unified log analysis & monitoring and one-click access to source code to streamline DevOps.
SumoLogic. Cloud-native, machine data analytics service for log management and time series metrics.
Logentries by Rapid7. Live log management & analytics for DevOps, IT and security teams.
XPL. Automated log discovery, predefined analytics packages and automated insight to help master IT data.
Logmatic.io. Log centralization, analytics and visualization to improve IT and business performance.
Bugfender. Cloud storage for applications’ log files on users’ devices to help debug faster.
LogDNA. Instantly capture, search and graph logs from any platform with blazing fast search speed to identify root cause.
Logz.io. Elasticsearch, Logstash and Kibana on the cloud with alerts, unlimited scalability and machine-learning and predictive analytics so users can index, search & visualize data.
Scalyr. SaaS platform for high-speed log management and server monitoring.
Loom Systems. AI-powered log analysis and alerting solution for DevOps and IT managers.
Humio. Log Management for Developers and DevOps so they ca parse, store, query and share dashboards to find hidden behavioural patterns and debug failures
Timber. Log Management and aggregation system with data retention, advanced search and compliance reporting for software engineers.
Log Correlation Engine. Log management solution designed to analyze log, detect anomalies, monitor and correlate events
LogFusion. Designed for real-time log monitoring with text filtering, row highlighting, custom columns, auto-scroll, and more for system administrators and developers
LogSanctuary. Logs data platform that provides full transparency over IT logs and notification of threats and anomalies.
** "ManageEngine and Site24x7 trademarks are the exclusive property of Zoho Corporation Pvt. Ltd. or its affiliates. All other trademarks mentioned herein are used for identification purposes only and are trademarks (and may be registered trademarks) of the respective companies. This blog is not sponsored or approved by the owners of the other trademarks."