Database monitoring for beginners
That's why tracking your databases gives you the visibility into how your databases are performing under the hood.
This guide is for anyone new to the world of database monitoring—developers, operations engineers, or even curious team leads—looking to understand what it is, why it matters, and how to get started.
Monitoring websites from the United States
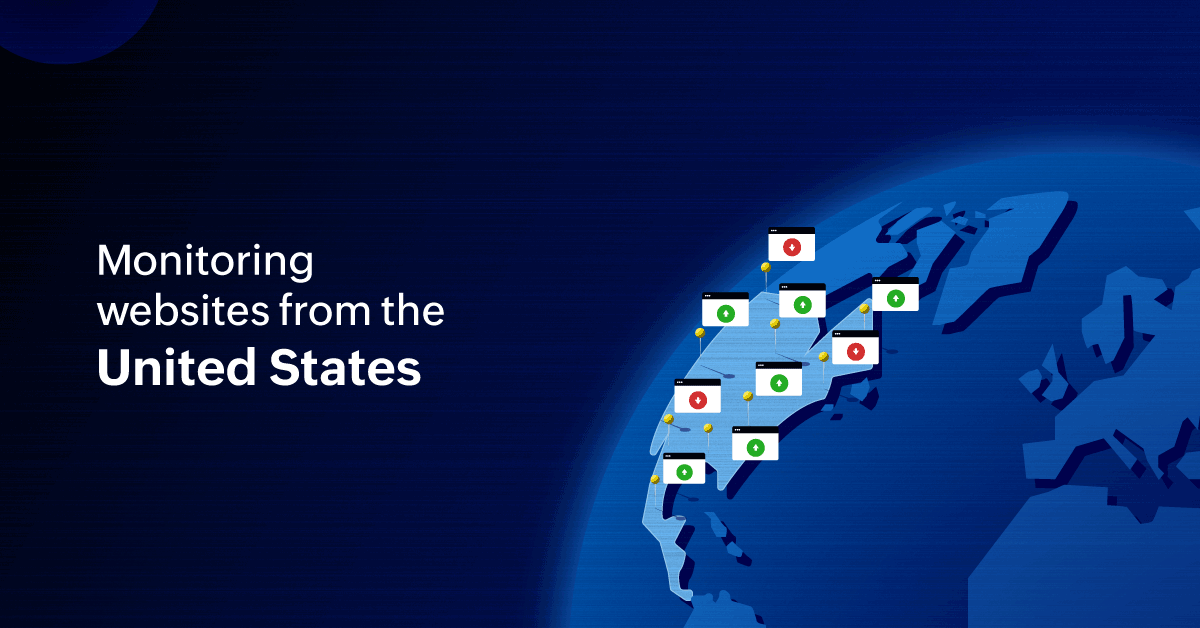
Let’s have a look at some of the numbers that show why it is important to monitor site performance from the US. The US hosts over 505 million websites , representing 41% of the world's total websites. Moreover, with 49.47% of all internet traffic in the region coming from desktops, with mobile devices taking up a share of 48.15%, and with...
Site24x7 partners with BigPanda agentic IT operations platform to further streamline IT operations
Site24x7 monitors across the IT stack and generates a consolidated view of incidents triggered by multiple observability tools on uptime, performance, and security. These incidents can now be fed into BigPanda to enable its users to handle monitoring signals better. Site24x7 incident alerts are sent via HTTP requests to BigPanda, where they a...
For developers from developers—Site24x7's engineering blog series

Site24x7 is a monitoring solution that uses many technologies, servers, and databases at the back end. Like any other IT organization, Site24x7 faces it's own set of challenges and tries to fix them swiftly to deliver the best user experience to end users. Our engineering team is never tired of experiments and never leaves any issue unsol...
Optimizing mobile website performance using digital experience monitoring

Mobile devices are today the primary window to the internet, especially in emerging markets. In 2023, global mobile internet users surpassed 5 billion, representing over 60% of all internet users (Source: GSMA Intelligence). Poor mobile performance has severe consequences:
Mobile browser performance can be judged based on key metrics kn...
Boosting your AWS monitoring ROI: Strategies that deliver
So, how do you actually do that? Let’s break it down.
At its core, ROI is about how much value you get back compared to what you spend. However, for AWS monitoring, it goes far beyond just cost savings. Maximizing ROI in AWS monitoring means:
ManageEngine Site24x7 monitoring actions are now available within ServiceDesk Plus On Demand

At ManageEngine, we're committed to empowering IT teams with tools that simplify operations and deliver effortless observability for all stakeholders. We're excited to announce the Site24x7 extension for ManageEngine ServiceDesk Plus On Demand now available on the ManageEngine Marketplace.
This extension transforms ServiceDesk P...
The ROI of monitoring your Azure environment: Prevent surprises, control costs, boost uptime
In a recent Reddit discussion, a user shared their experience with huge Azure Function costs. According to the user, despite having a relatively low number of function executions, they noticed an unexpected increase in their Azure bill. Upon investigation, they discovered that the associated storage account, which was created alongside the fu...
How ManageEngine Site24x7 switched from AngularJS to Angular 18, incident free
Switching to Angular 18 needed to be done without any lag or crash that would cause a glitch in operations. As a platform serving businesses from startups to large enterprises, Site24x7’s mission has always been to deliver the latest and fastest frameworks and functionalities felt at the front end—the face of the product. To keep up, Site24x7...
IIS server: Uses, benefits, and challenges
Internet Information Services, commonly referred to as IIS, is Microsoft's web server software. It is built to host websites, applications, and services for Windows systems. If you are considering IIS for hosting your website or applications, let us take you through the basics of IIS, its benefits over the other options available, and the...