Azure Diagnostic Logs
Diagnostic logs provide insights on the operations that were performed within a resource. With Microsoft Azure’s diagnostic logs, you can export basic usage metrics from content delivery network (CDN) endpoints to a variety of sources. Learn more about log management with Site24x7.
In this doc, we'll cover:
- Collecting Azure diagnostic logs
- Configuring log collection
- Troubleshooting log collection
- Reusable ARM templates with multiple Azure services
- Multiple Log Types for the same Azure service
Collecting Azure diagnostic logs
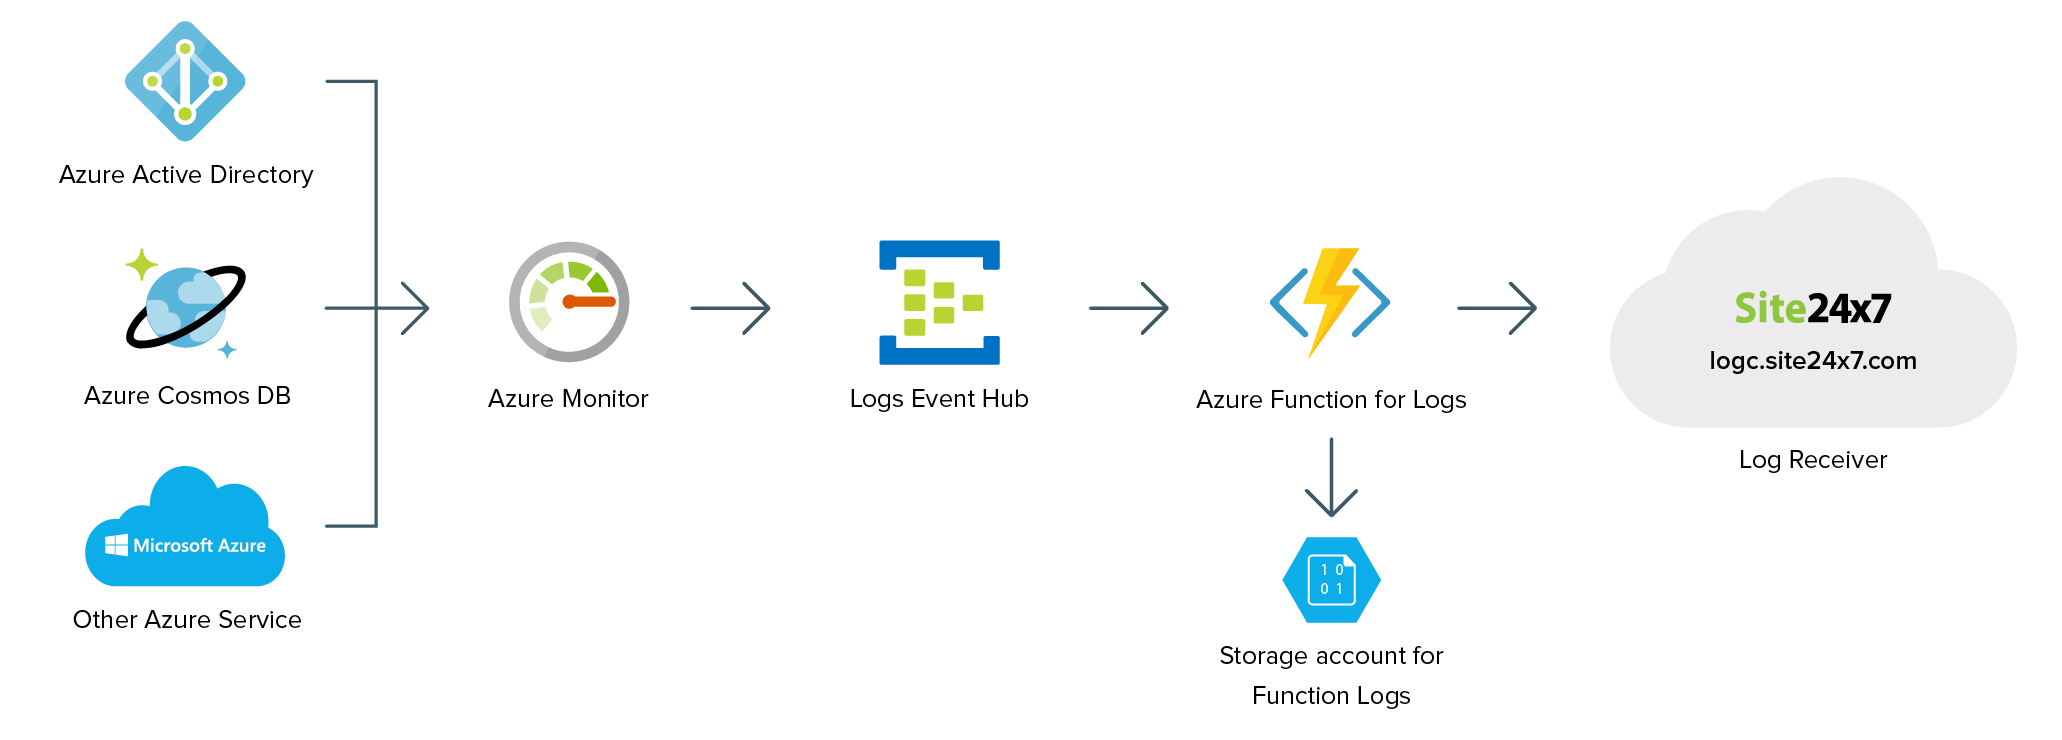
Log management and analysis using Site24x7 starts with log collection from Azure. This process involves the following steps:
- The Azure monitor collects logs from Azure services and sends the data to Azure Event Hubs, a data streaming platform and ingestion service.
- Event Hubs streams the logs to Azure functions, which is a small piece of code triggered by the event hub.
- The Azure functions:
- Send logs to the Site24x7 AppLogs HTTP source.
- Send function logs to one Azure Storage Account.
Configuring log collection
Configuring log collection is a three-step process:
- Creating a Log Profile.
- Configuring the Azure resource using an Azure Resource Manager (ARM) template.
- Pushing logs from the Azure monitor to Event Hubs.
Creating a Log Profile
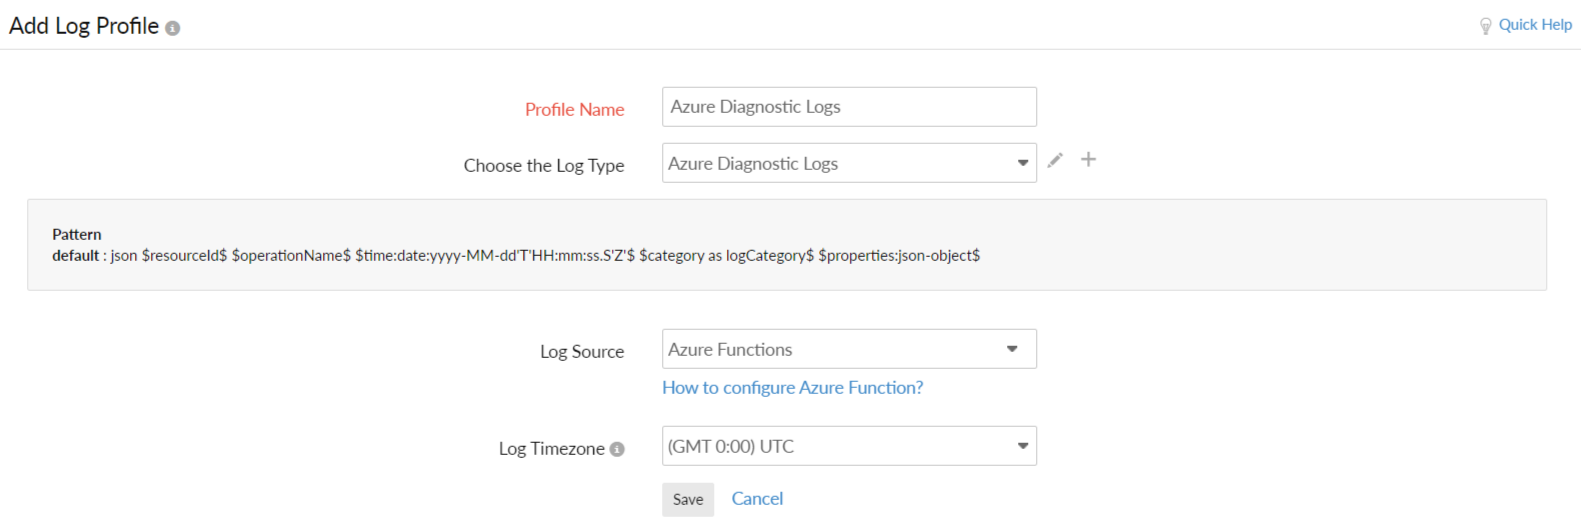
From the Site24x7 web console, navigate to Admin > AppLogs > LogProfile > Add Log Profile, and enter the following:
- Profile Name: Enter a name for your Log Profile.
- Log Type: Choose Azure Diagnostic Logs from the drop-down menu.
- Log Source: Choose Azure Functions.
- Log Time Zone: Choose UTC.
- Click Save.
Configuring Azure resources using an ARM template
As mentioned above, you need to create an event hub, Azure functions, and a Storage Account for function logs. You can create all of these using an ARM template.
- For manual installation, follow steps 1-6.
- For automatic installation, click the link below to provide the necessary details, then proceed from step 7.
- Download the ARM template.
- Log in to your Azure portal, and go to Marketplace > Template deployment(deploy using custom templates).
- Click Create.
- On the Custom deployment blade, click Build your own templatein the editor.
- On the Edit template blade, paste the contents from this JSON file into the editor window.
- Click Save.
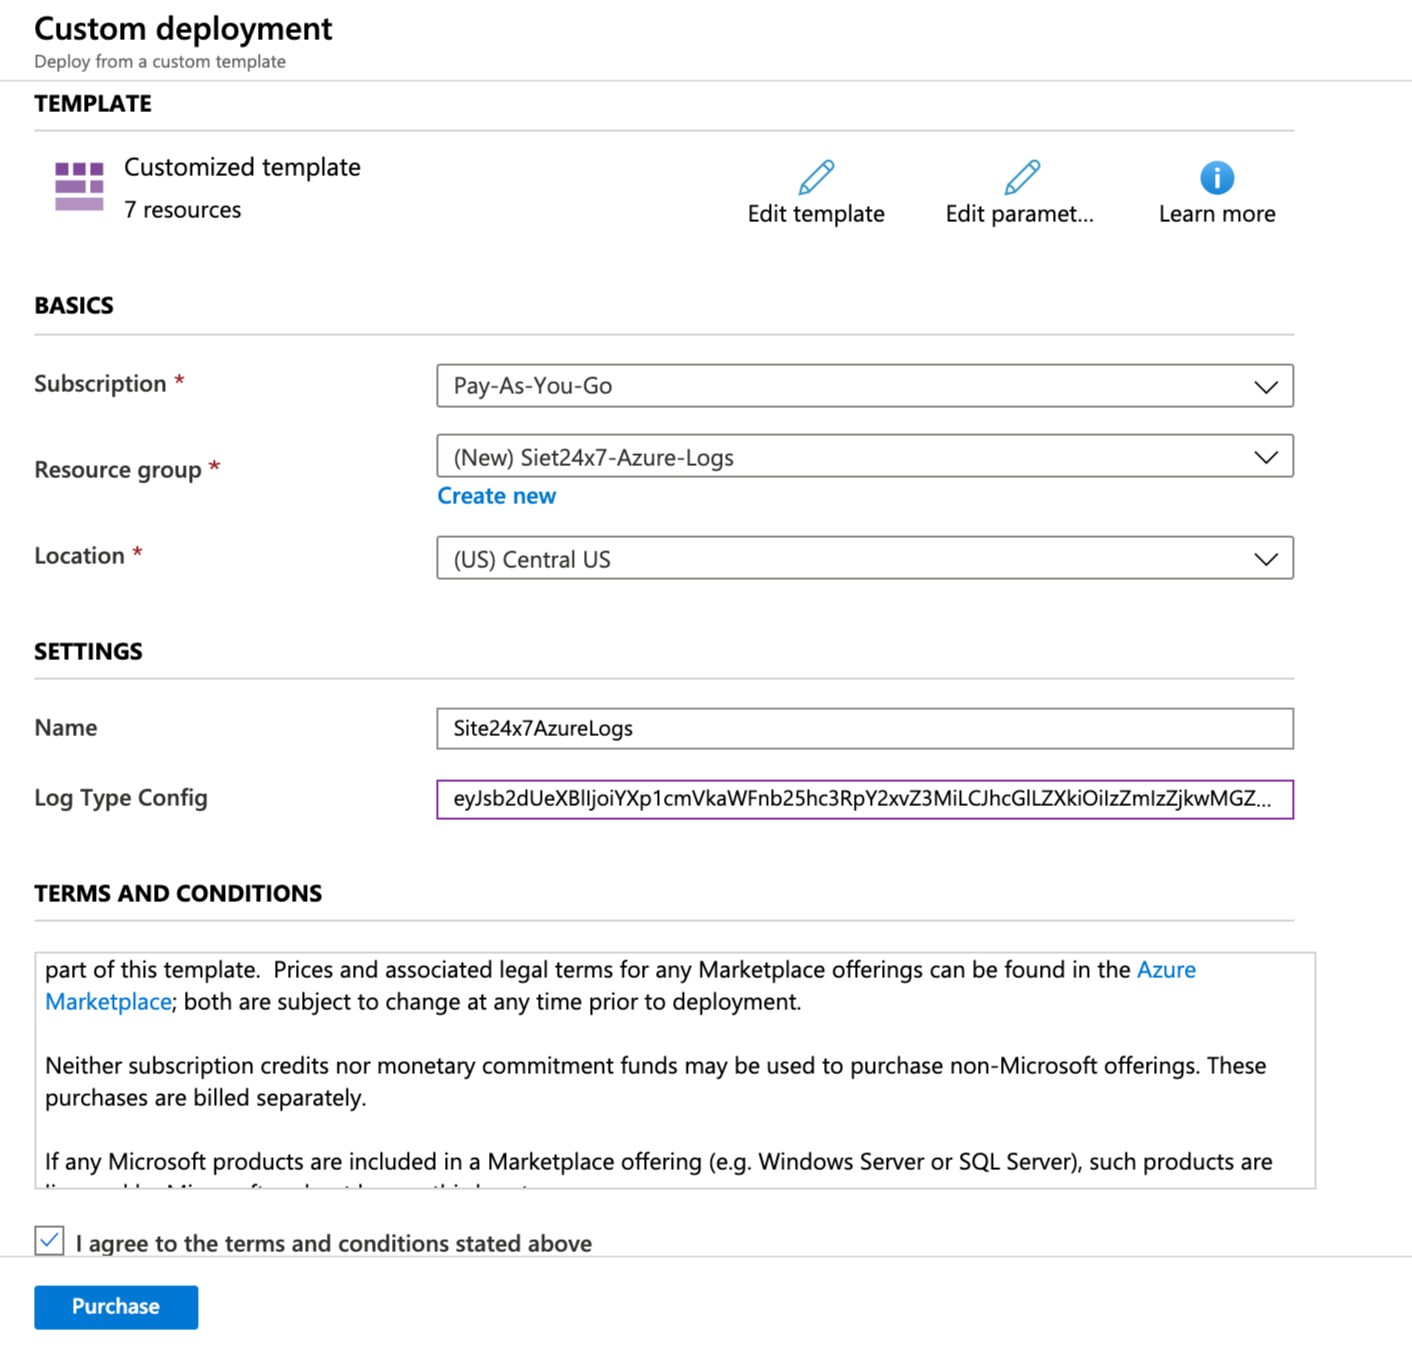
- Back on the custom deployment blade, enter the following under Basics:
- Subscription: Choose your subscription mode.
- Resource group: Create a new resource group with a name similar to Site24x7-Azure-Logs.
- Location: Choose a location.
- Under Settings:
- Name: Function name will be prefilled. You don’t need to change it.
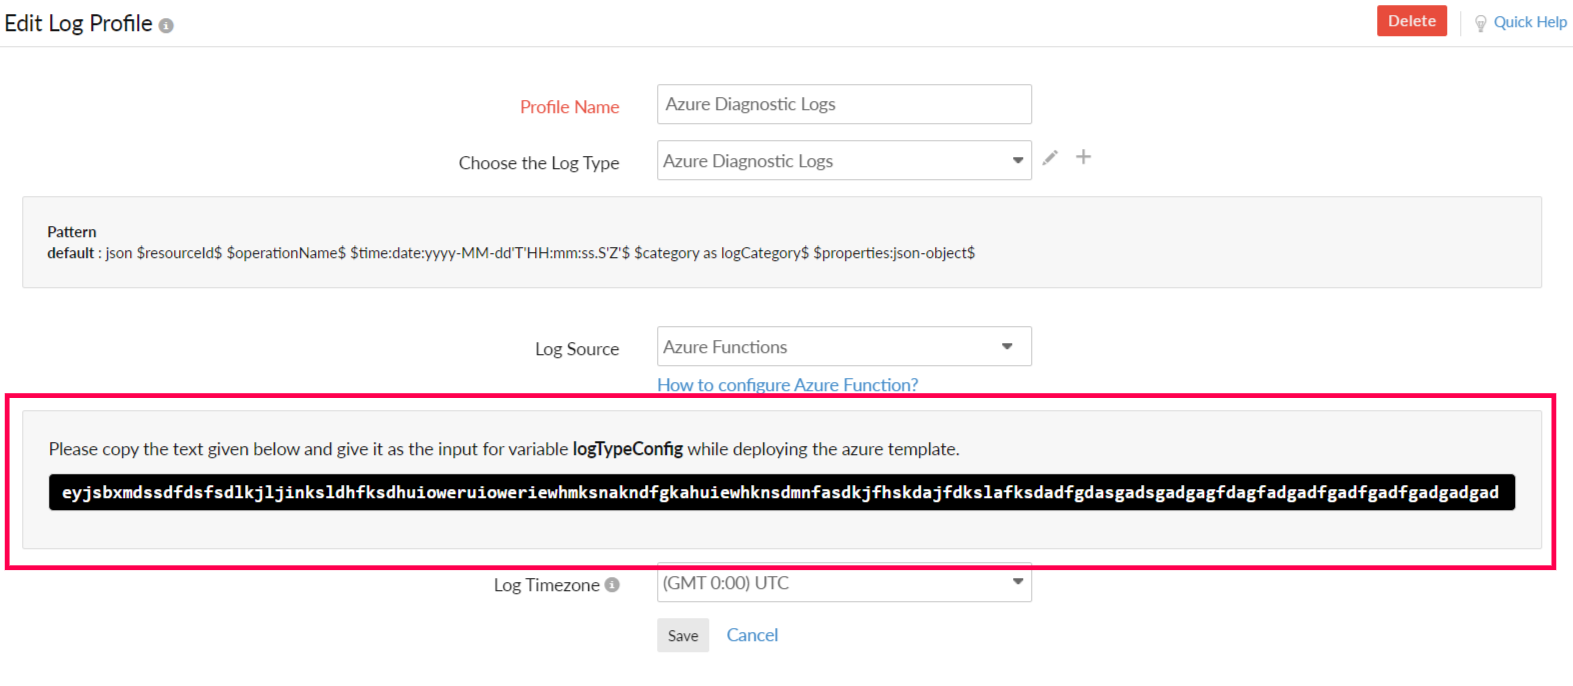
- LogTypeConfig: Copy the value from the Log Profile page that you already created within Site24x7 (Admin > AppLogs > Log Profile > Your profile name).
- Under Terms and Conditions:
- Check the box next to I agree to the terms and conditions stated above.
- Click Purchase.
- Click on the notification icon in the top pane to verify if your deployment was successful.
- On the Deployment Successful notification, click Go to resource group and verify if all resources have been successfully created.
Pushing logs from the Azure monitor to Event Hubs
Let's consider an example using Azure Active Directory. To push the audit logs to Event Hubs, follow the steps below:
- From the home screen of your Azure portal, go to Azure Active Directory.
- Under Monitoring, click Audit logs.
- Click Export Data Settings. You can view your current settings under the Diagnostic settings blade.
- You can edit these settings by clicking Edit setting, or add new settings by clicking Add diagnostic setting. You can add up to five diagnostic settings.
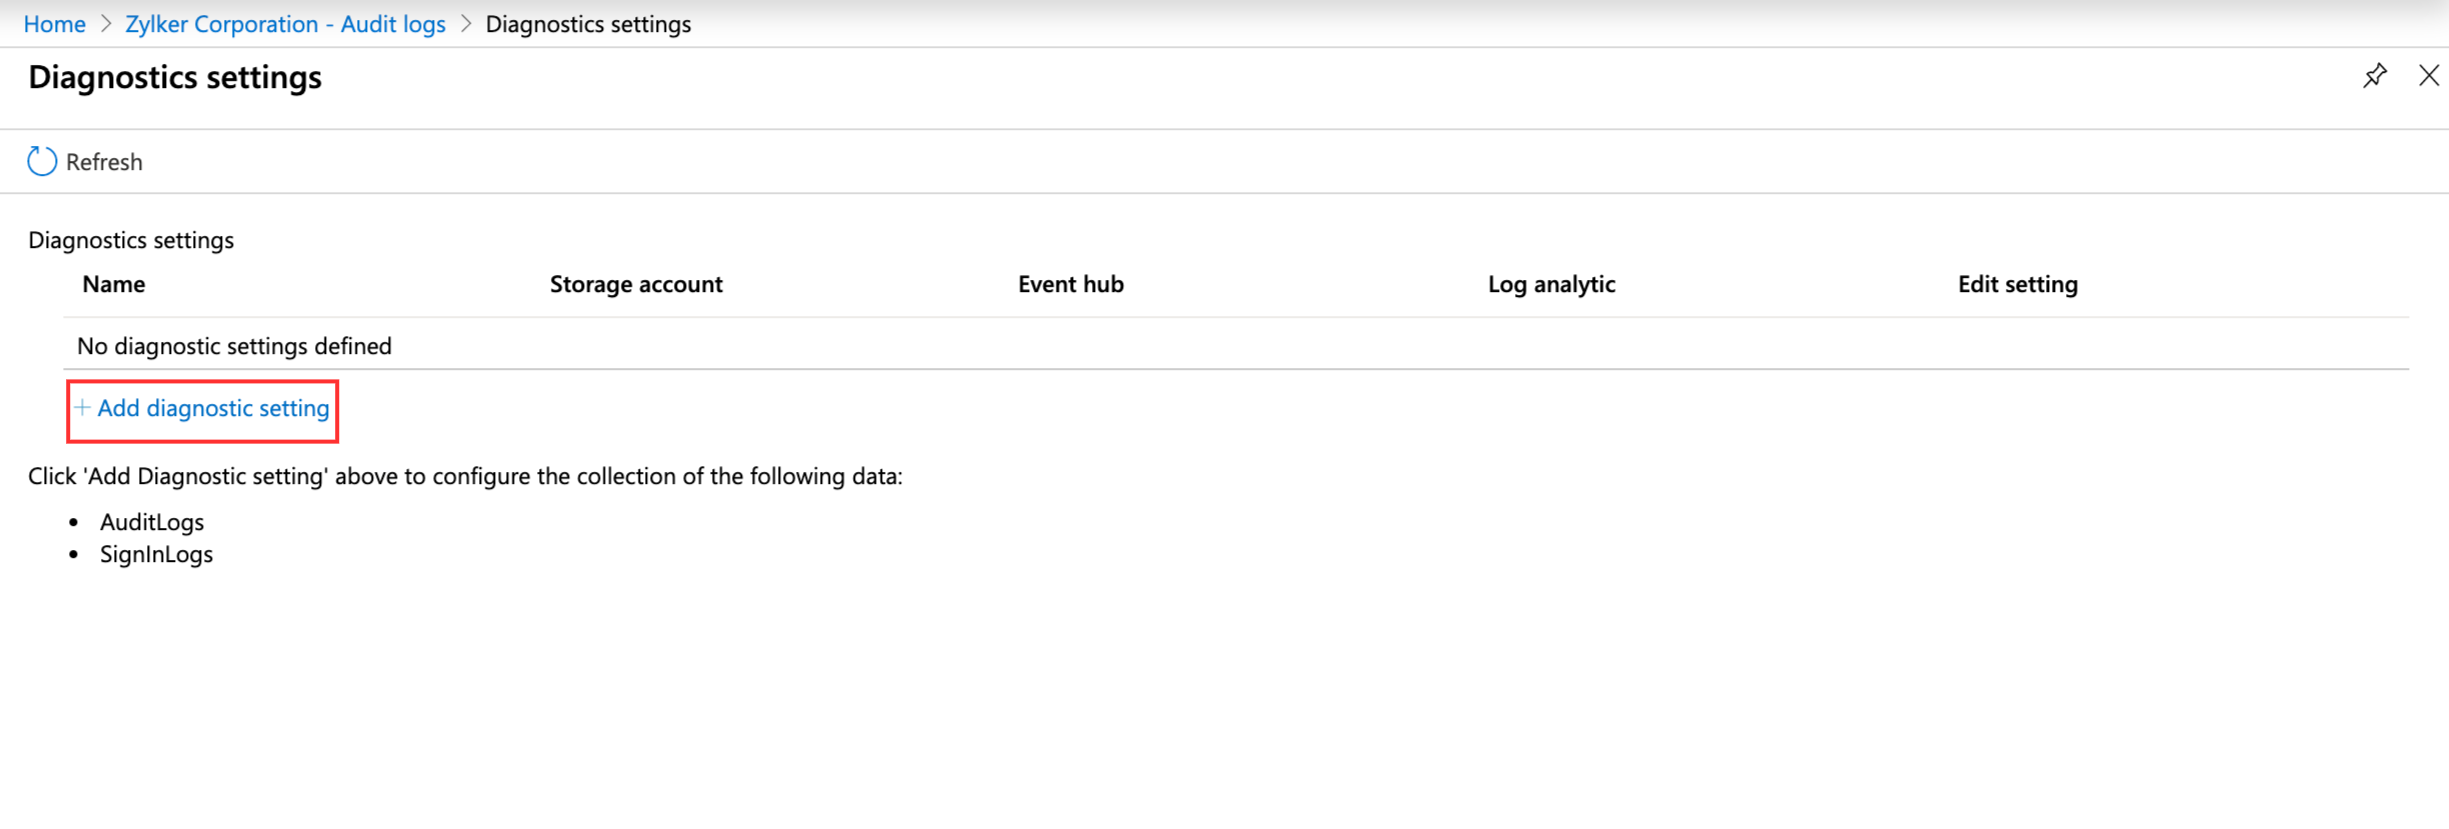
- Check the box next to Stream to an event hub.
- Under Event hub, click Configure.
- Under Select event hub, enter the following
- Subscription: Select an Azure subscription.
- Select event hub namespace: Select the namespace created using an ARM template. It should start with Site24x7AzureLogs-Namespace-<UniqueSuffix>.
- Select event hub name: Select site24x7-operational-logs from the drop-down menu.
- Select event hub policy name: Select RootManageSharedAccessKey from the drop-down menu.
- Click OK.
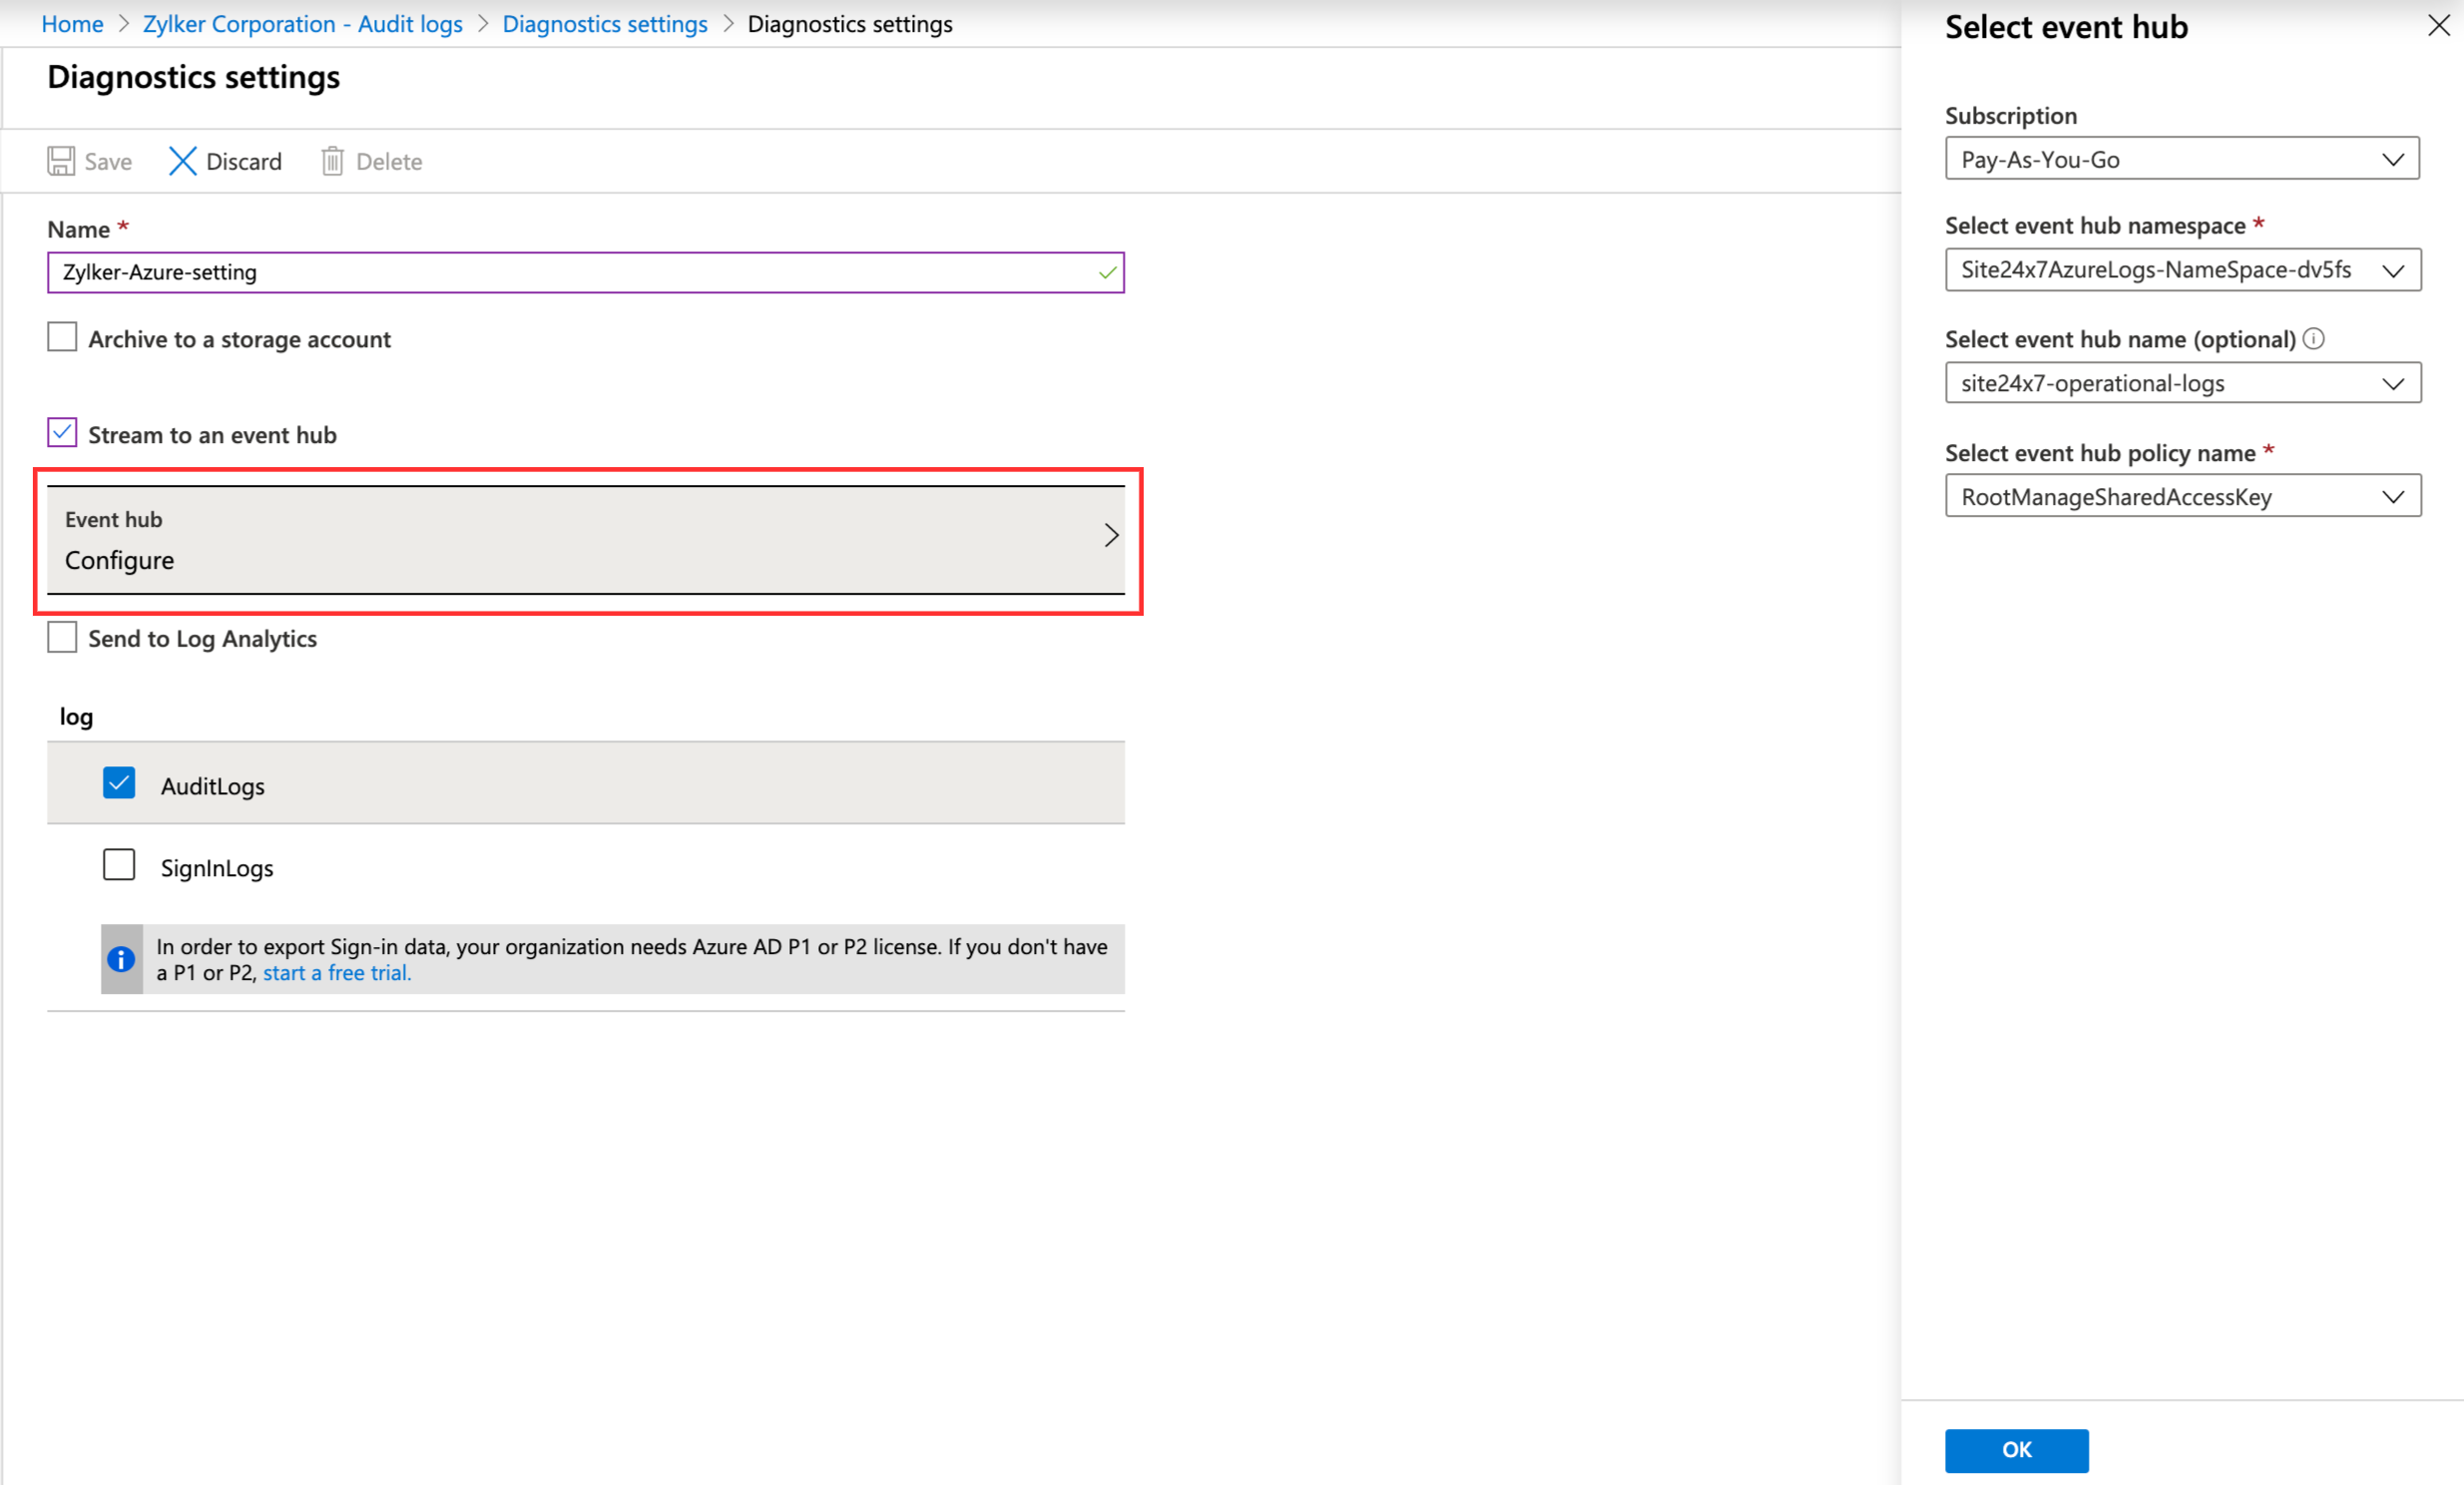
- Under Logs, check the box next to AuditLogs.
- Click Save.
Troubleshooting log collection
If Site24x7 doesn’t receive the logs, you can check where log collection has failed by:
- Verifying configurations.
- Verifying if Event Hubs is receiving logs.
- Manually verifying if the Azure functions are sending logs to Site24x7.
Verifying configurations
Ensure that your resources were successfully added. If yes, proceed with the steps below:
- From the home page of your Azure portal, go to Resource groups. Click on the resource group created using an ARM template.
- Check if it lists all four of the resources you created—an App Service plan, an App Service, an Event Hubs namespace, and a Storage Account.
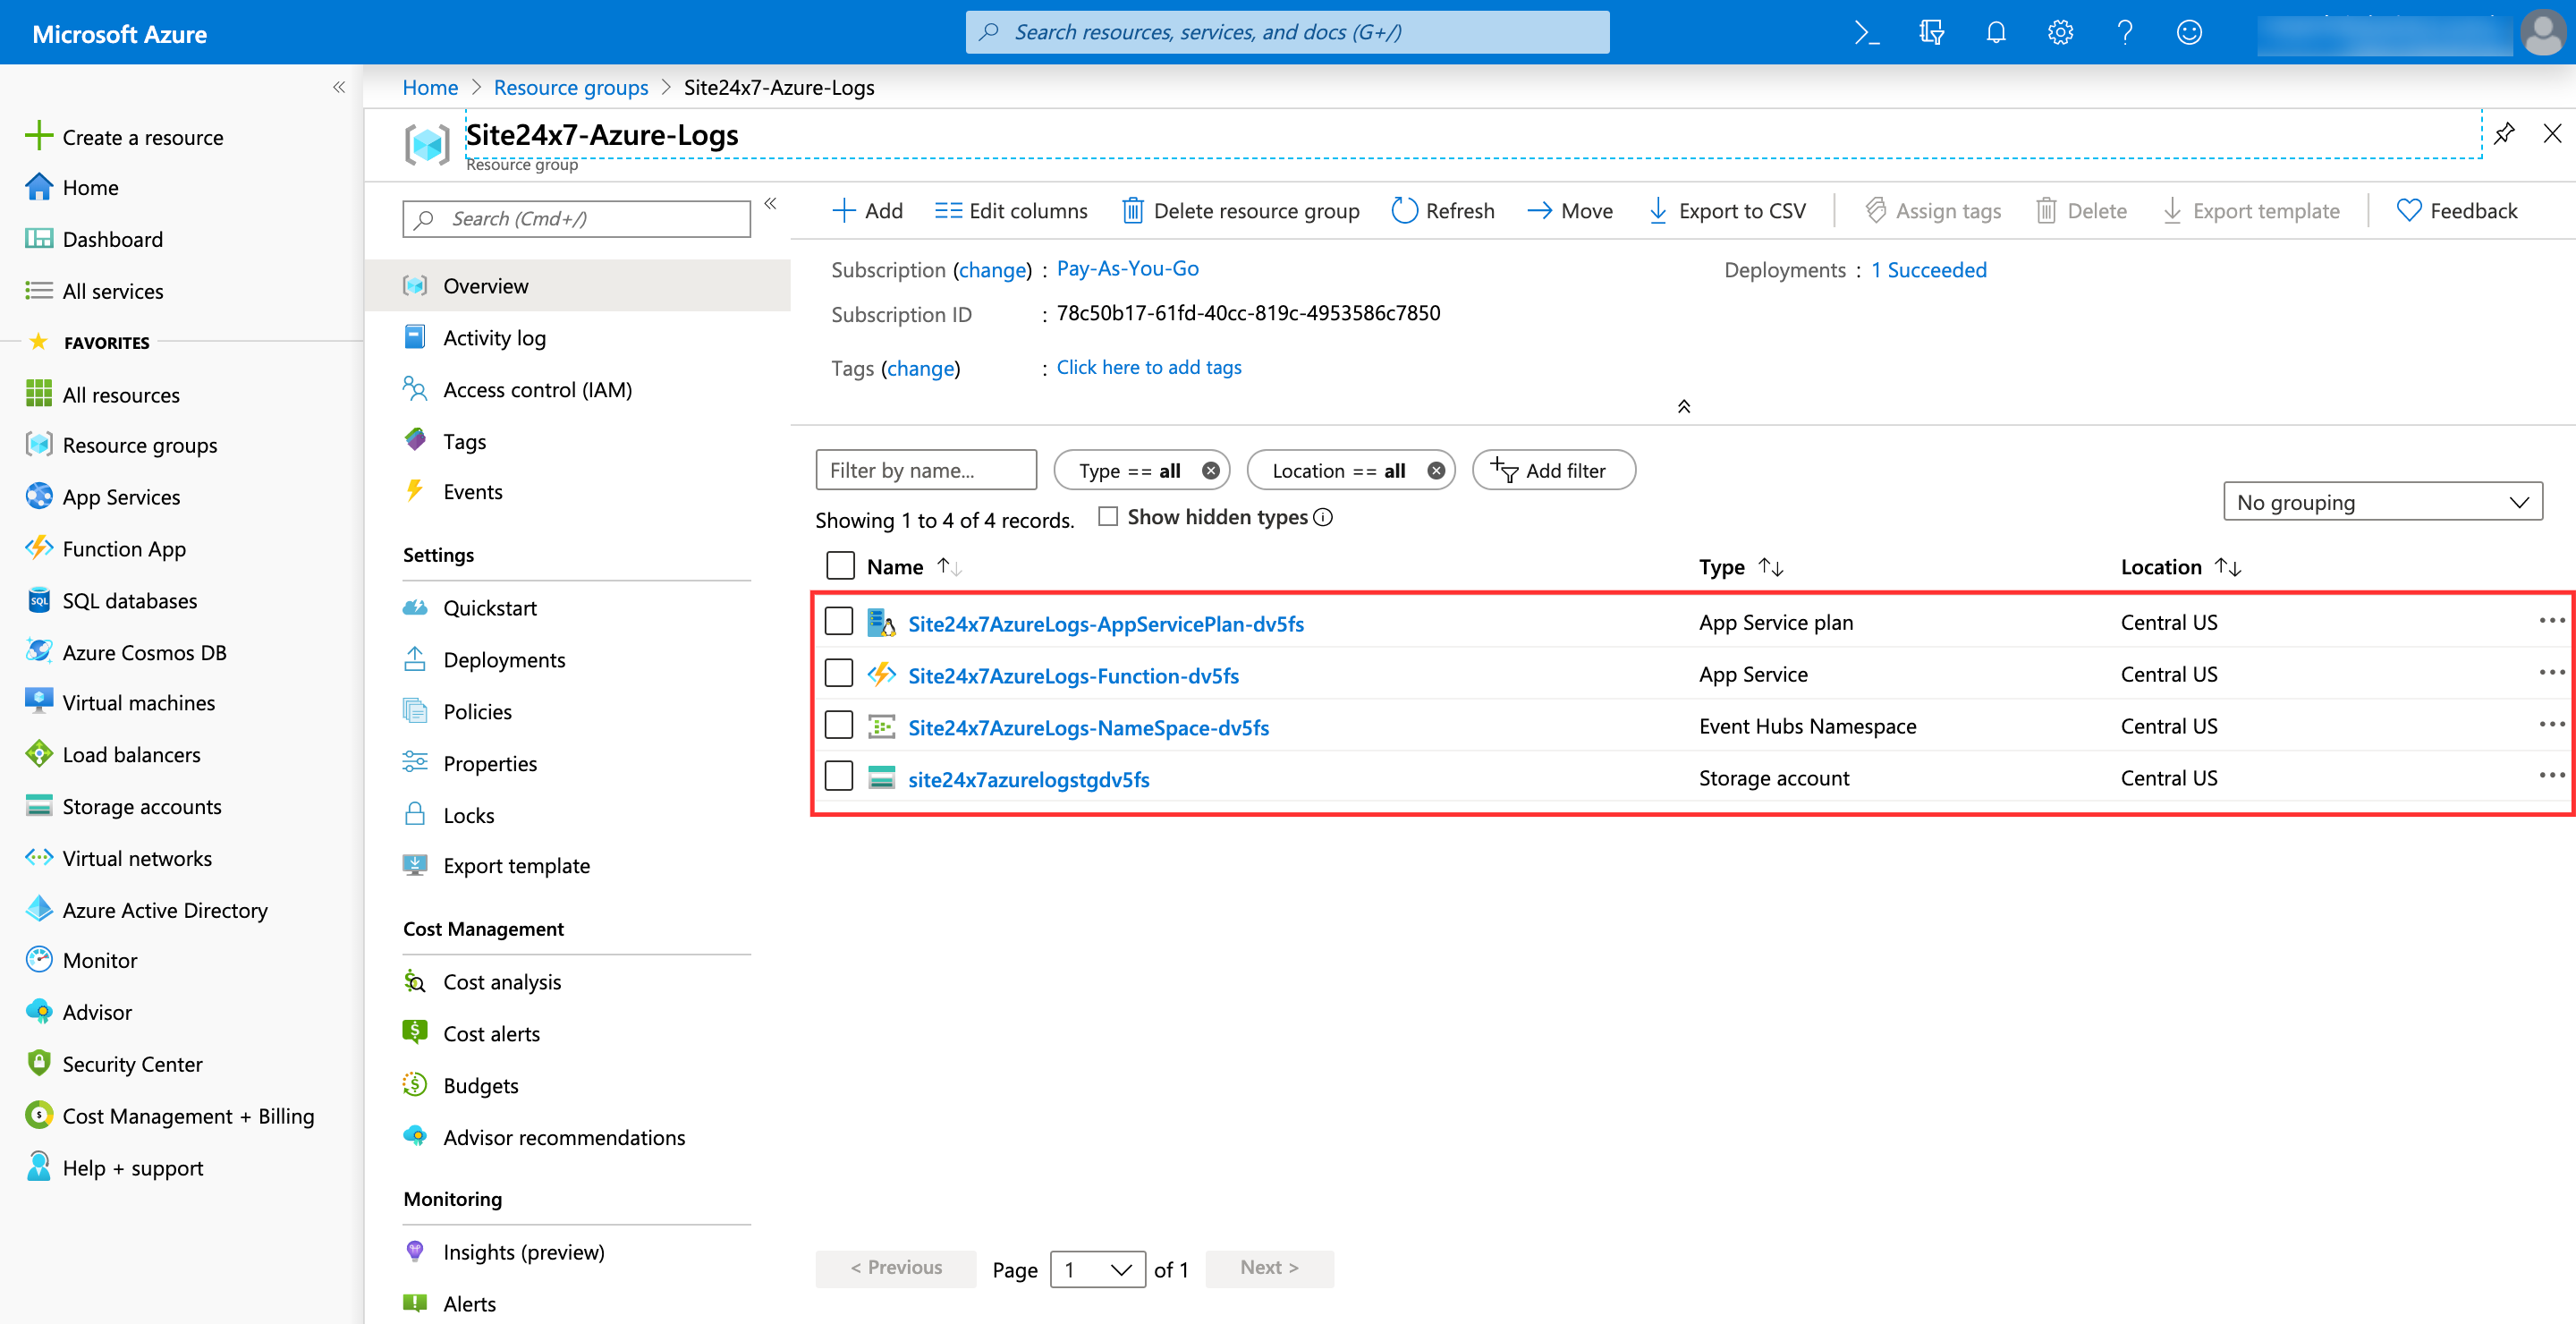
- Click on the Function App from the list of resources.
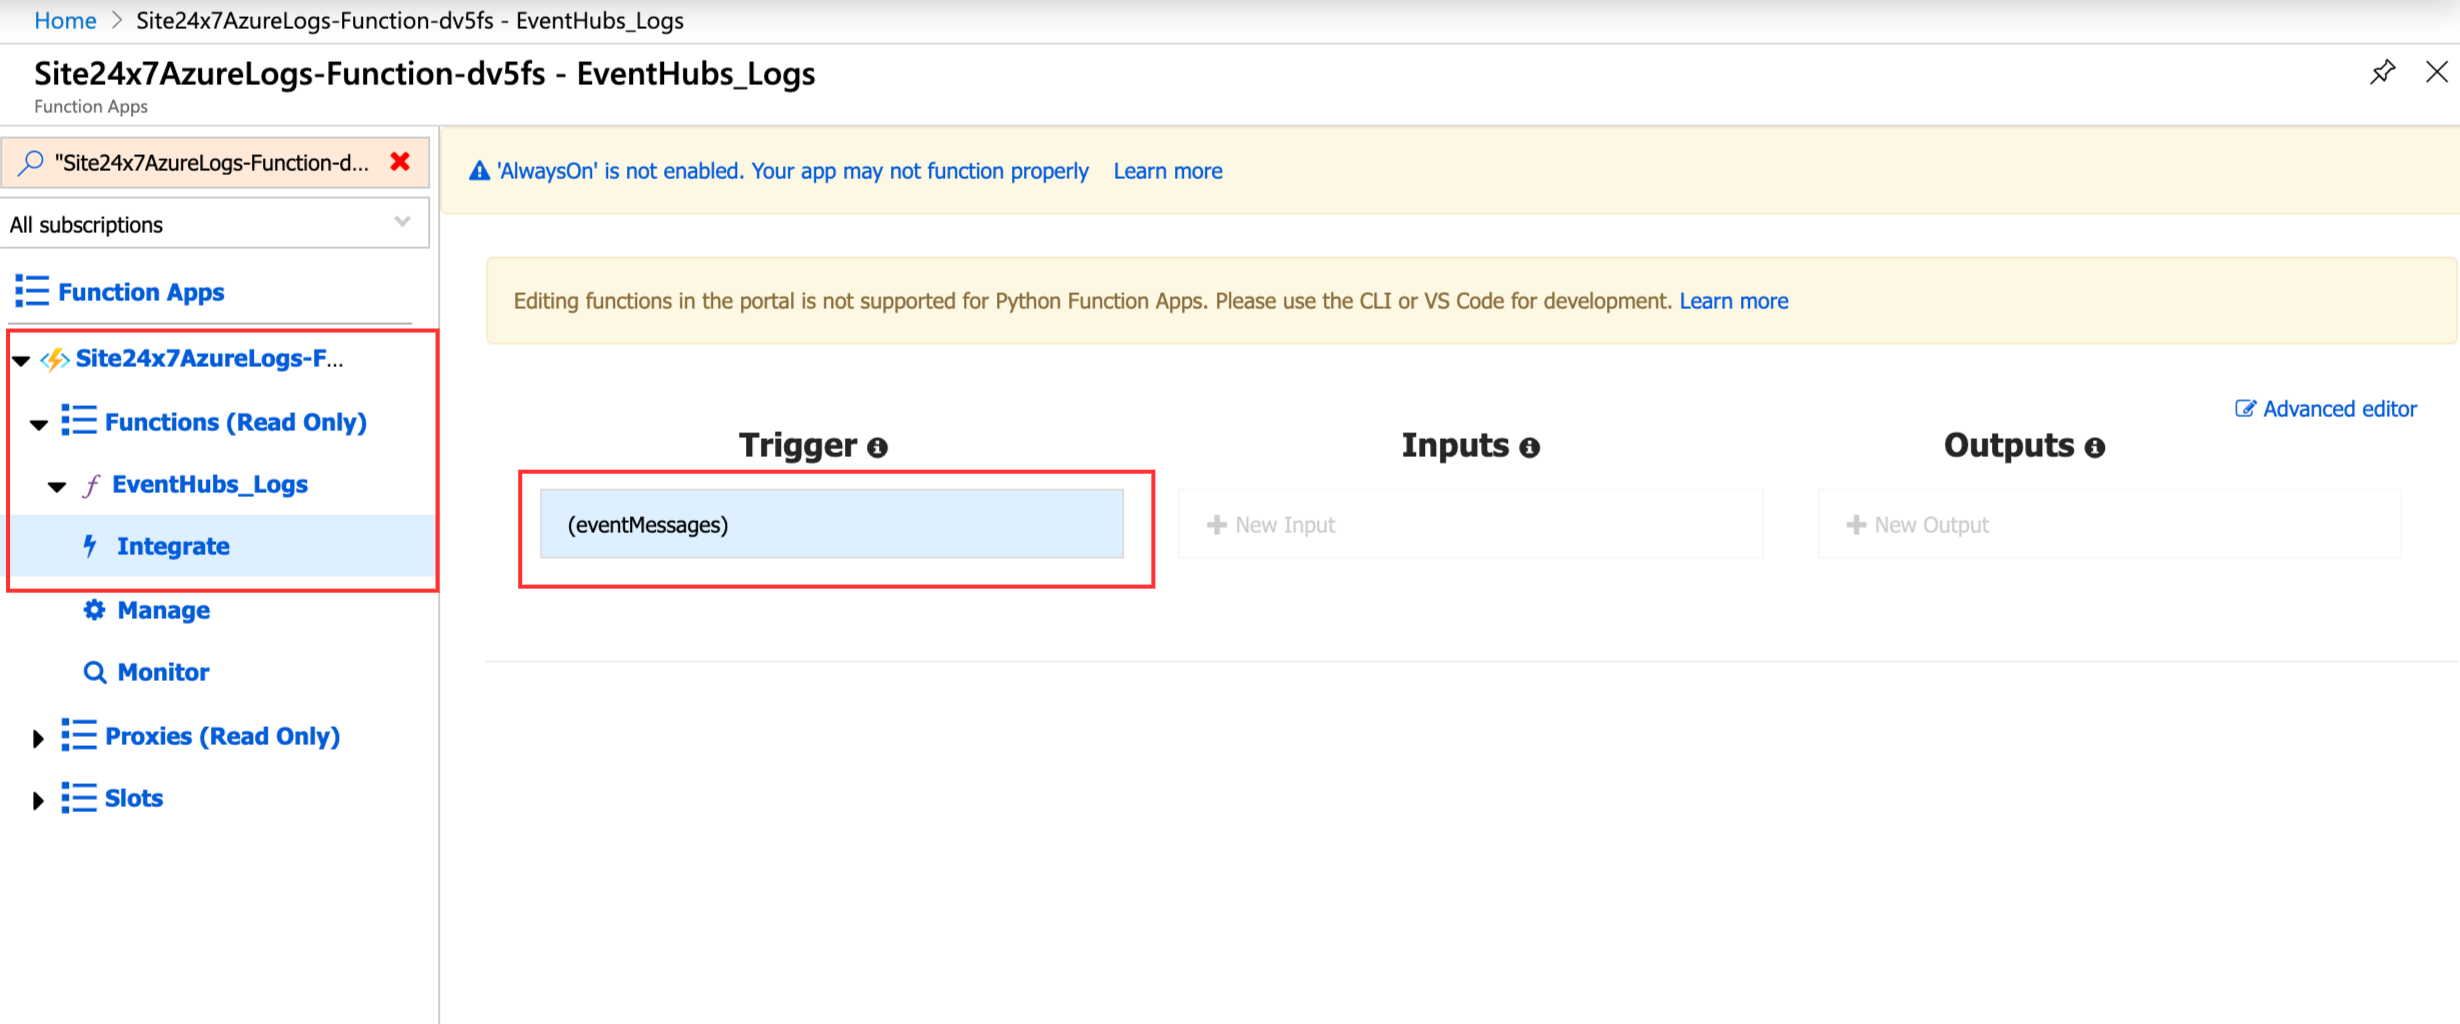
- On the Function App blade, click Functions (Read Only) > EventHubs_Logs > Integrate.
- Verify if the value of the Trigger field is (eventMessages).
- Verify if you've entered the Log Type Config string correctly in Step 8 above.
Verifying if Event Hubs is receiving logs
- From the home page of your Azure portal, go to Event Hubs.
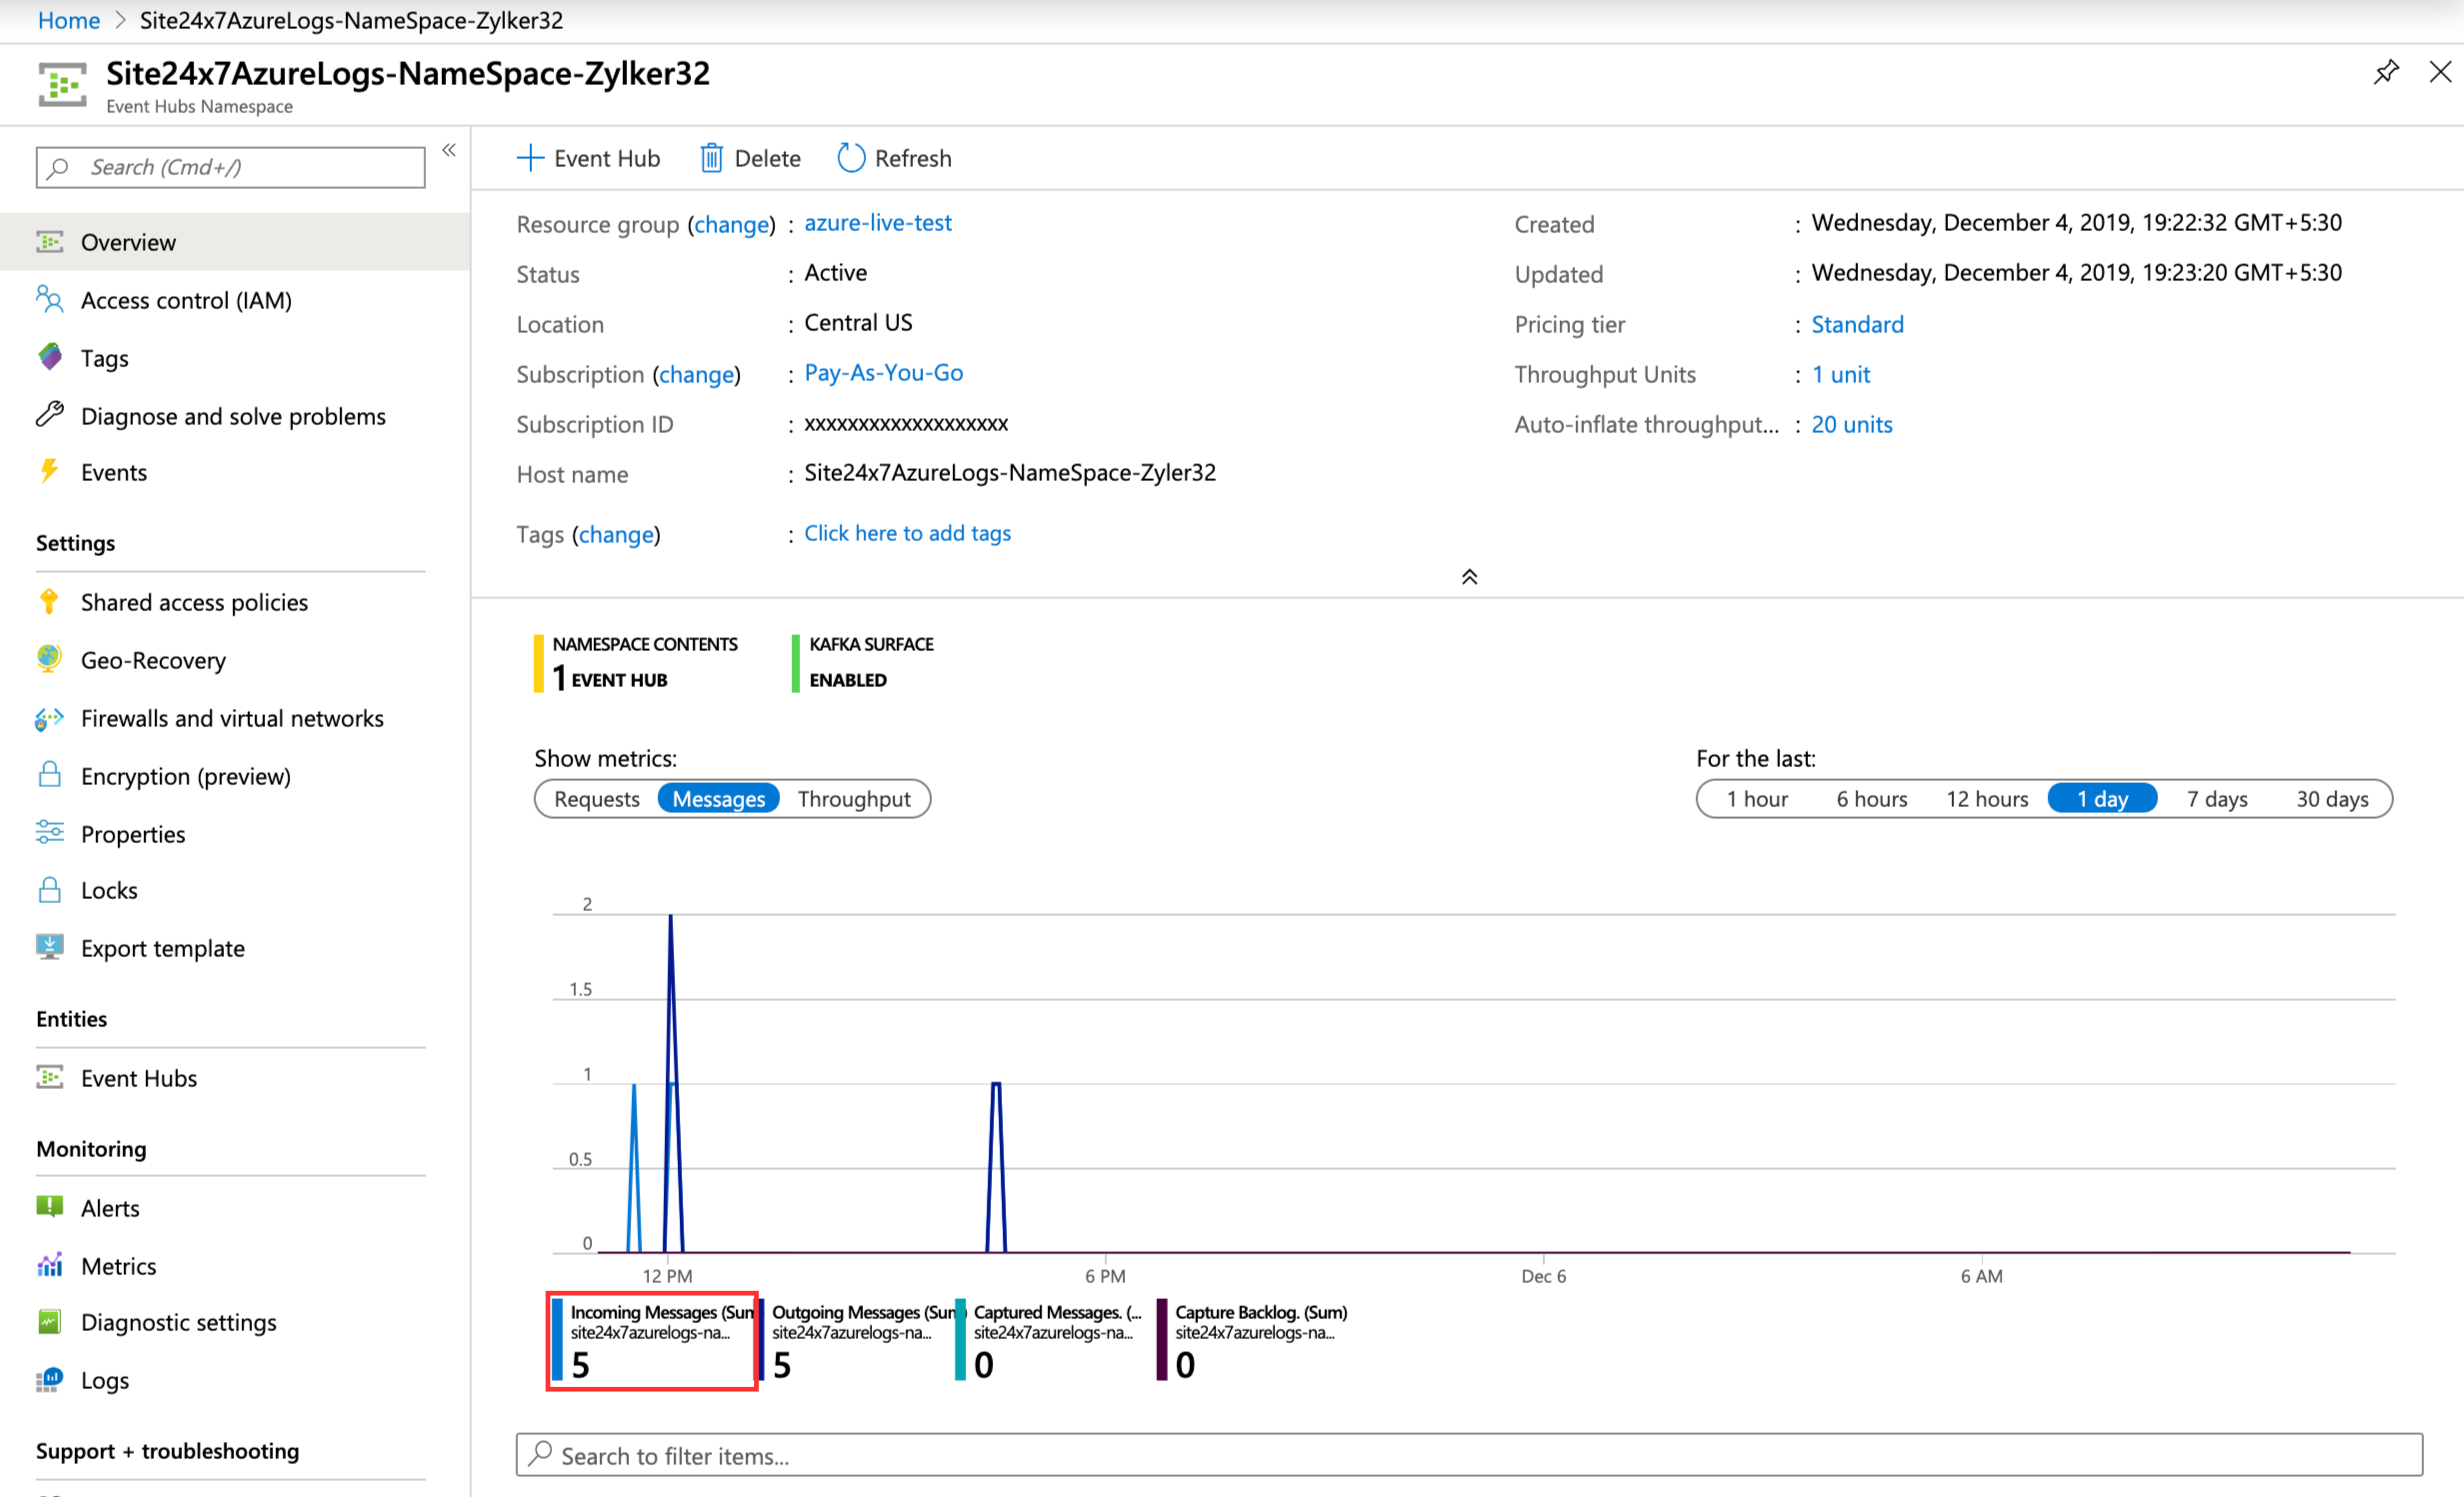
- Click your event hub; under Show metrics, toggle to Messages.
- In the message summary details that appear below the chart, verify that the Incoming Messages count is greater than zero.
Manually verifying if Azure functions are sending logs to Site24x7
Log in to Site24x7 and navigate to AppLogs. On the AppLogs Search window, search for Azure Diagnostics Logs.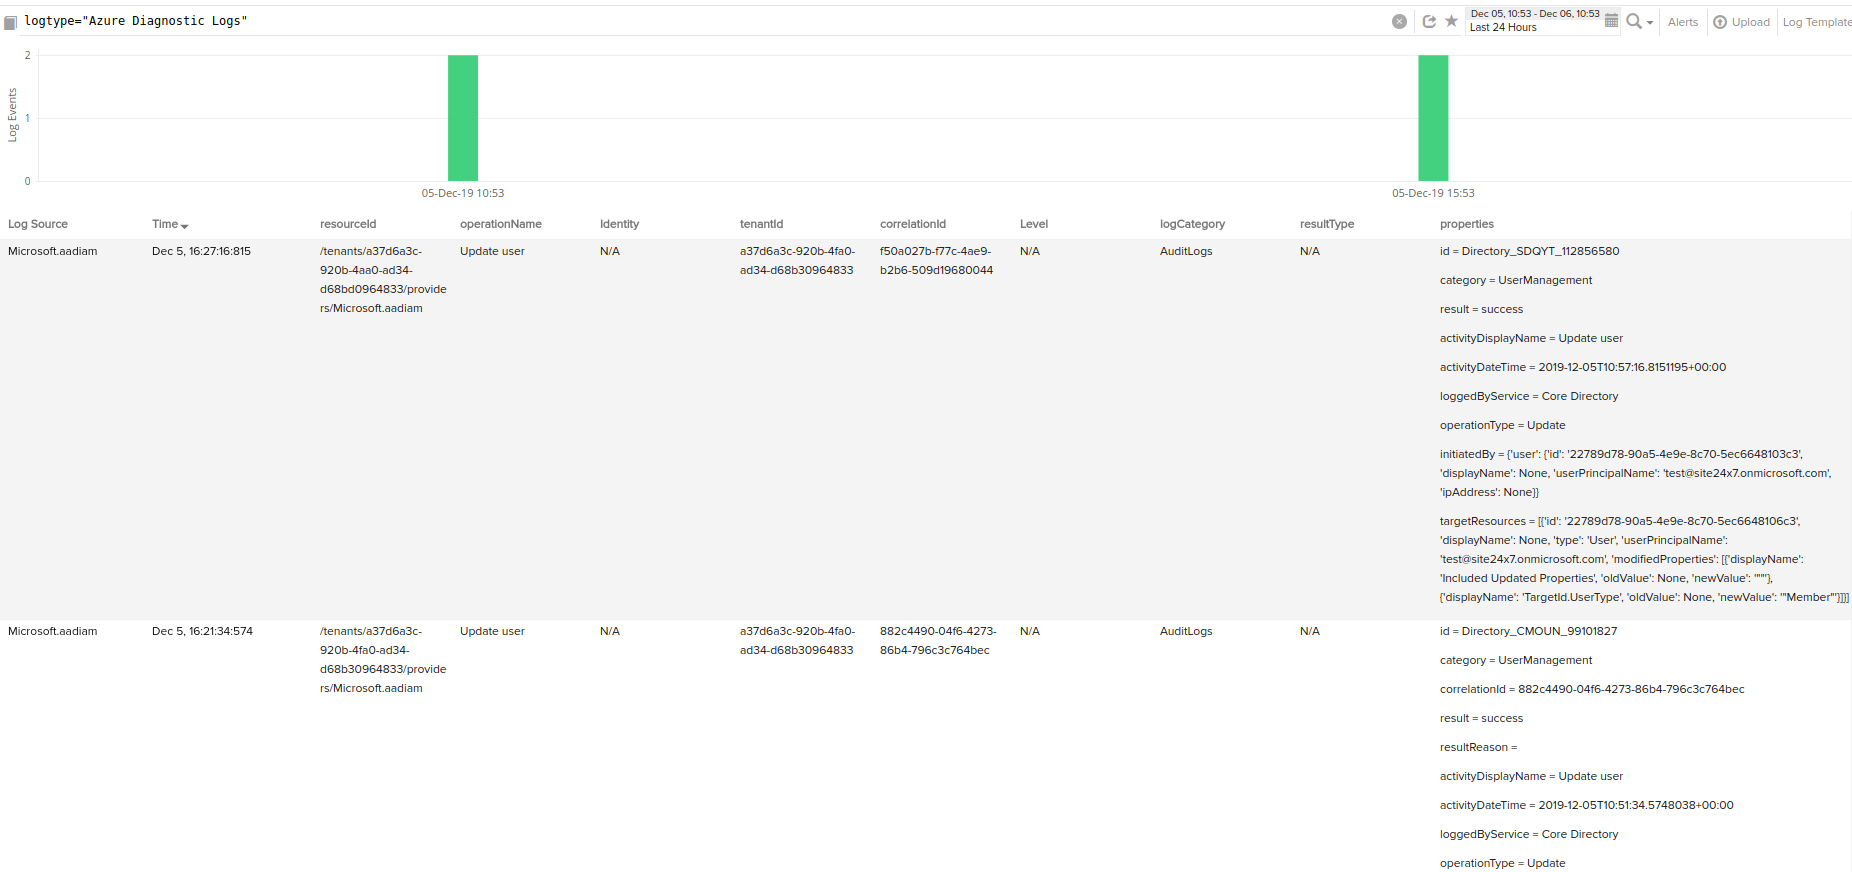
If the above verifications fail, you can contact support@site24x7.com.
ARM templates are reusable with multiple Azure services
You can create one ARM template, and use it in all other Azure services.
For example, let's say the logs that need to be collected from two different Azure services are App Services and Kubernetes Services. This can be achieved in single ARM template:
- Create two different Log Types, AppServiceHTTPLogs and Azure-Kube-ApiServerLogs, with appropriate Sample Logs and Log Patterns.
- Create two different Log Profiles configured with respective Log Types. In other words, the Log Type AppServiceHTTPLogs should be configured in the AppServiceHTTPLogs Log Profile, and the Log Type Azure-Kube-ApiServerLogs should be configured in the Azure-Kube-ApiServerLogs Log Profile.
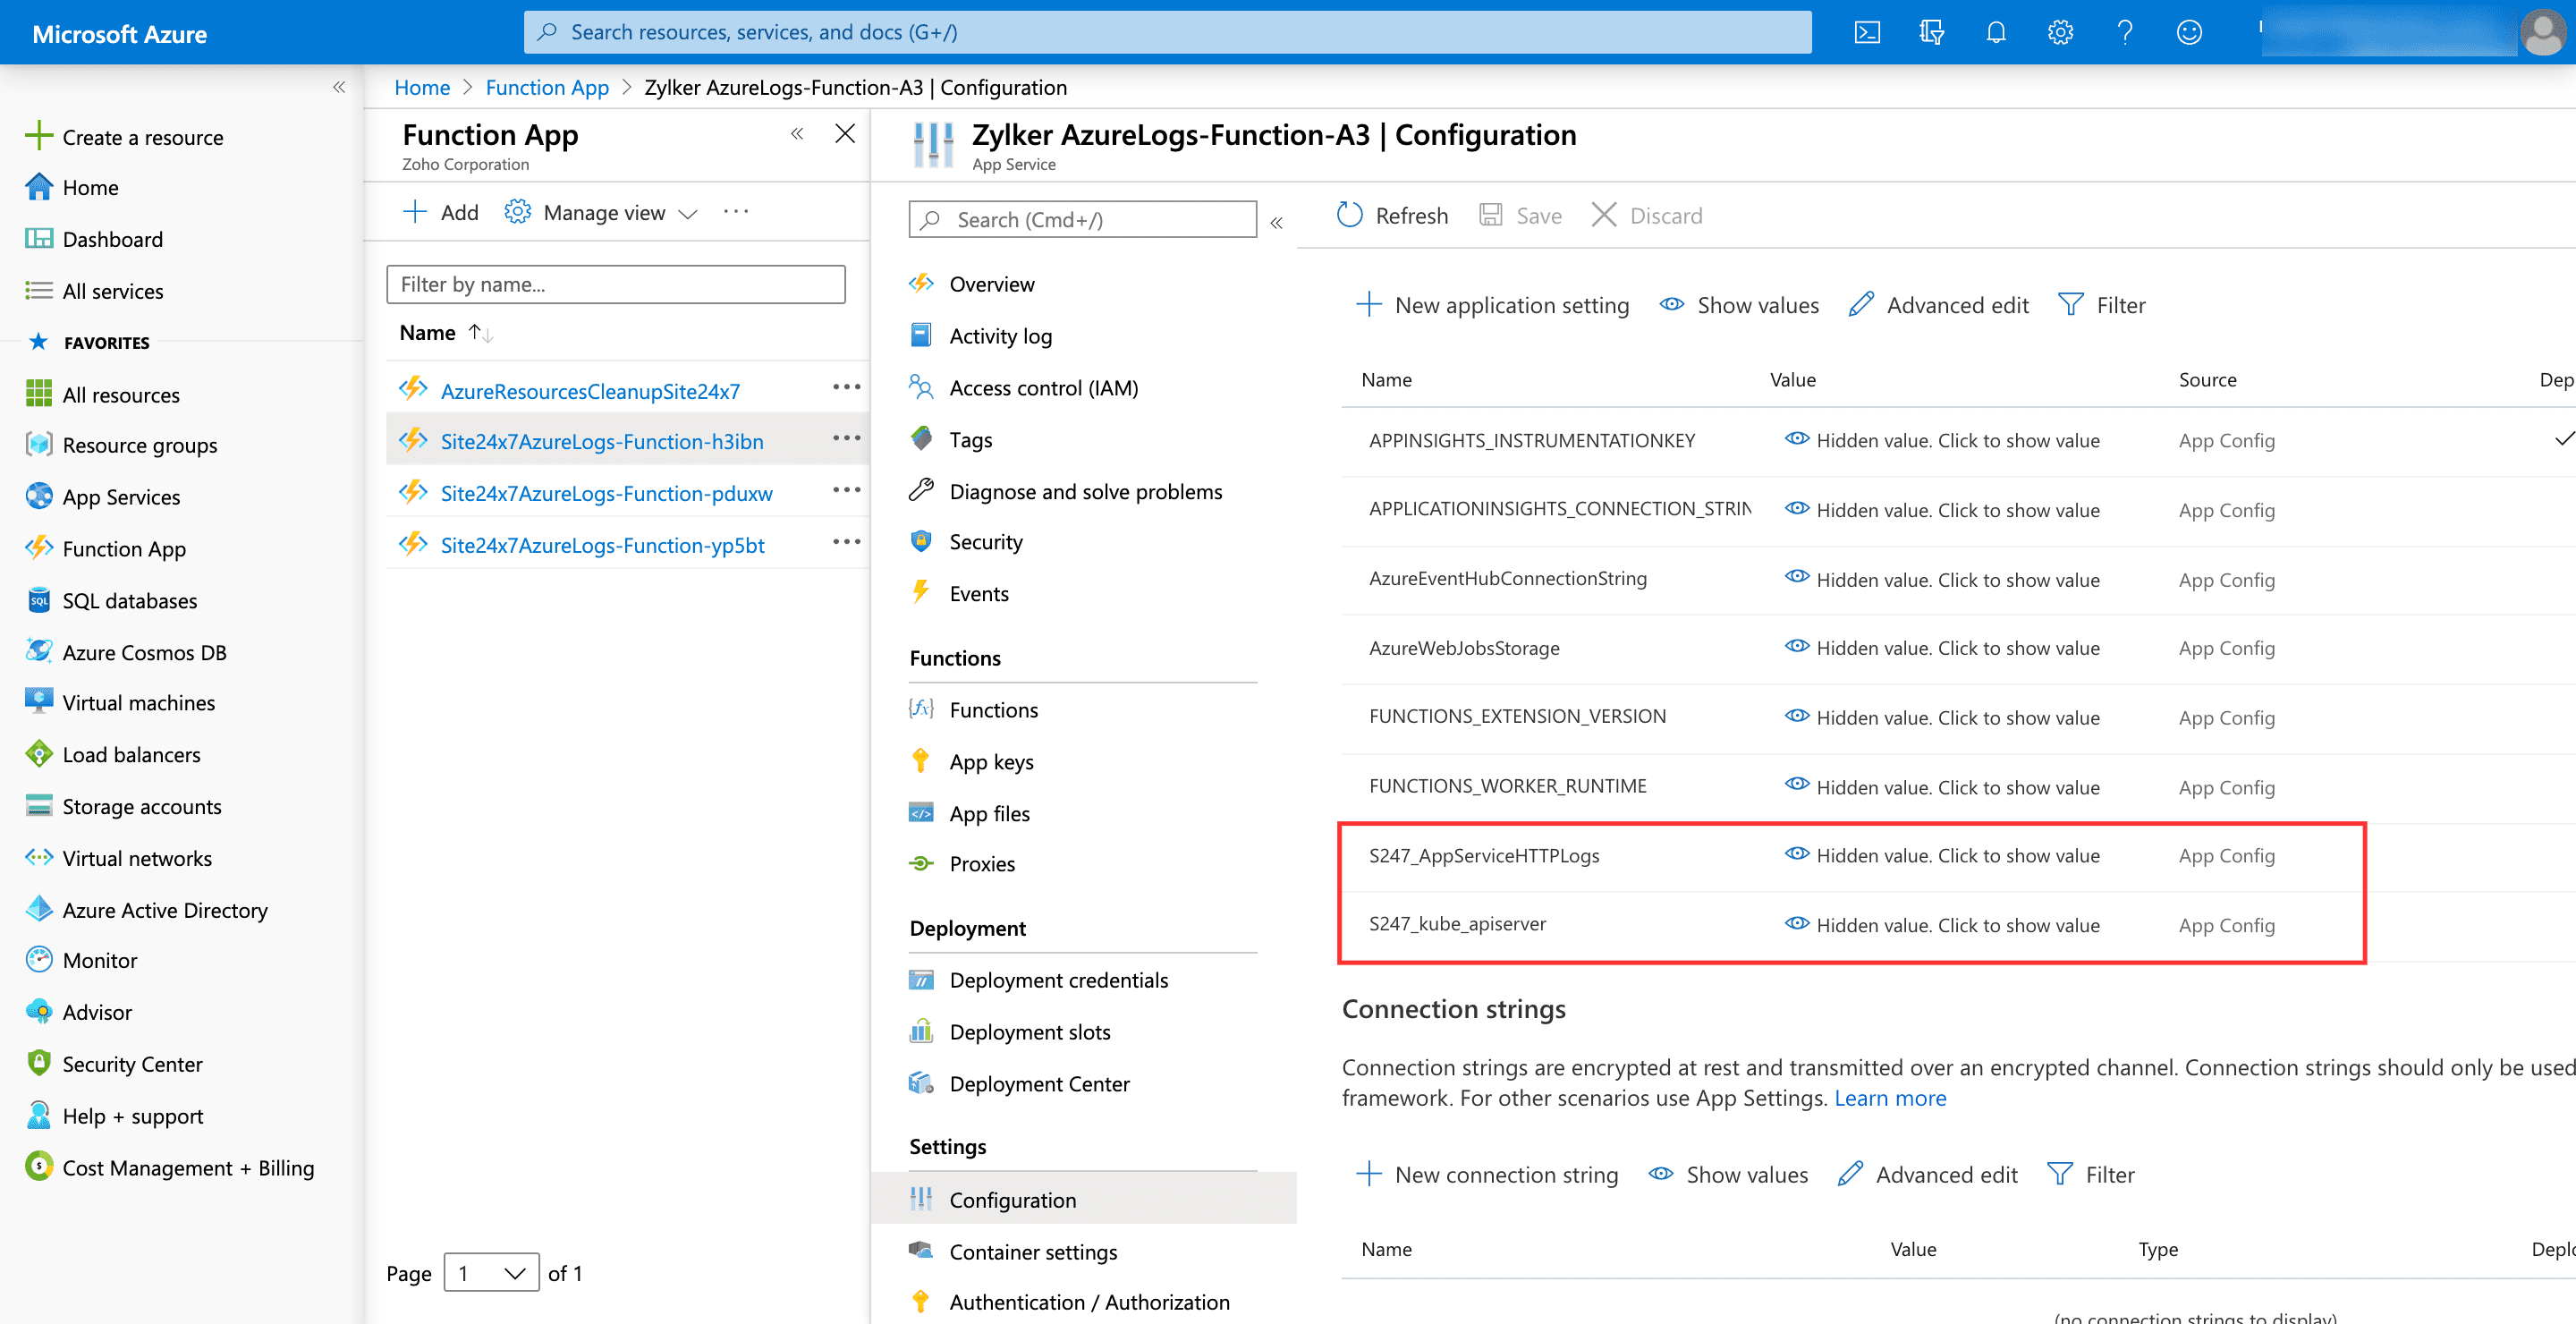
- Configure the value of the logTypeConfig variable from the two different Log Profiles as two different variables in the same Function App under Application Settings.
- Go to the Function App in which the ARM is configured.
- From the left pane, go to Configuration under Settings.
- On the Configuration blade, click New application setting.
- Give the variables an appropriate Name (S247_<ActualLogName>) and Value (logTypeConfig value available in the respective Log Profiles).
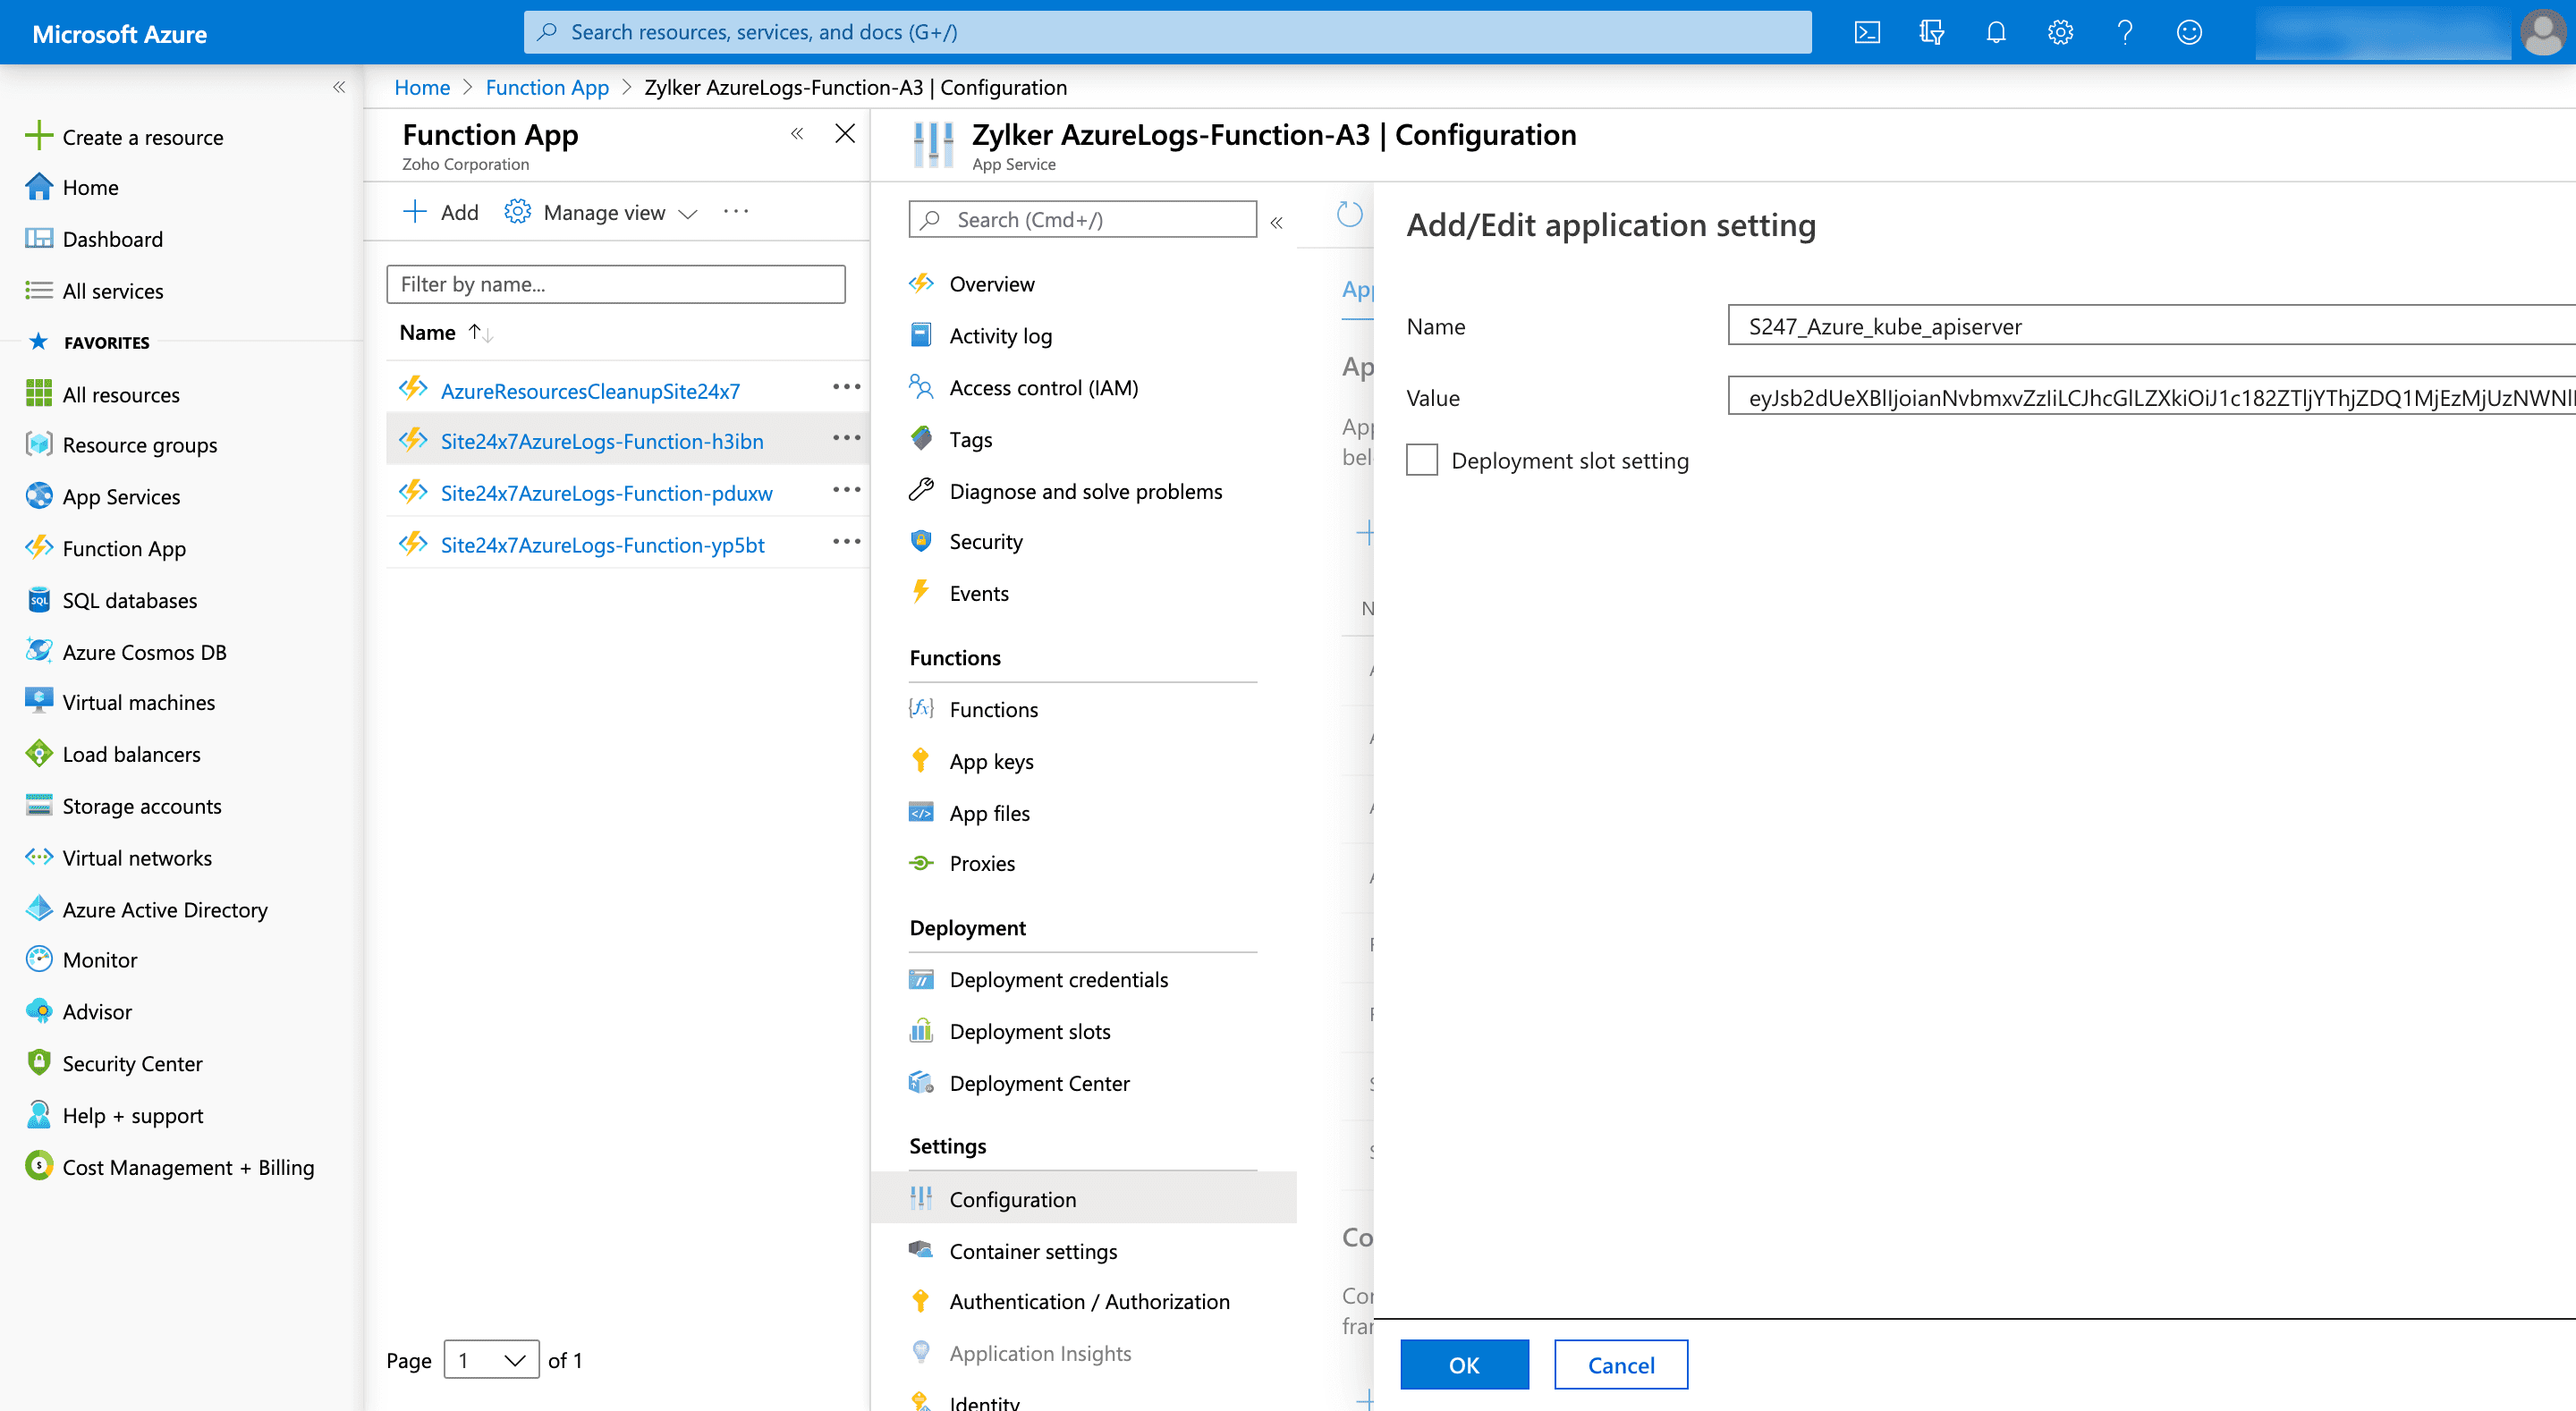
Example:
Name: S247_kube_apiserver
Vaule: xxxxxxxxxxxxxxxxxxxxxxxxxxxx (logtypeconfig value of log profile 'Azure-Kube-ApiServerLog Profile')
Note:
- The Name should not have a hyphen (-) in it.
- The Name should starts with S247_.
- The Name format should be S247_<ActualLogName> where <ActualLogName> is the name of the log that you have to select in those Azure services under Diagnostic Setting.
Example: S247_kube_apiserver, S247_AppServiceHTTPLogs - If the Log Type in the Azure portal has a hyphen (-), replace it with an underscore (_).
Example: If the Log Name available in Kubernetes Services is kube-apiserver, change it to S247_kube_apiserver while configuring the Log Profile in Site24x7.
Multiple Log Types for the same Azure service
To configure multiple Log Types for the same Azure service:
- Go to the service, and then its Diagnostic settings.
- Click Add diagnostic settings, and create multiple diagnostic settings in that particular service with the desired Log Type. You can choose the Log Type by checking the box next to the particular Log Type.
- Choose Steam to an event hub under Destination details, and follow steps 5-8 in the Pushing logs from the Azure monitor to Event Hubs section above.
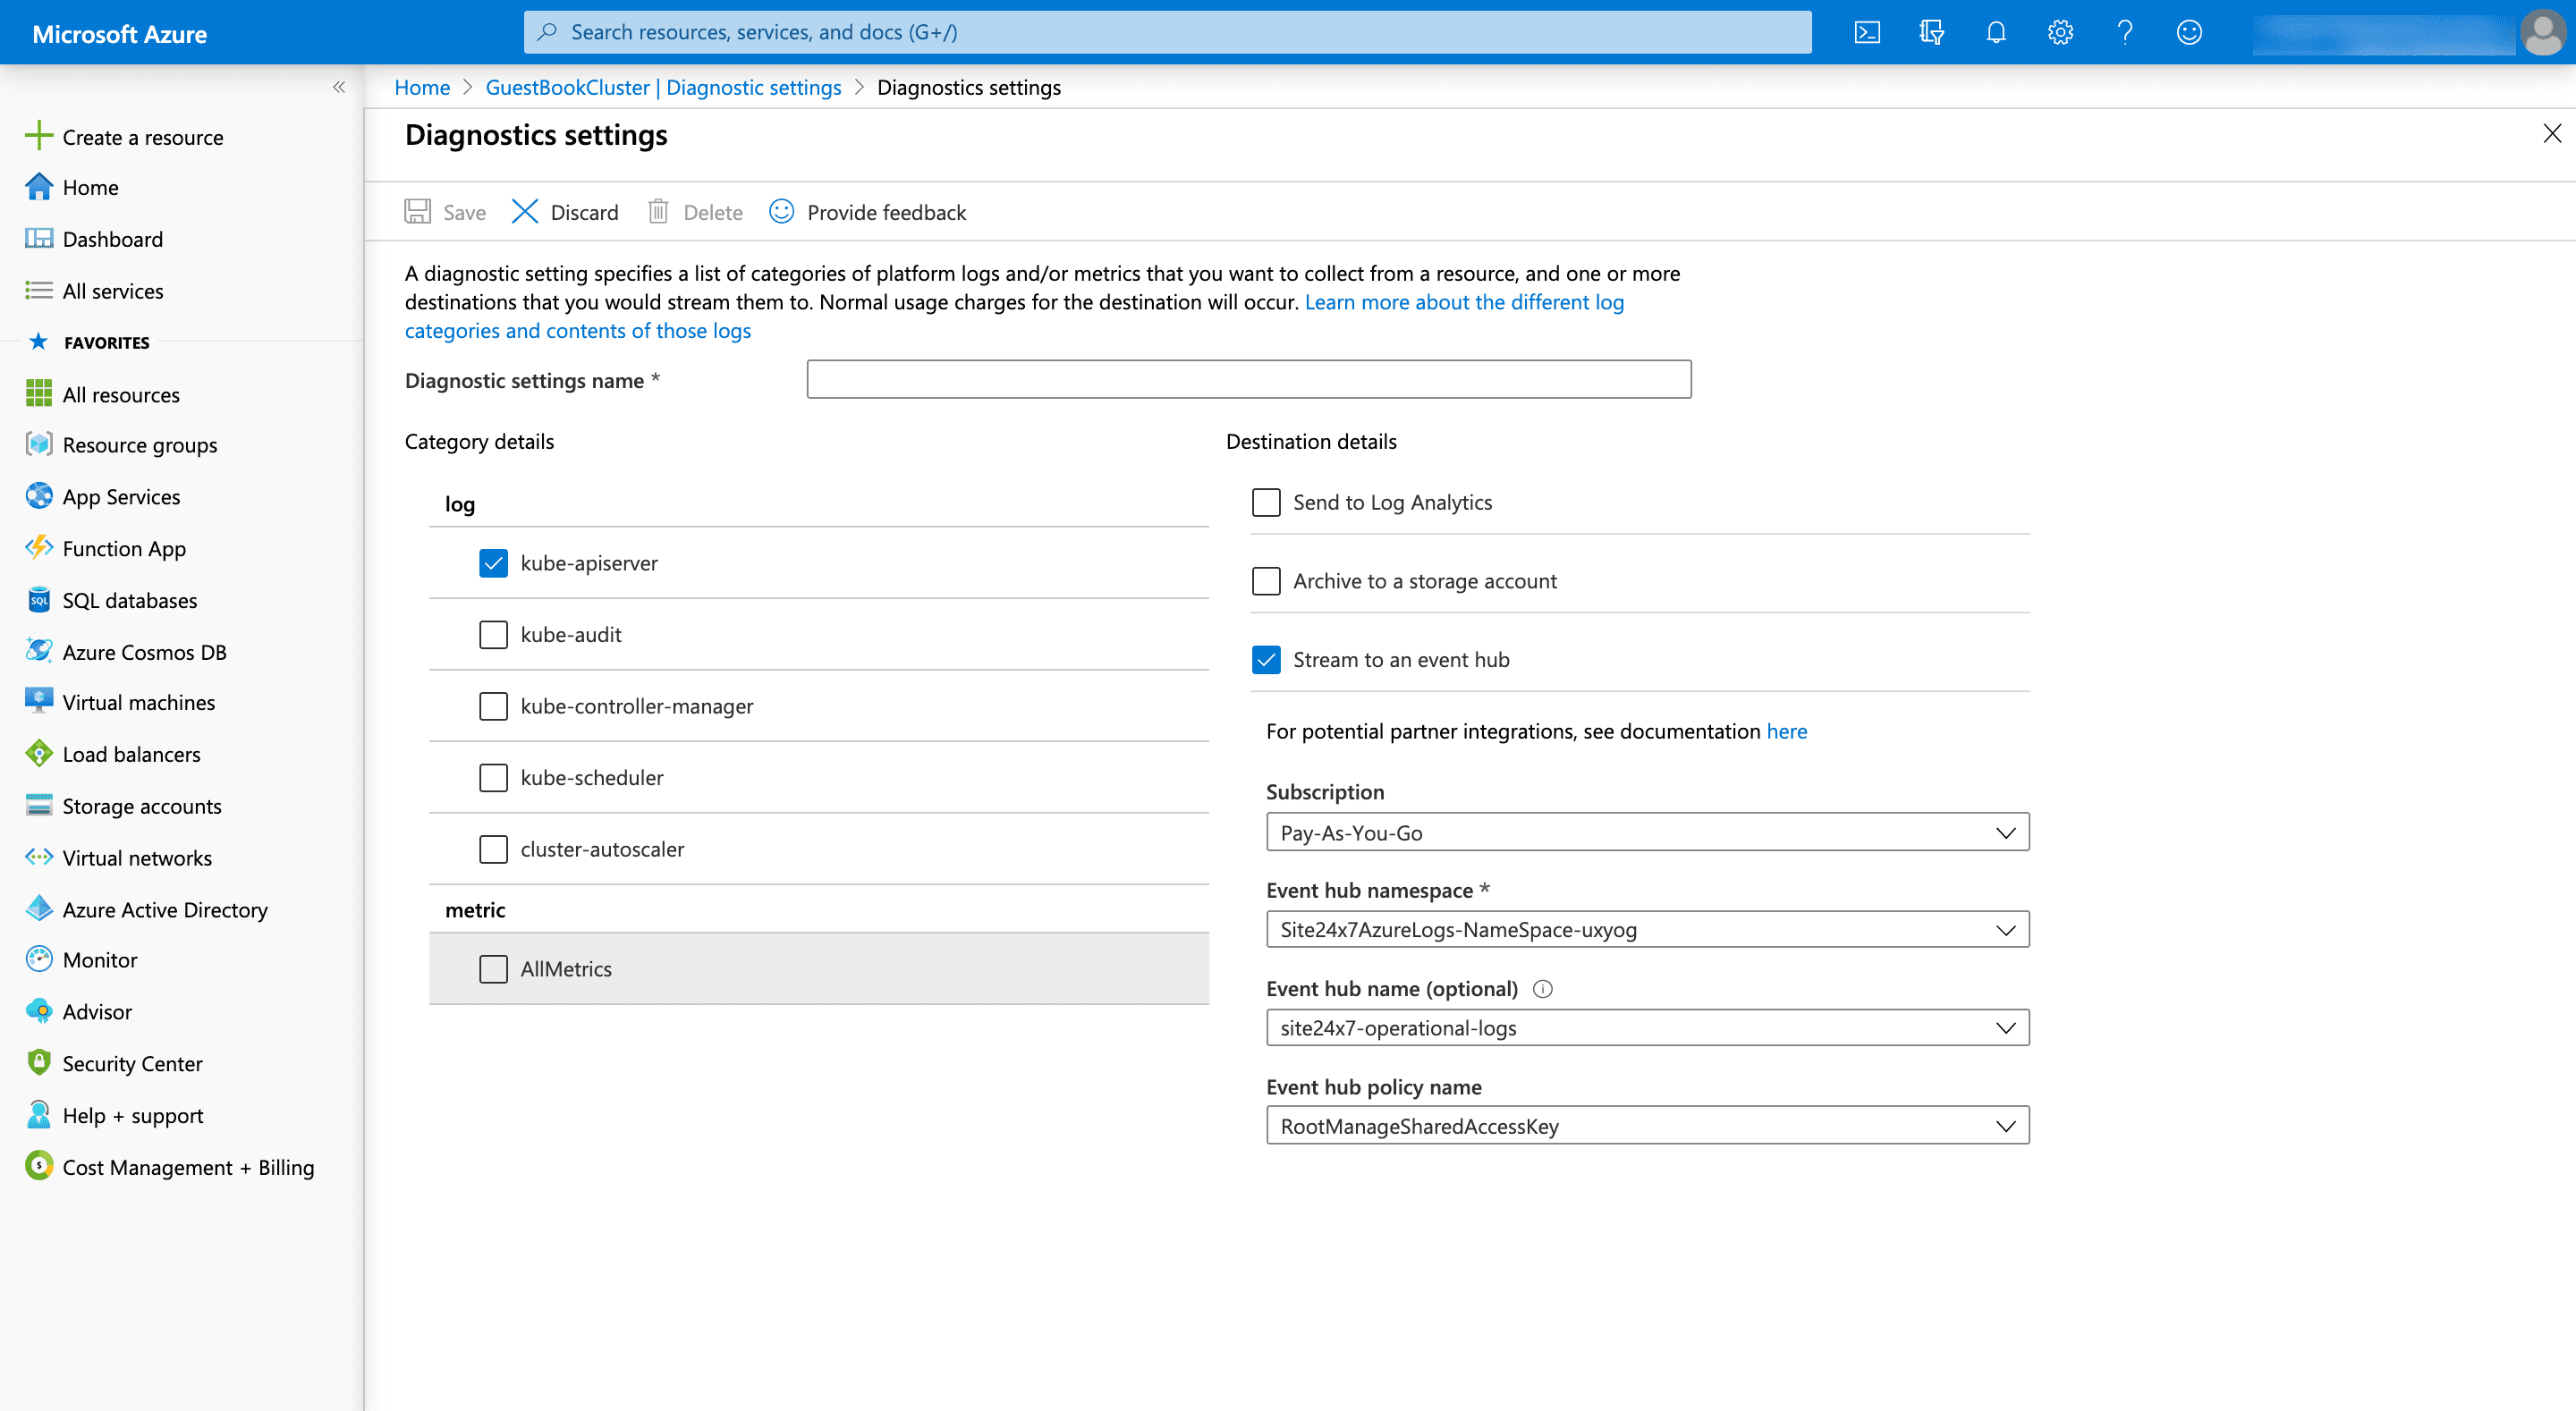
Log Patterns for Log Types in Azure service
To learn about the Log Patterns for different Log Types available in Azure services, refer to Azure's documentation. Refer to this documentation, and configure the Log Pattern for the respective Log Types.
Example: The Log Pattern of AppServiceConsoleLogs can be defined by the Category, Host, Level, ResourceId, ResultDescription, SourceSystem, TenantId, TimeGenerated, and Type fields.
From these fields, the Log Pattern for AppServiceConsoleLogs is configured as:
json $resourceId as ResourceId$ $operationName$ $category as LogCategory$ $time as Time:date:yyyy-MM-dd'T'HH:mm:ss.SSS'Z'$ $properties.Host as Host$ $properties.Level as Level$ $properties.ResultDescription as ResultDescription$ $properties.SourceSystem as SourceSystem$ $properties.TenantId as TenantId$ $properties.Type as Type$
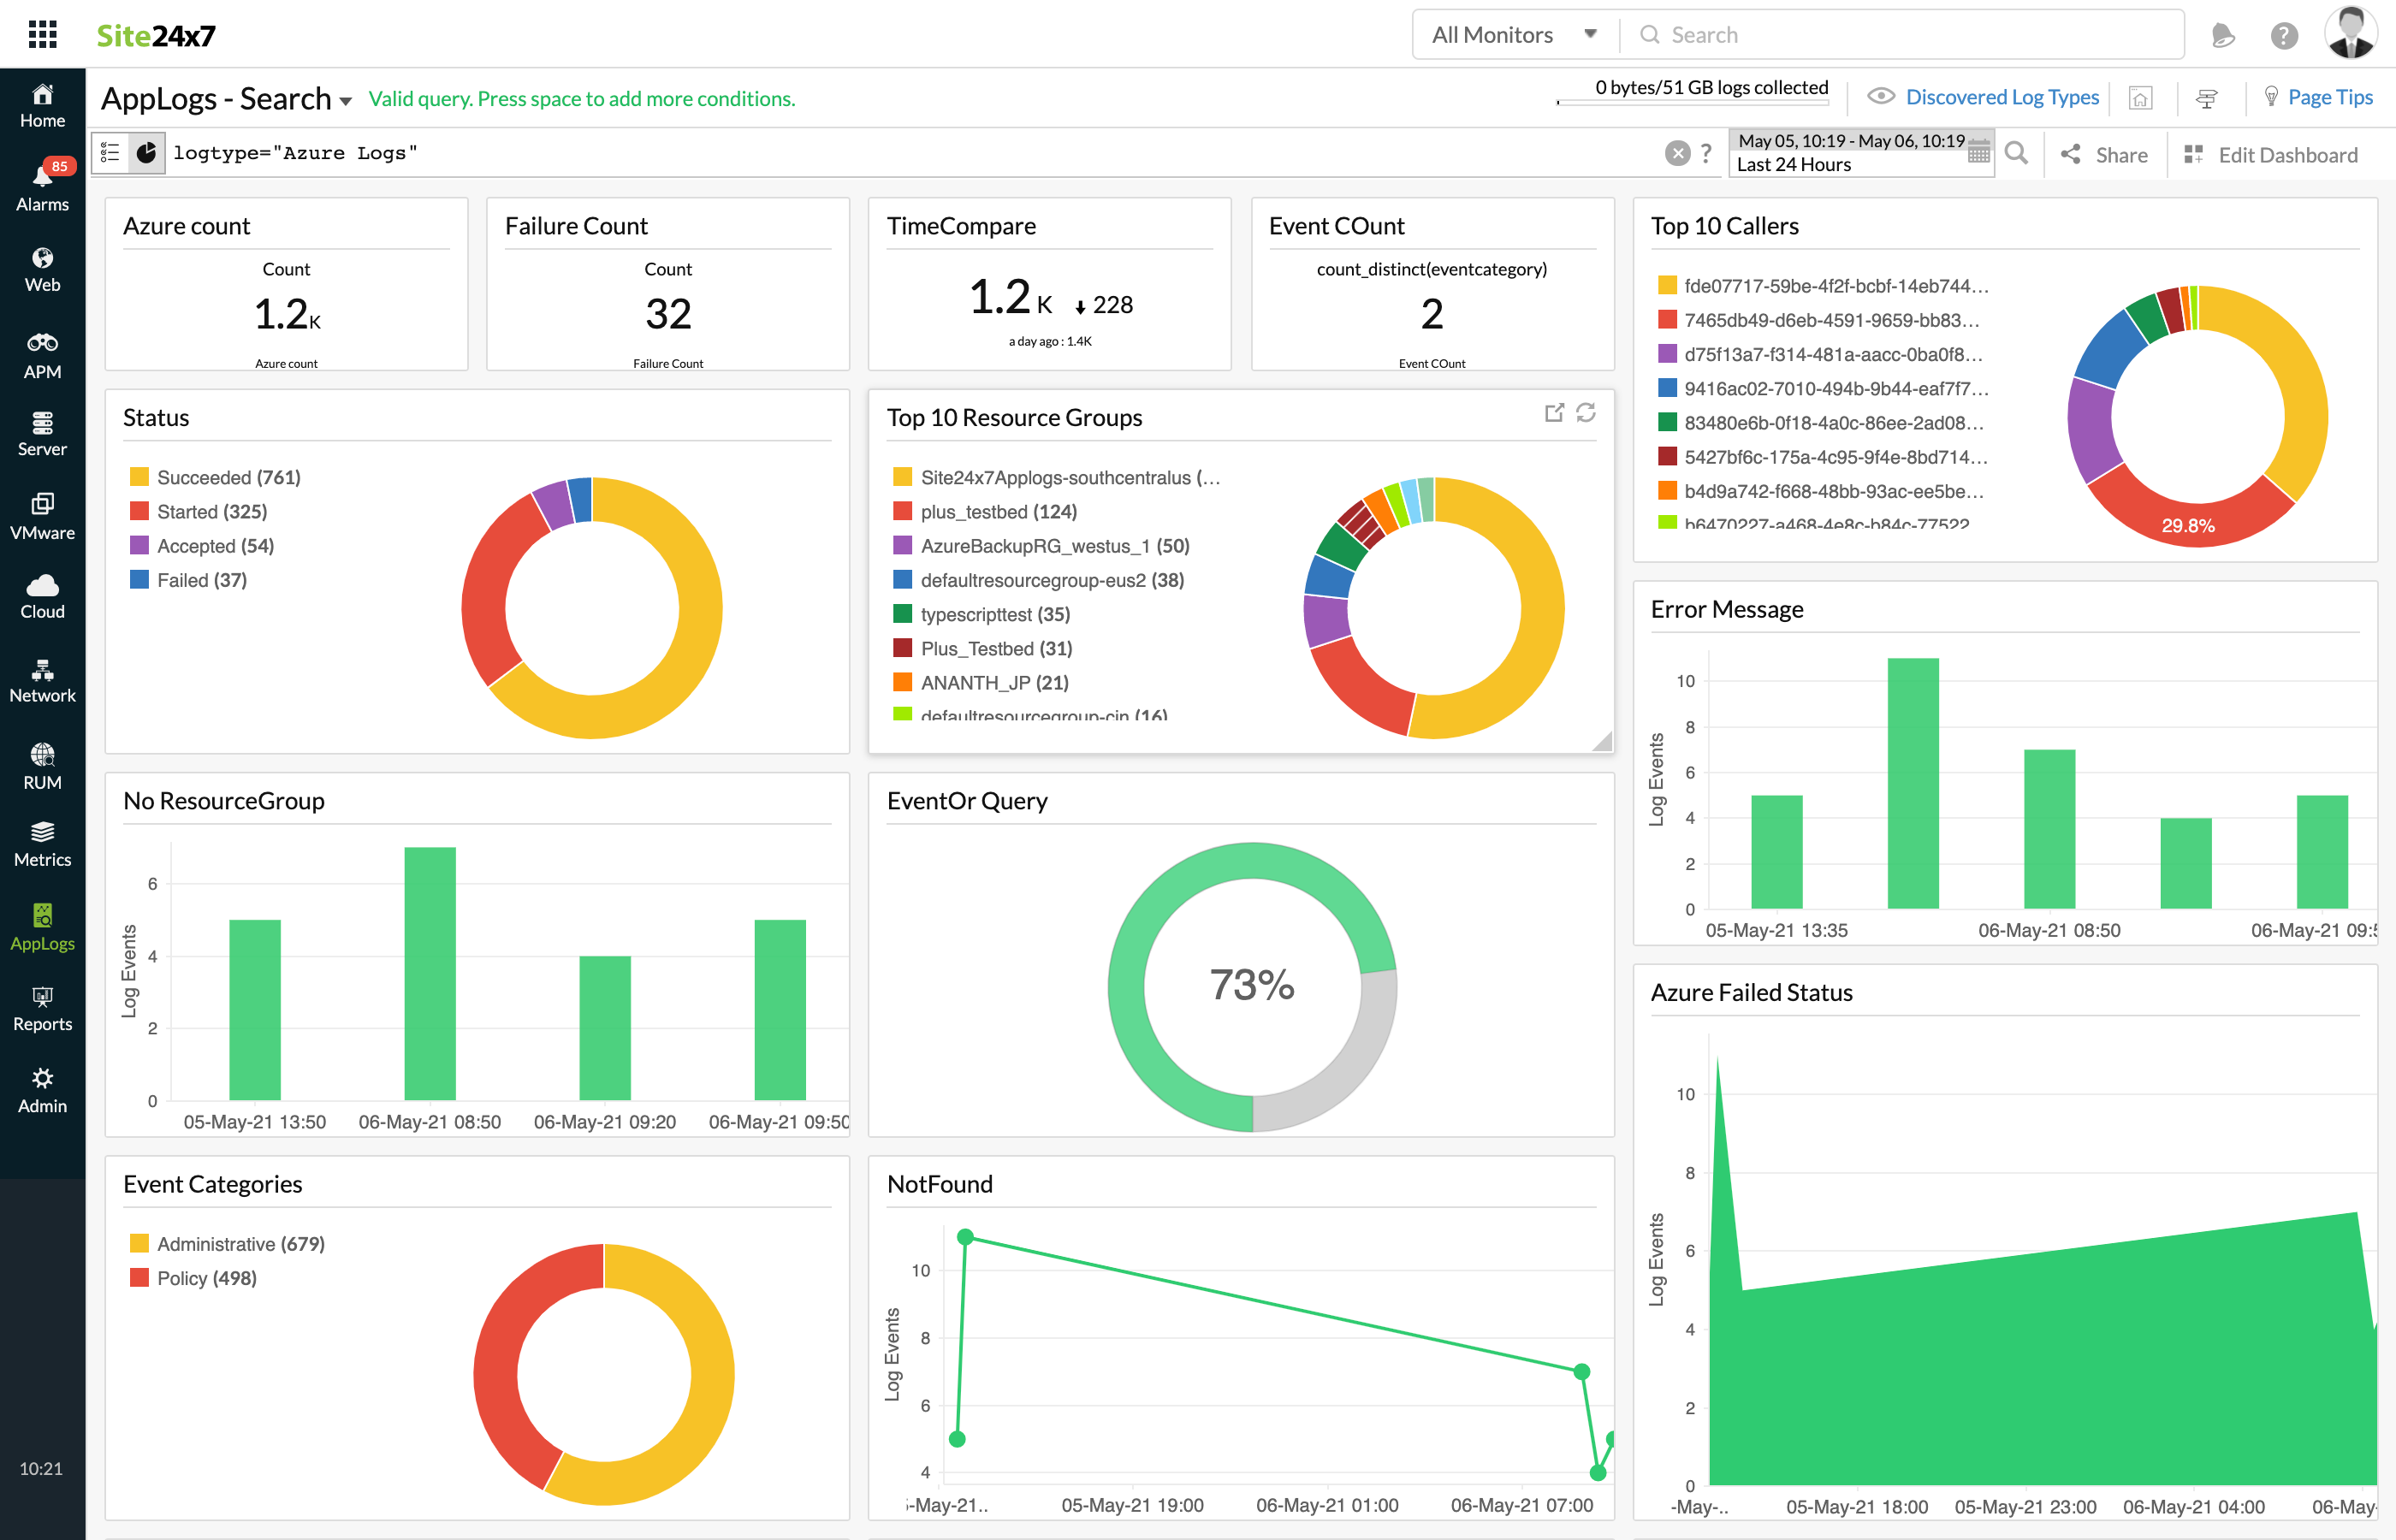
Azure Diagnostic logs dashboard
AppLogs creates an exclusive dashboard for every Log Type, and shows a few widgets by default. Here's a list of the widgets available in the Azure Diagnostic logs dashboard:
- Operation Stats
- Log Category Stats
- Resource Group Stats
