Azure NSG flow logs
NSG flow logs, a feature of Azure Network Watcher, help you track details of IP traffic within a network security group. Configure network security group (NSG) flow logs to be sent to AppLogs to monitor, analyze, and visualize network traffic in your Azure environment.
Configuring log collection
This involves the following three steps:
- Configuring NSG flow to send logs to the Azure Blob Storage account
- Creating a log profile in Site24x7
- Connecting your Azure Blob Storage account to Site24x7
Step 1
Configure the NSG flow to send logs to the storage account by following the steps in this document.
Step 2
Create a log profile in Site24x7. From the Site24x7 web console, navigate to Admin > AppLogs > Log Profile > Add Log Profile, and enter the following:
- Profile Name: Enter a name for your log profile.
- Log Type: Choose Azure NSG Logs from the drop-down menu.
- Log Source: Choose Azure Functions.
- Click Save.
Step 3
- Log in to your Azure portal. Click the link below and fill in the details.
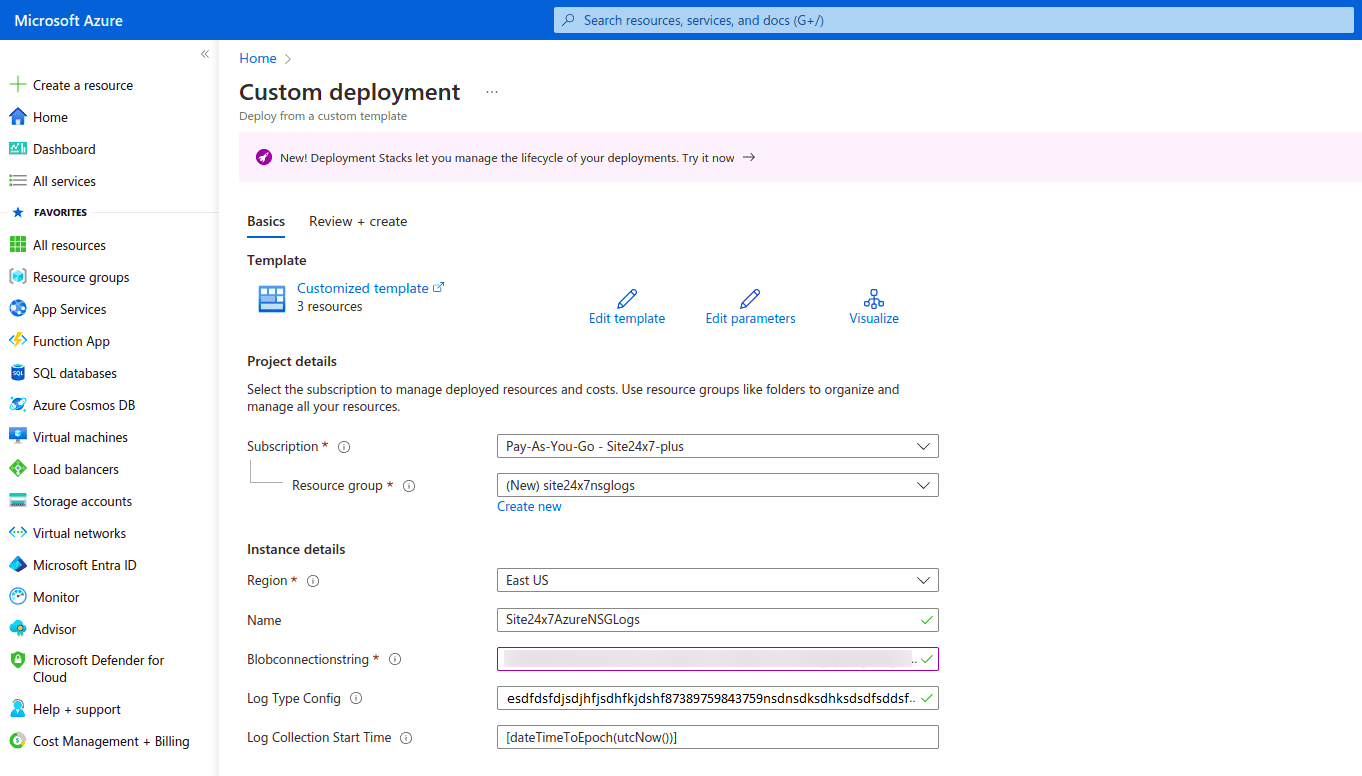
- On the Custom deployment page, enter the following under Basics:
- Subscription: Choose your subscription mode.
- Resource group: Create a new resource group with a name similar to Site24x7-Azure-Logs.
- Under Instance details:
- Region: Choose a location.
- Name: The function name will be prefilled. You don’t need to change it.
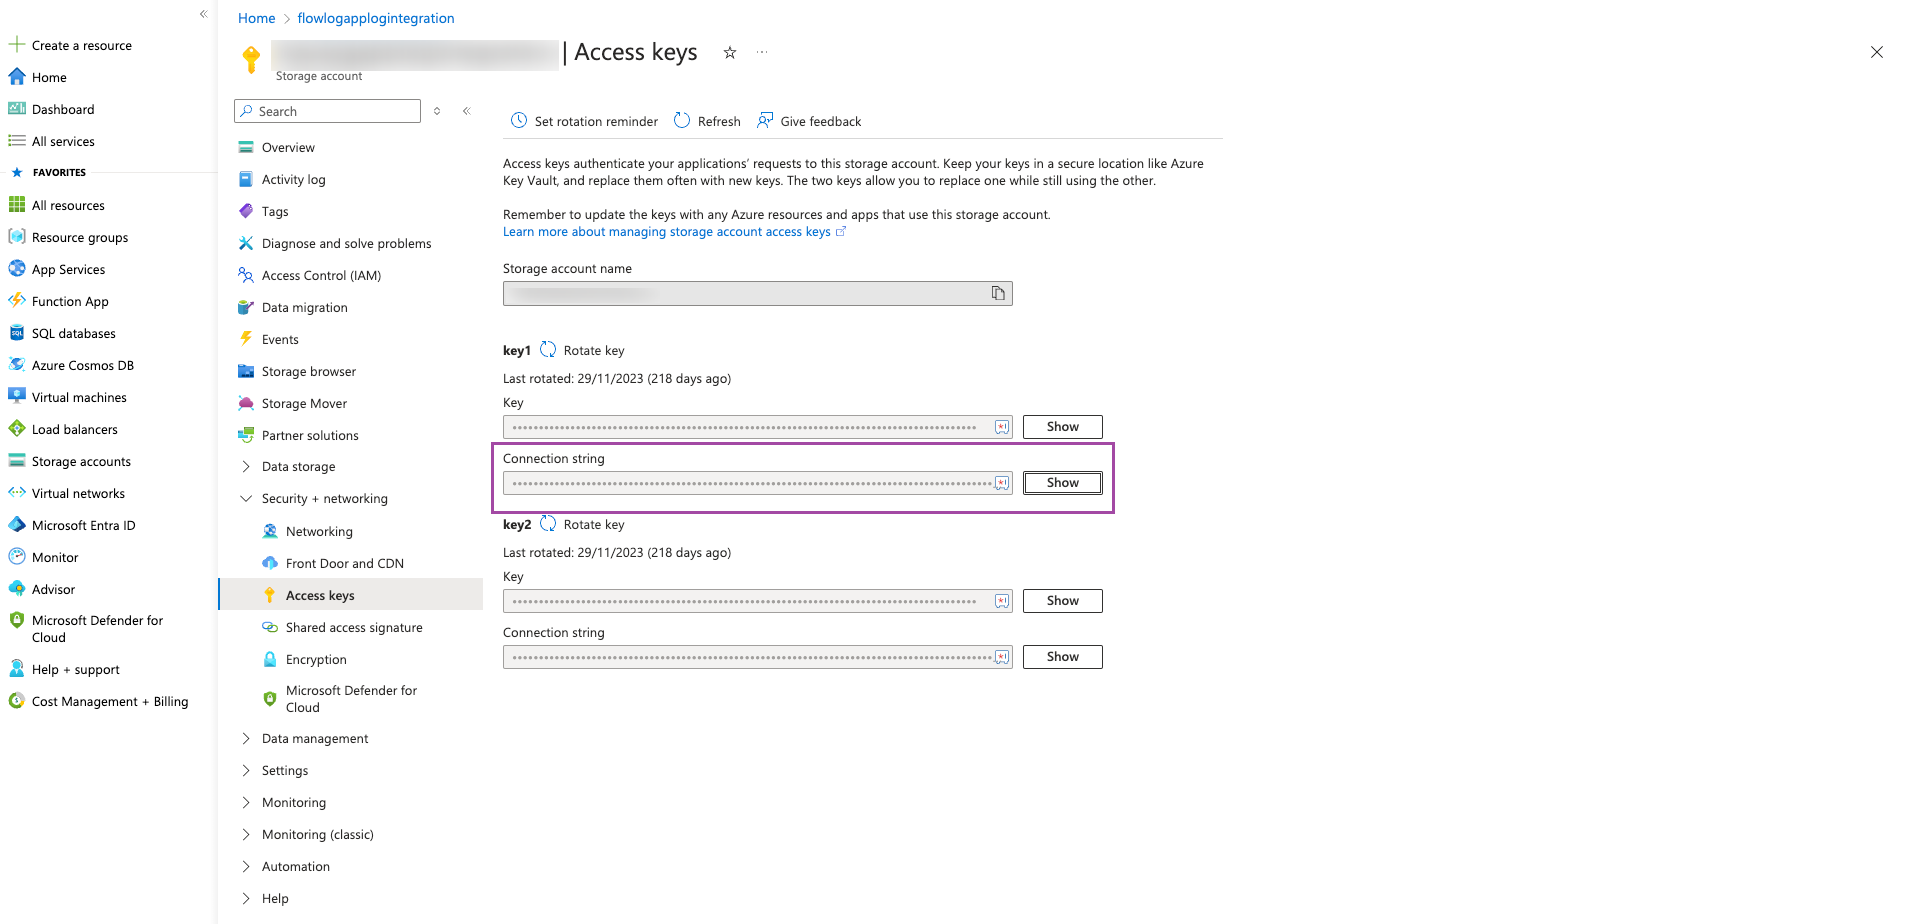
- Blob Connection String: Retrieve the connection string for the storage account where the NSG Flow logs are stored by following the steps mentioned in this document. Alternatively, you can navigate to your storage account in the Azure portal, go to Security + networking, and select Access keys to view your account access keys and the complete connection string for each key.
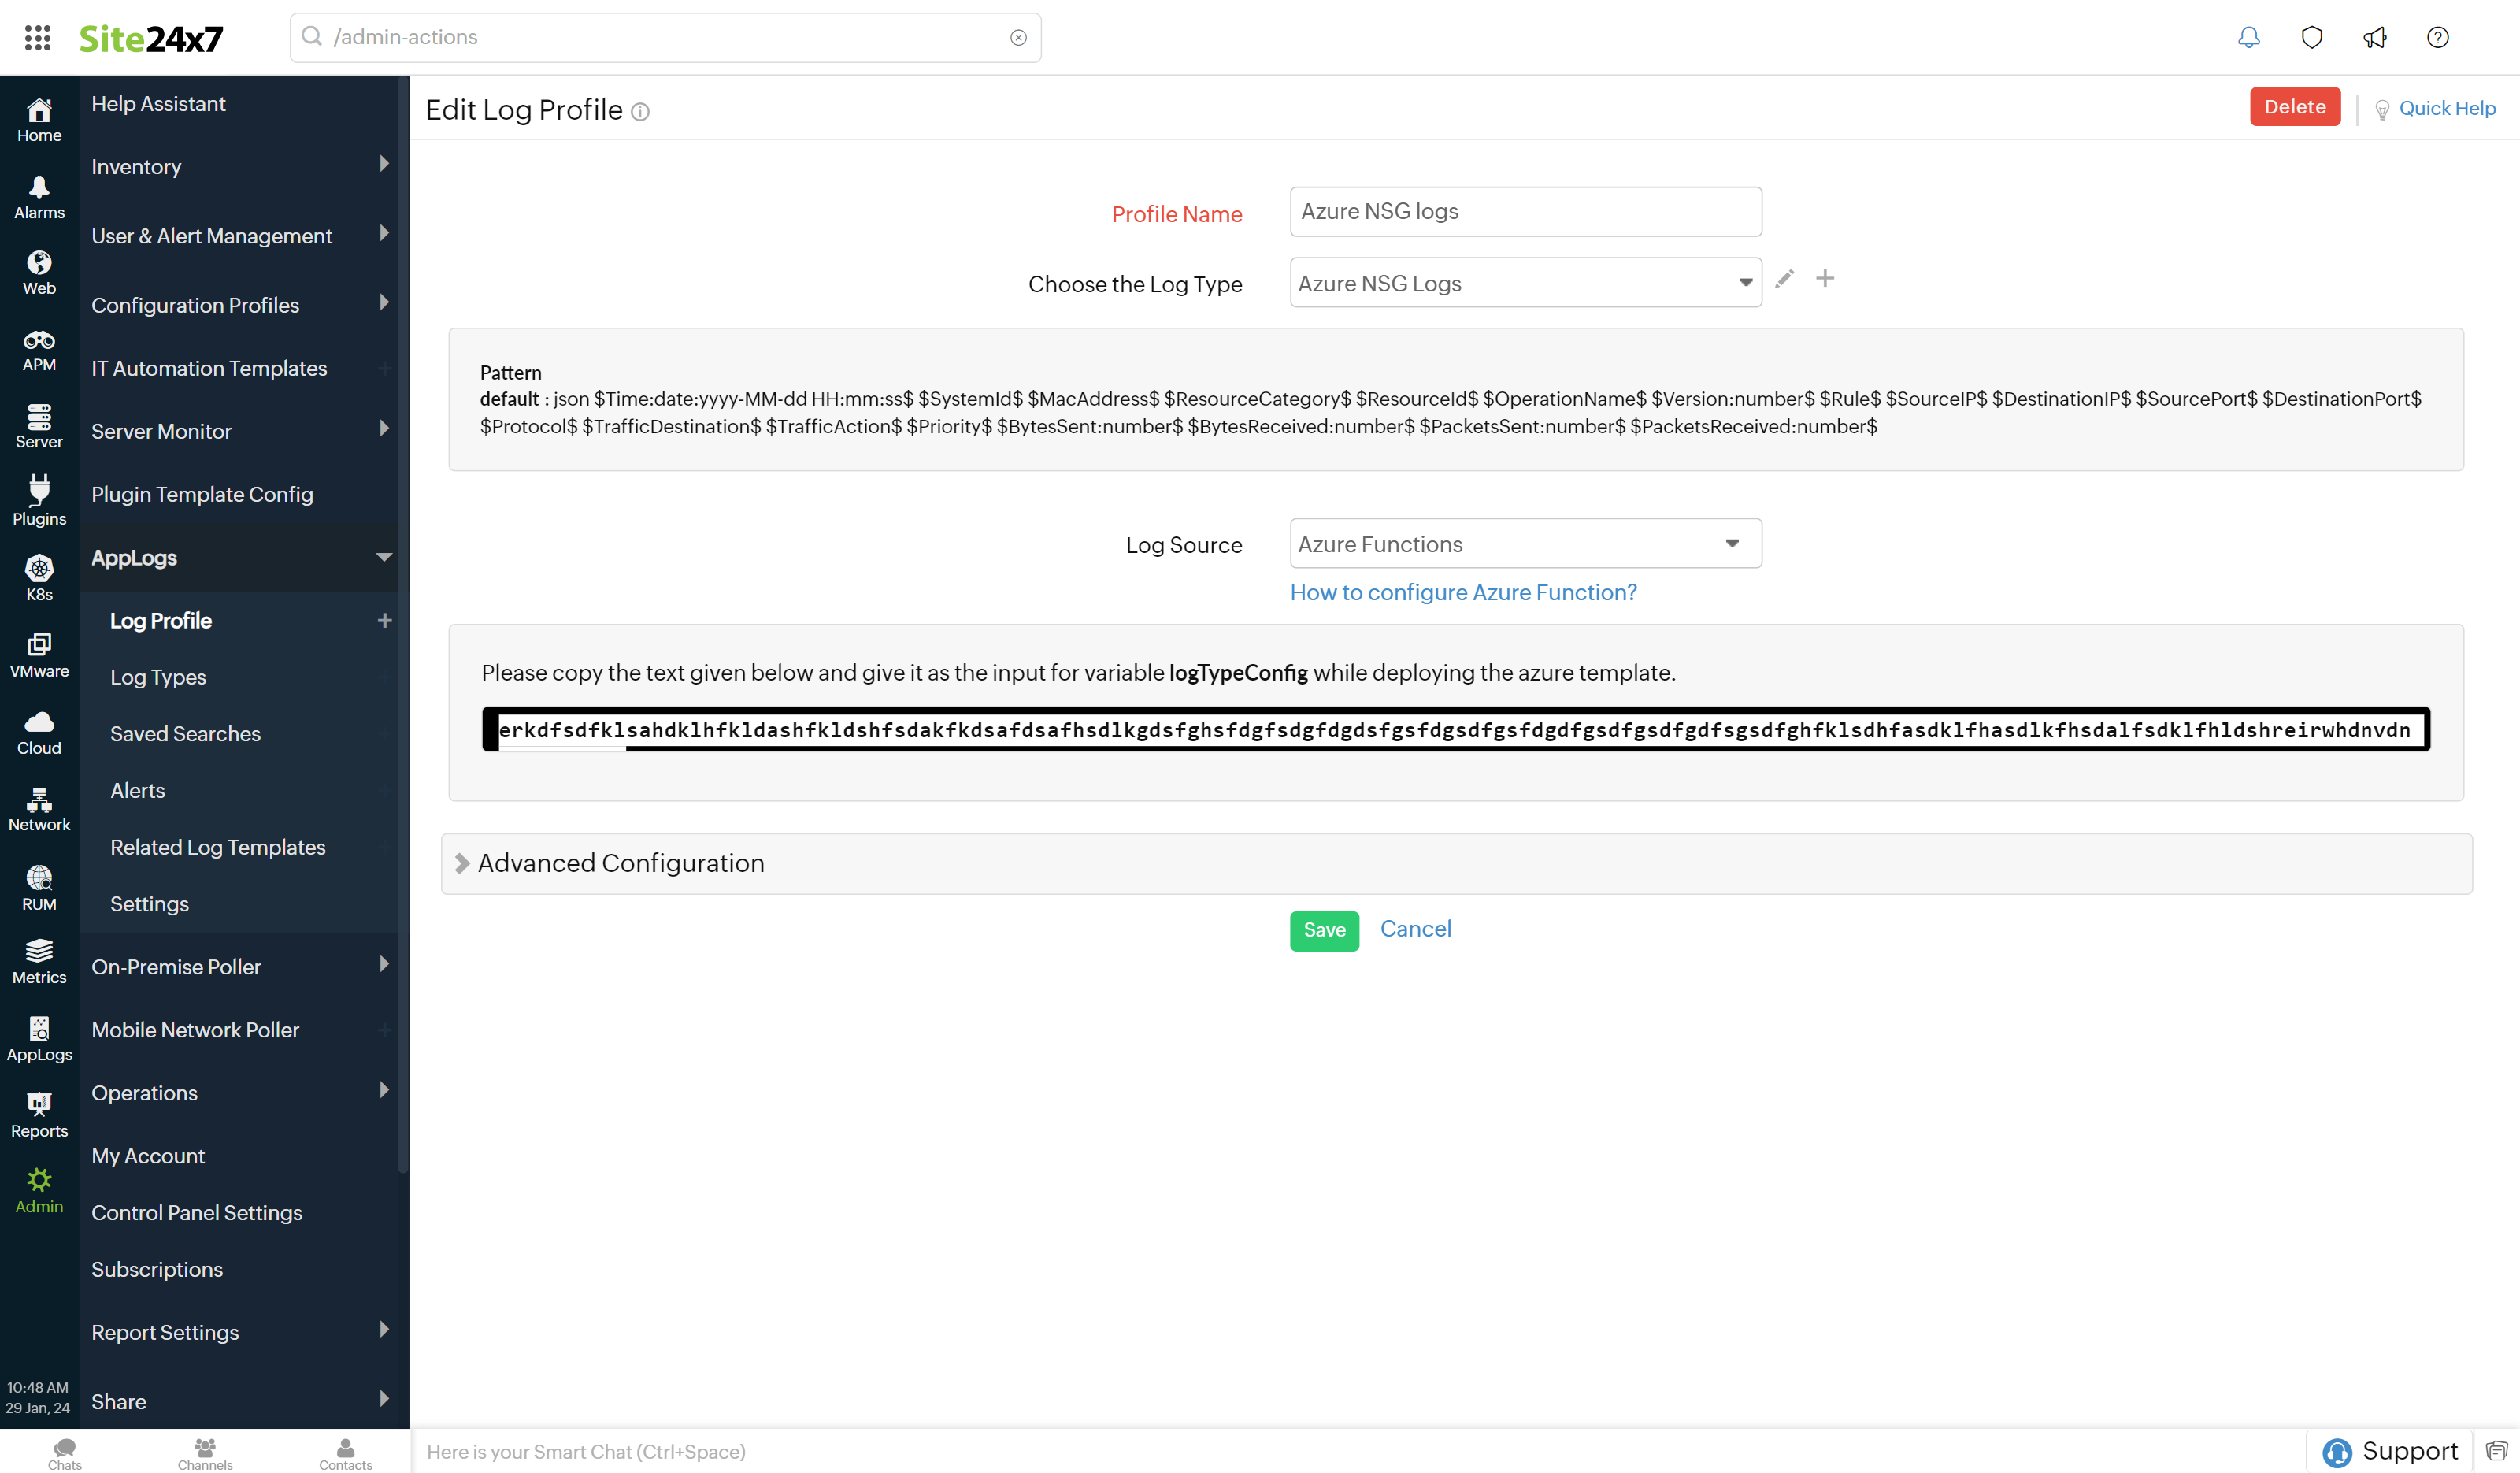
- Log Type Config: Navigate to the Site24x7 web client, select Admin > Applogs > Log Profile, then select the created log profile, and copy the code that appears on the screen as the input for the variable logtypeConfig.
- Log Collection Start Time: Give collection time in Unix format (e.g., 1705989855). This setting determines when to collect logs. If no time is specified, it defaults to processing events created from the configuration time onward.
- Under Terms and Conditions:
- Check the box next to I agree to the terms and conditions stated above.
- Click Purchase.
Azure NSG logs dashboard
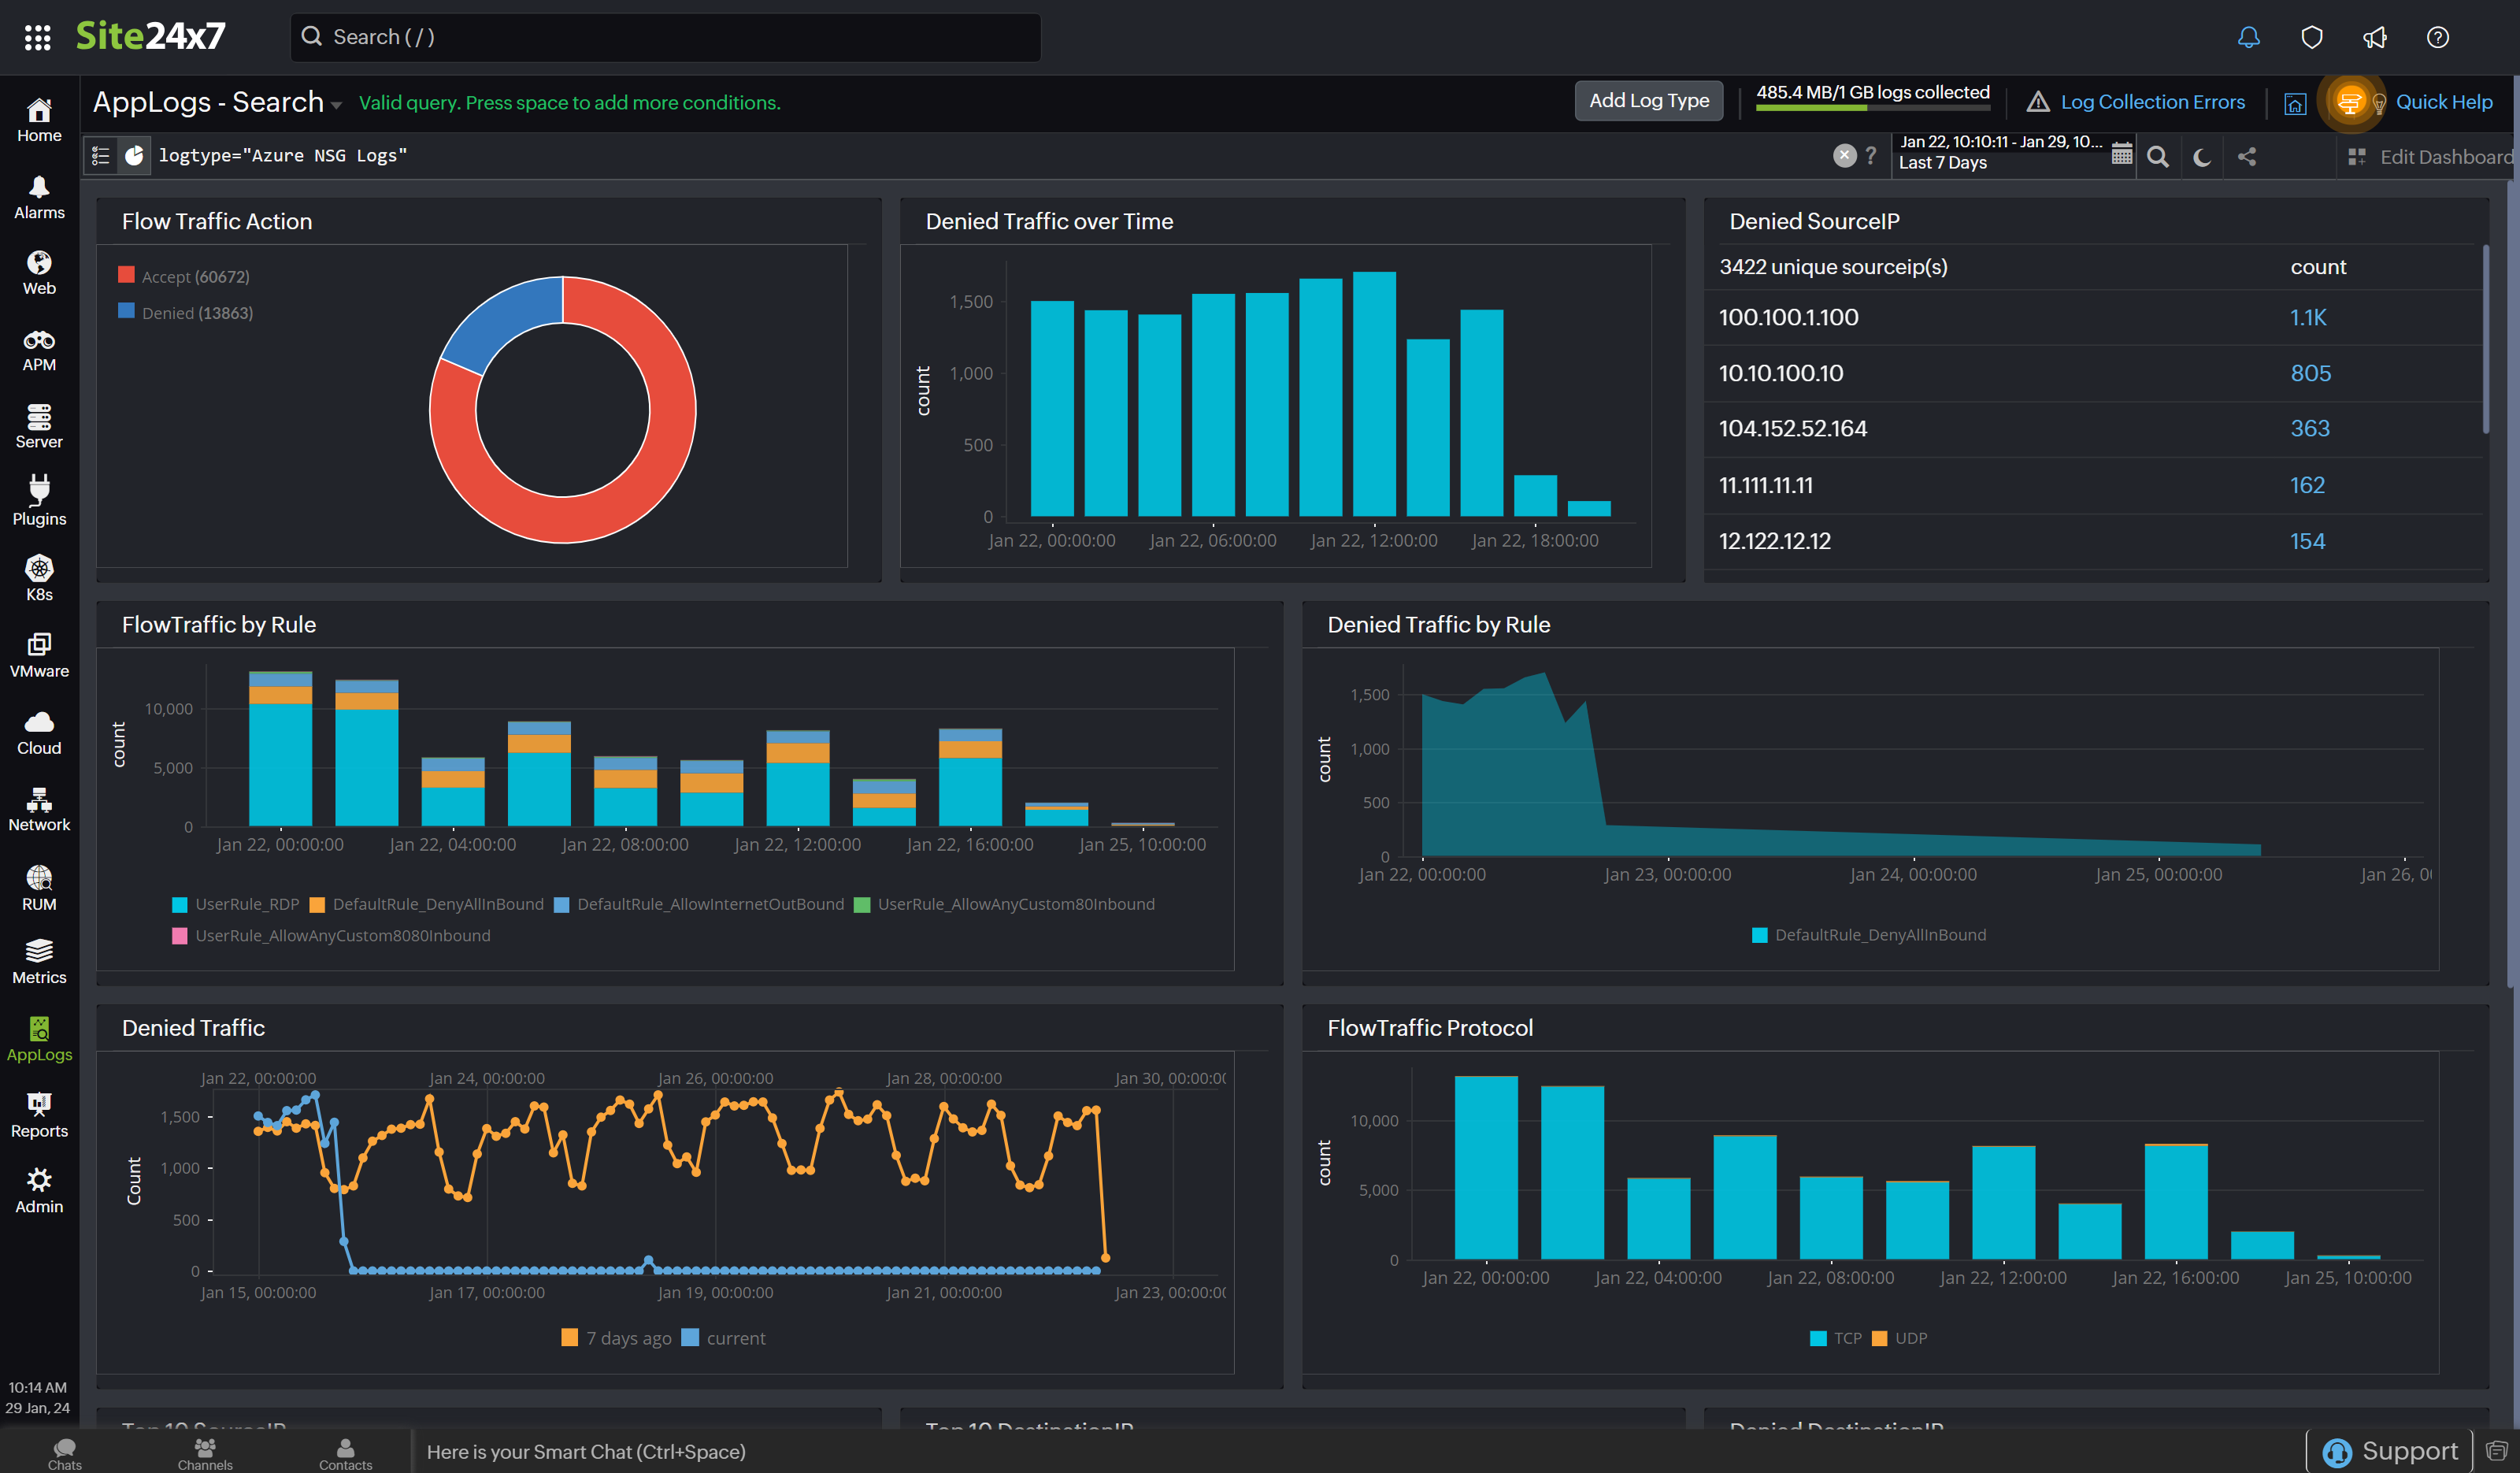
AppLogs creates an exclusive dashboard for every log type and shows a few widgets by default. Here's a list of the widgets available in the Azure NSG logs dashboard:
- Flow Traffic Action
- Denied Traffic Over Time
- Denied Source IP
- Flow Traffic by Rule
- Denied Traffic by Rule
- Denied Traffic
- Flow Traffic Protocol
- Top 10 Source IP
- Top 10 Destination IP
- Denied Destination IP
- Top 10 Destination Port
- Traffic Destination
Troubleshooting log collection
On the AppLogs Search window, search for Azure NSG Flow Logs. If you are not able to see the records, verify the configurations as mentioned below.
Verifying configurations
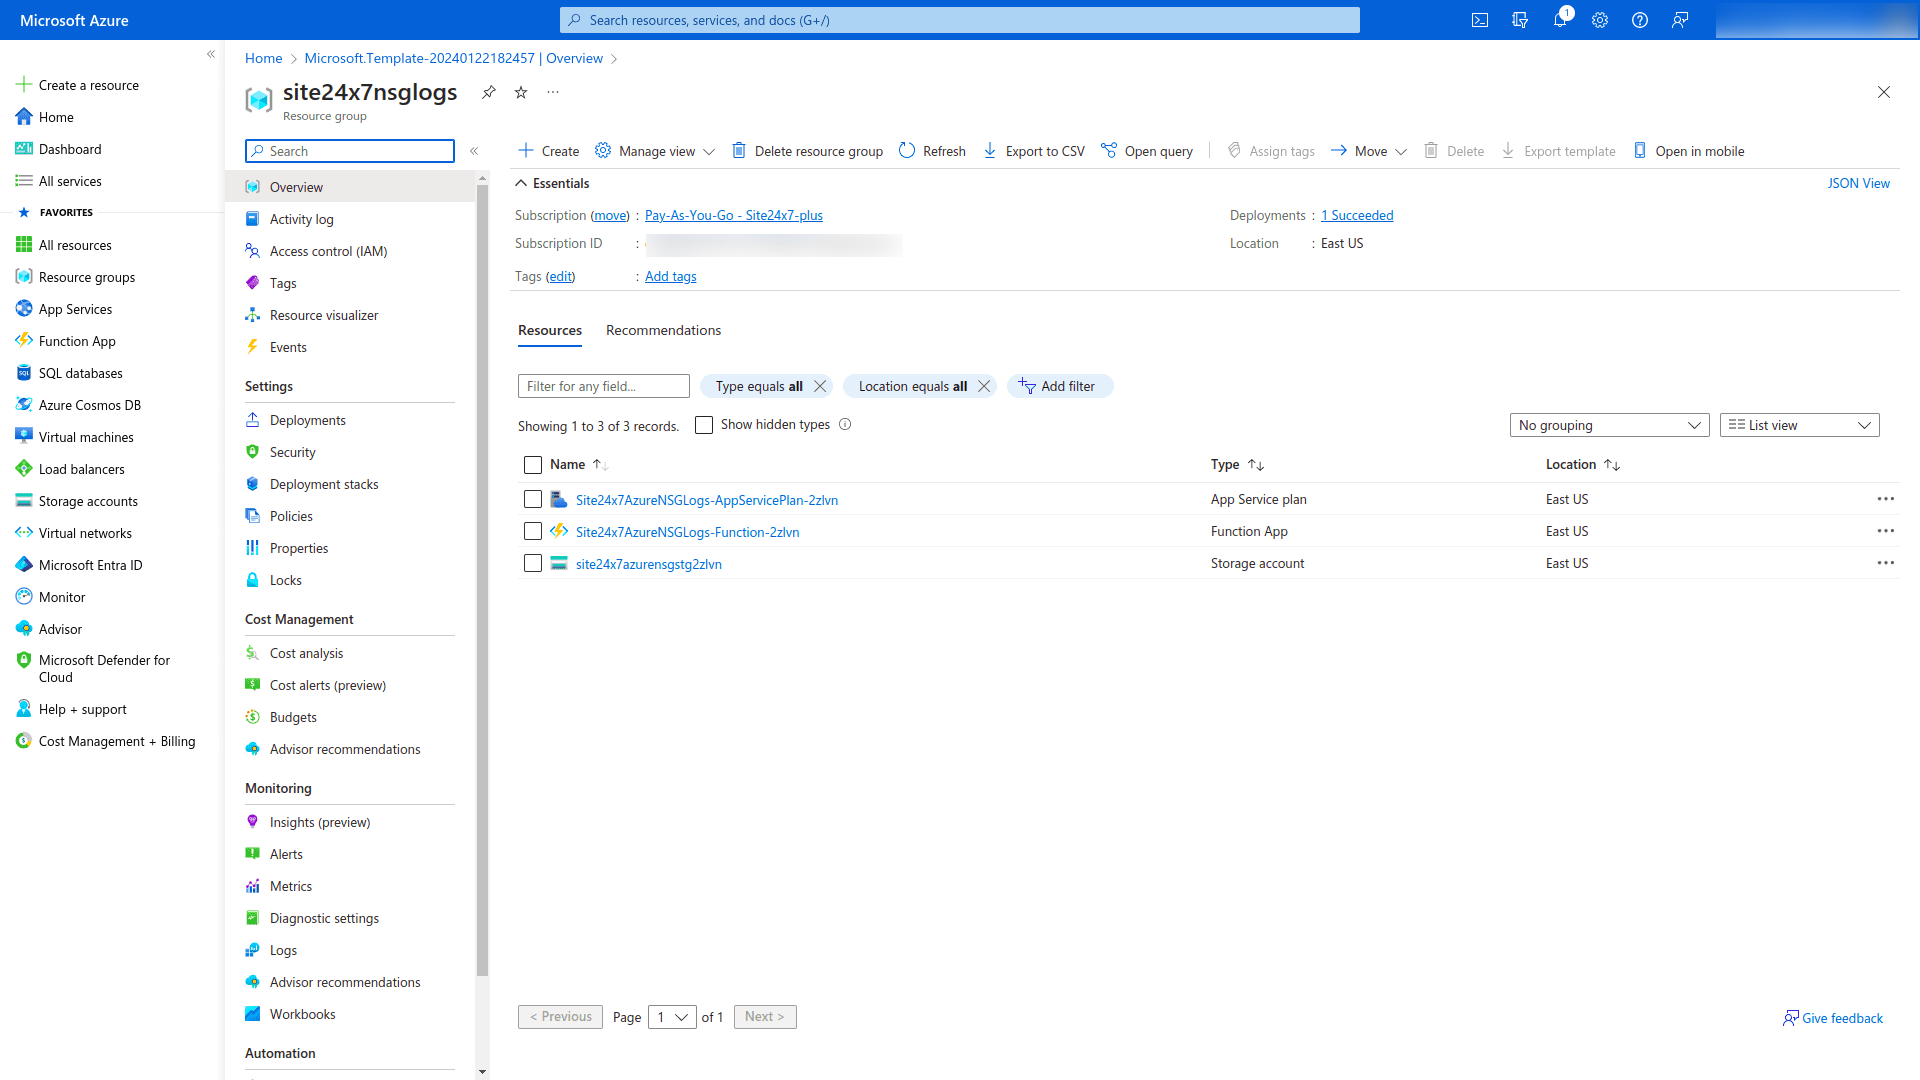
From the home page of your Azure portal, go to Resource groups. Click the resource group created using an ARM template.
Check if it lists all three of the resources you created: a Site24x7AzureNSGLogs-AppServicePlan, a Site24x7AzureNSGLogs-Function, and a site24x7azurensgstg to verify the deployment.
If you are still not able to see the records on the AppLogs Search window, you can contact support@site24x7.com.

