Root Cause Analysis Report (RCA)
Every time a downtime is detected, a Root Cause Analysis (RCA) report is triggered and sent to a user based on the alerting contact and medium. The RCA generated provides the actual reason behind the downtime, along with the trace route map to diagnose connectivity issues.
For example, a server crashes due to a high process usage. Site24x7 will declare the monitor as Down and send a RCA to the user. The server monitoring agent will collect the top processes by CPU, memory, and other events before the server crashed and present it in the RCA report. This will help in quicker troubleshooting and prevent similar performance degradation issues in the future.
The different components of a RCA report for a Windows and a Linux server are discussed:
RCA for a Windows Server:
The various components generated in a RCA report when a downtime is detected in a Windows server is as follows:
- Monitor Details: Basic monitor details including monitor name, type, IP address, host name , downtime duration are listed

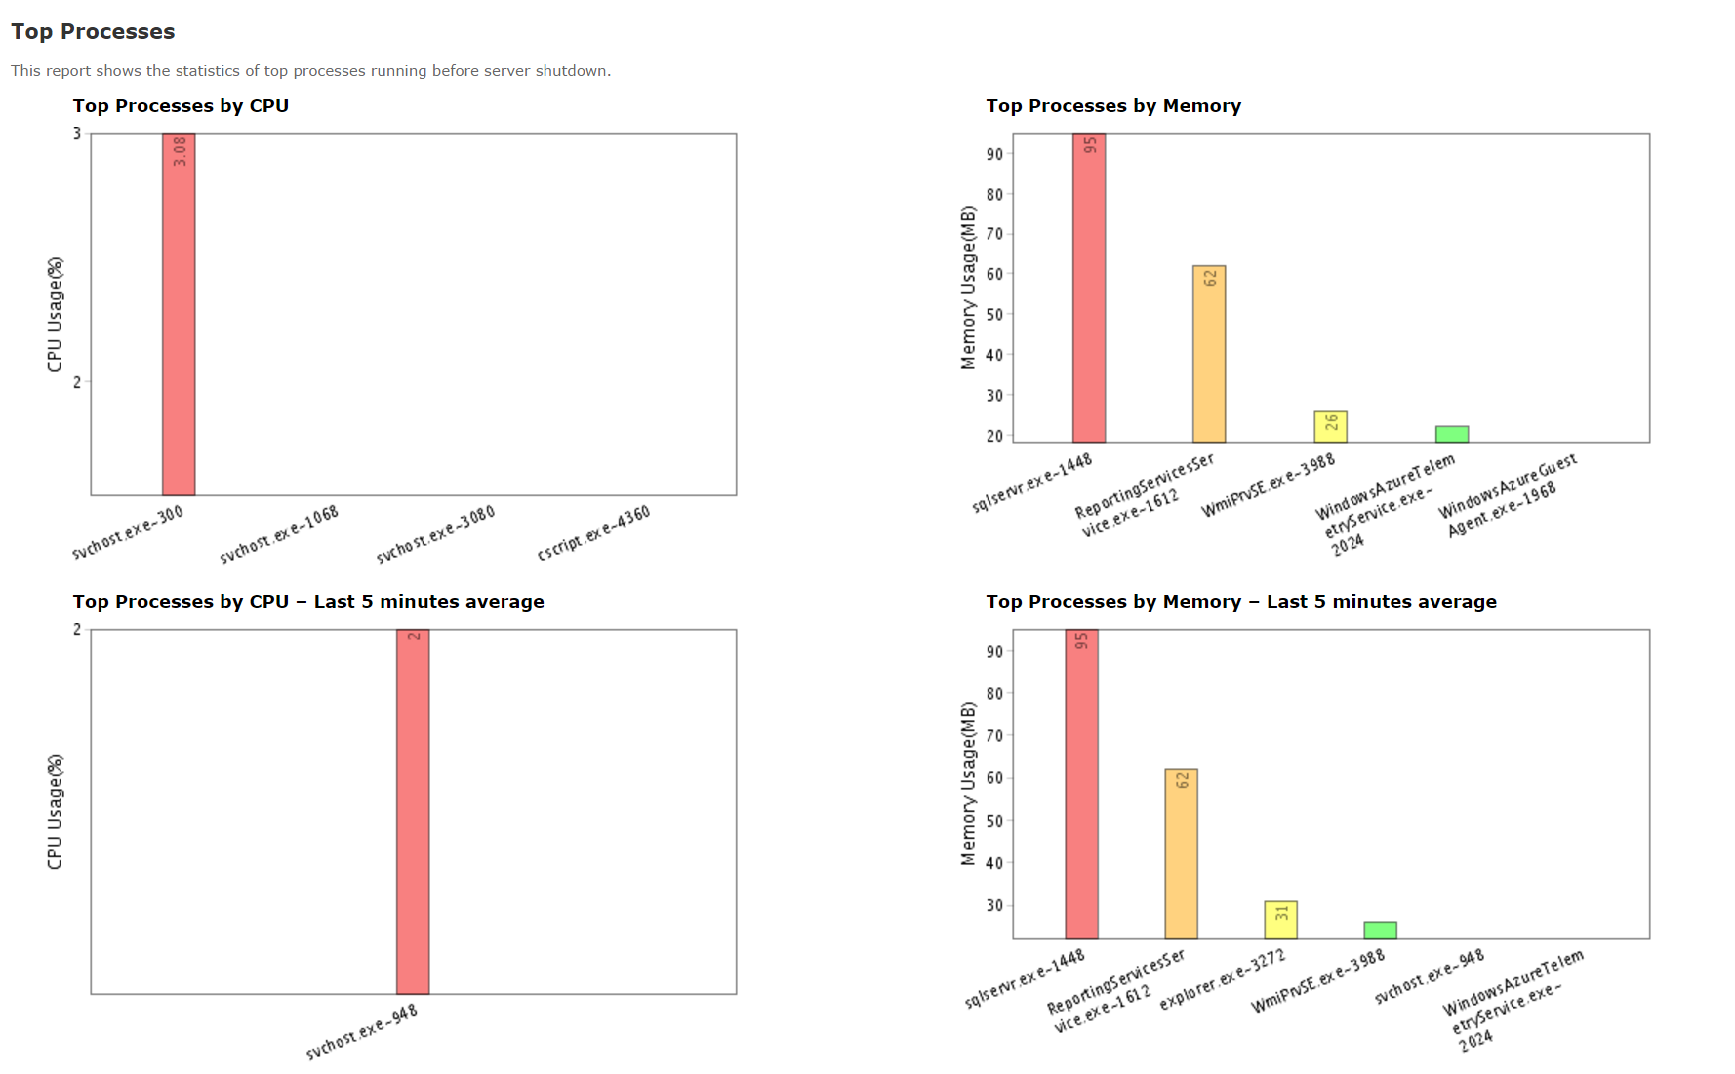
- Top Processes by CPU (includes Last 5 minutes average): Graphical representation of the top processes utilizing the highest amount of CPU. Also, another graph shows the the top processes utilizing the highest amount of memory in the last 5 minutes
- Top Processes by Memory (includes Last 5 minutes average): Graphical representation of the top processes utilizing the highest amount of memory. Also, another graph shows the the top processes utilizing the highest amount of memory in the last 5 minutes
- Disk details: Lists down the disks with their total size and the available free space
- Hard Disk Status: The size of the hard disks, their current status, and any description of any error occurred on the hard disk is given

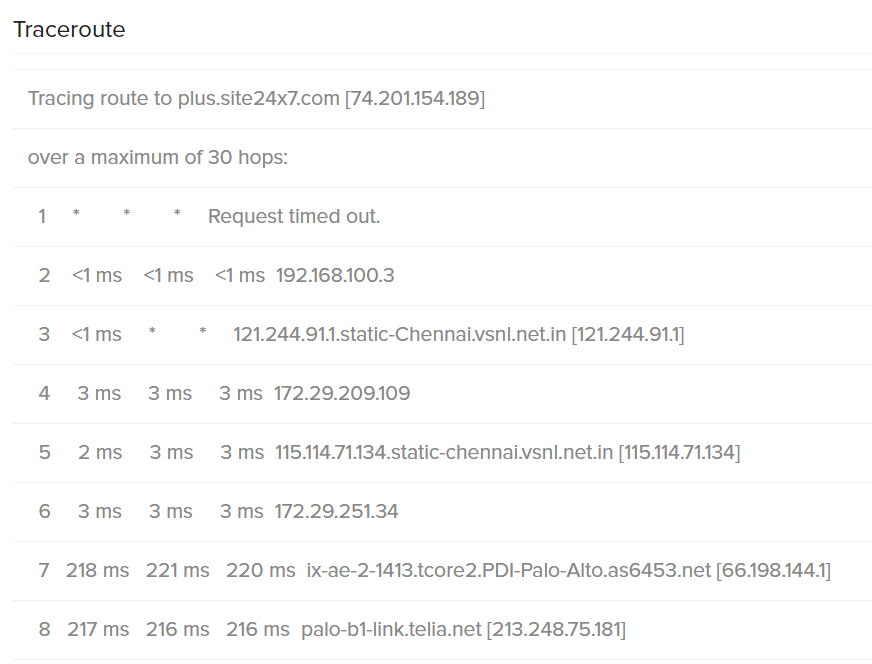
- Trace Route: To enable inclusion of trace route analysis in the RCA, the user has to provide firewall access for taking trace route of the plus.site24x7.com domain. Enabling this will let the user to drill down to the actual reason behind connectivity issues and take corrective actions at the earliest
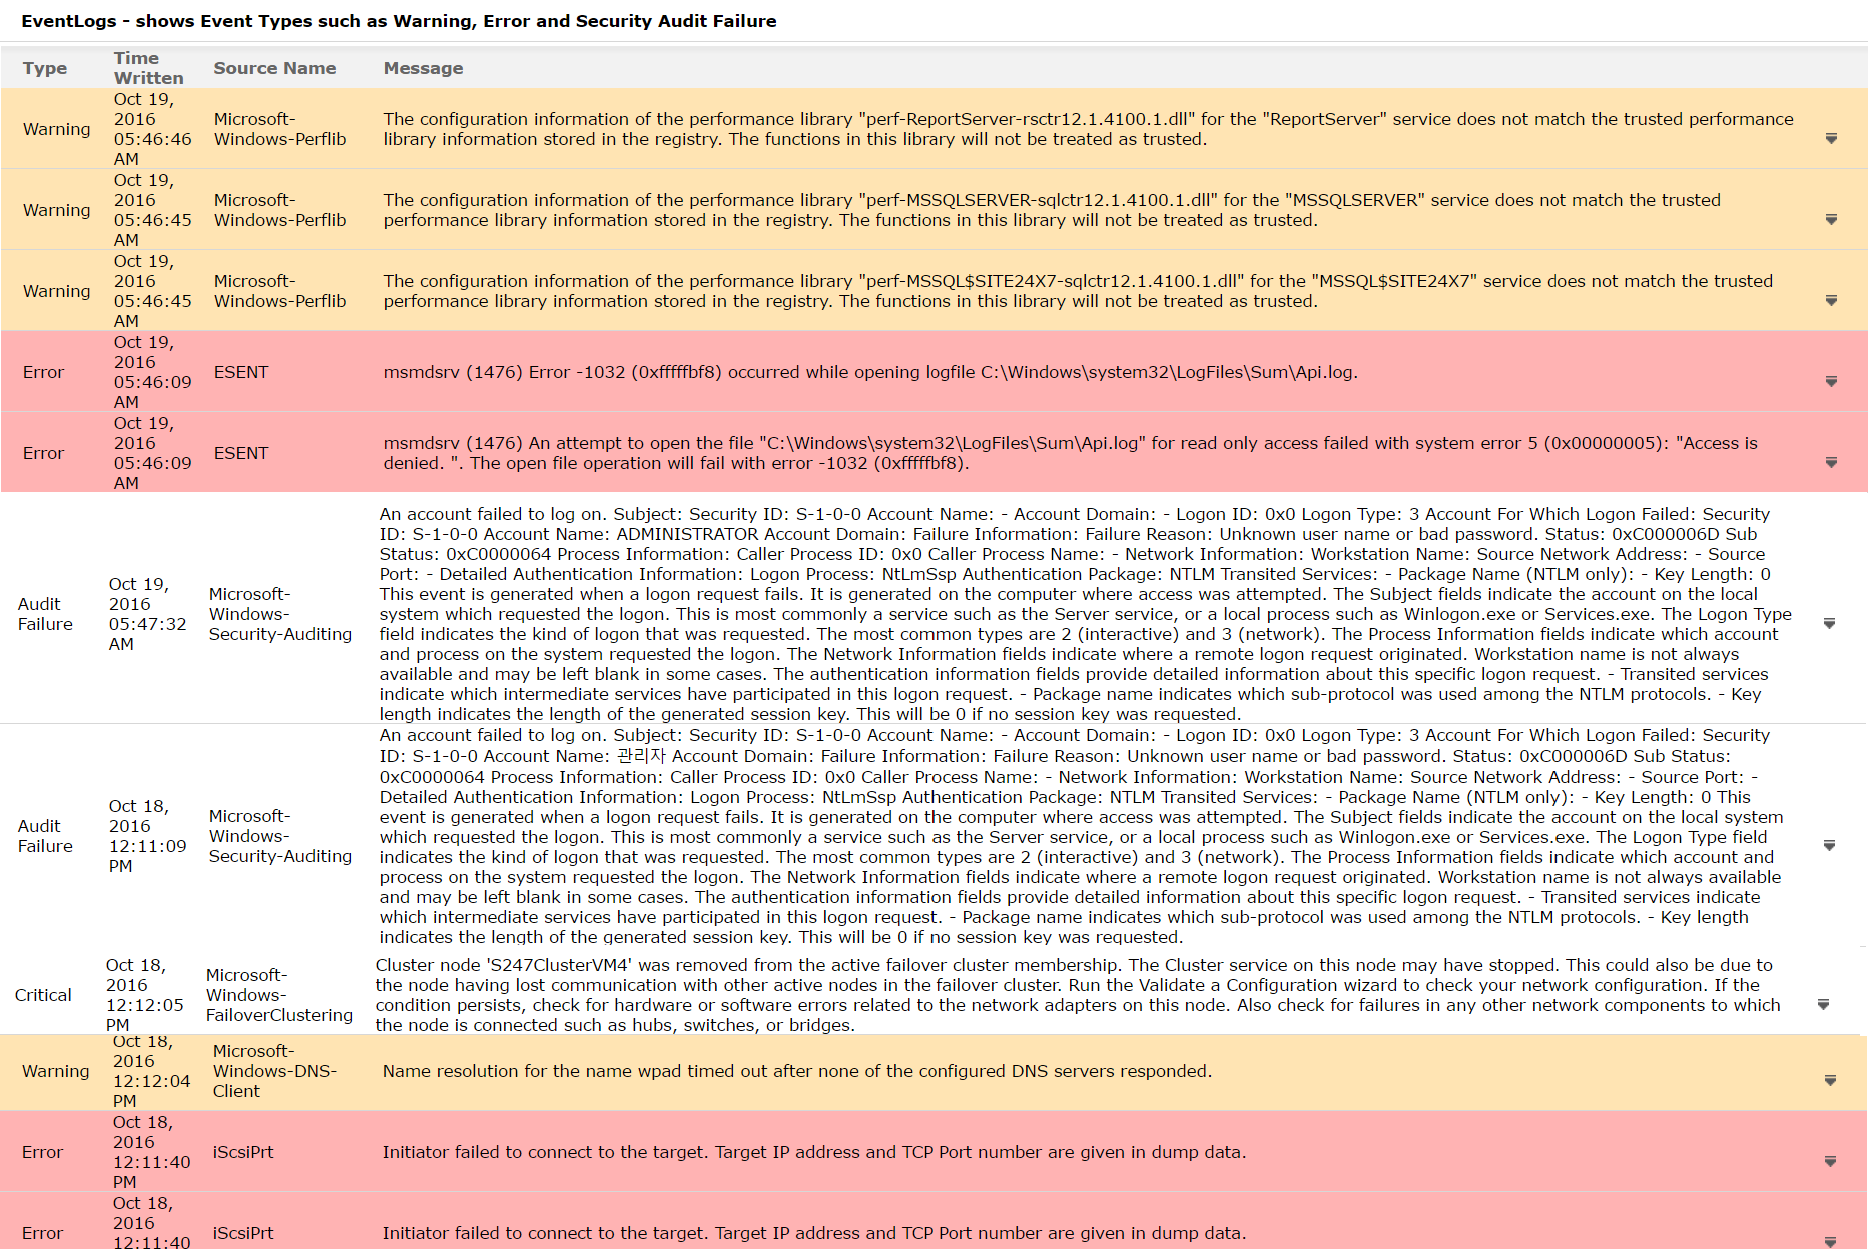
- Event Logs: The type of event logs (Warning, Error, Audit Failure, Critical), their description, the time at which it was written, and its source are noted down
- CPU Fan Status: Current status of the CPU Fan
- Logged in Users: The number of active users on that server are categorized
- Softwares installed in the last 30 days: The softwares that were installed in the last 30 days in your server are tabulated
RCA for a Linux Server:
The various components generated in a RCA report when a downtime is detected in a Linux server is as follows:
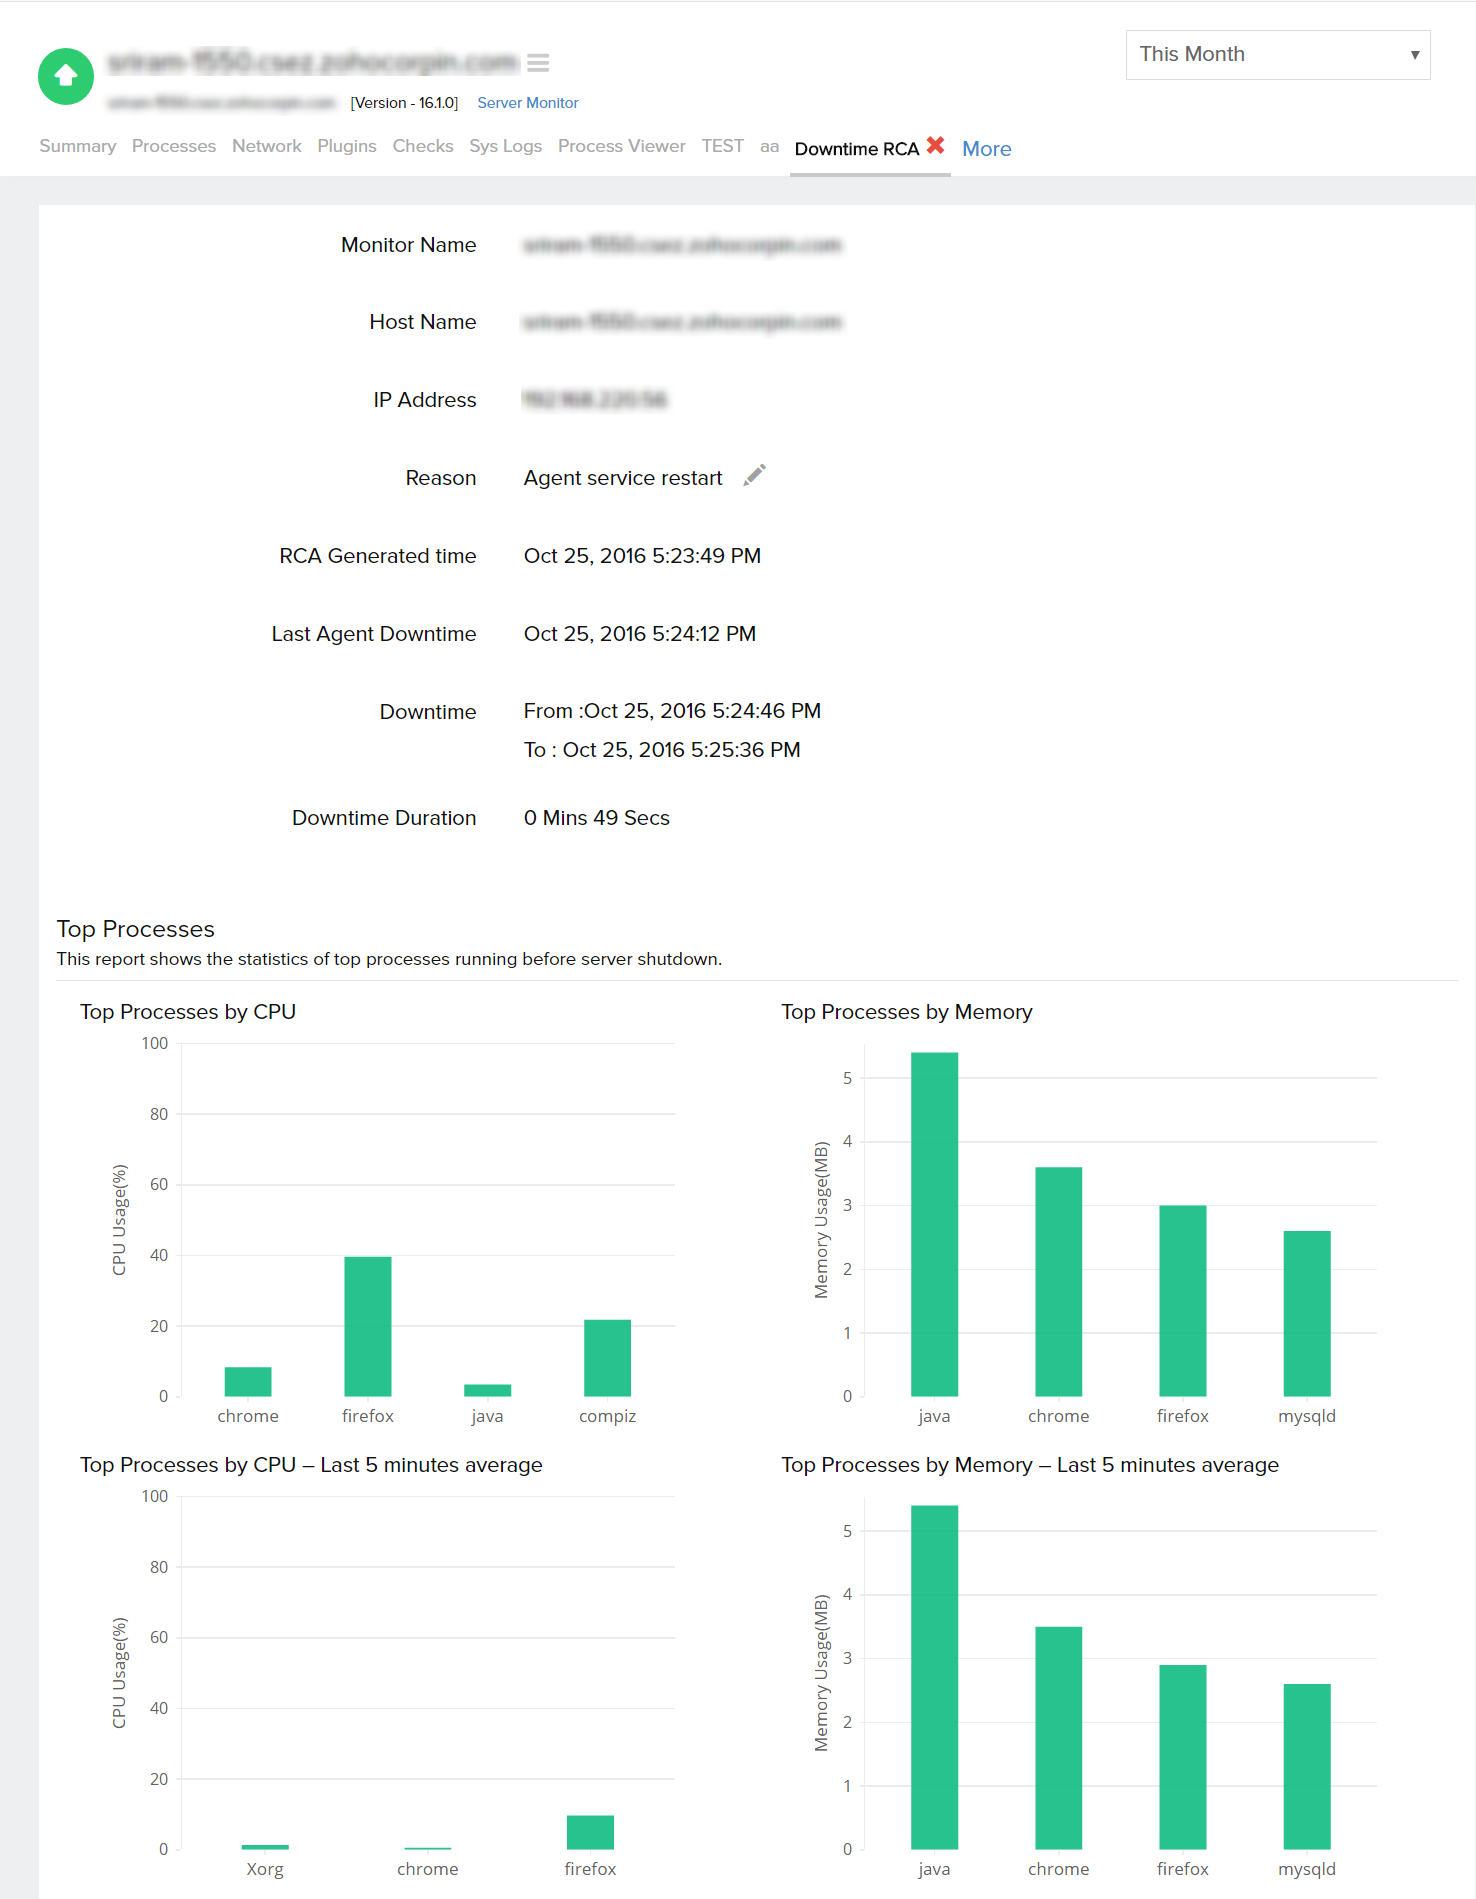
- Monitor Details: Basic monitor details including monitor name, IP address, host name , reason for the downtime, downtime duration are listed
- Top Processes by CPU (includes Last 5 minutes average): Graphical representation of the top processes utilizing the highest amount of CPU. Also, another graph shows the the top processes utilizing the highest amount of memory in the last 5 minutes
- Top Processes by Memory (includes Last 5 minutes average): Graphical representation of the top processes utilizing the highest amount of memory. Also, another graph shows the the top processes utilizing the highest amount of memory in the last 5 minutes
- CPU Utilization: Data on the load percentage, context switches per second, interrupts per second are tabulated and given
- Disk Utilization: Lists down the disks with their total size and the available free space
- Memory Stats: Metrics on the memory including total, used, free, buffer free/used, total virtual free/used are listed
- Network Details: Information on the packets sent/received, status of the net connection, transmitted and received traffic are specified
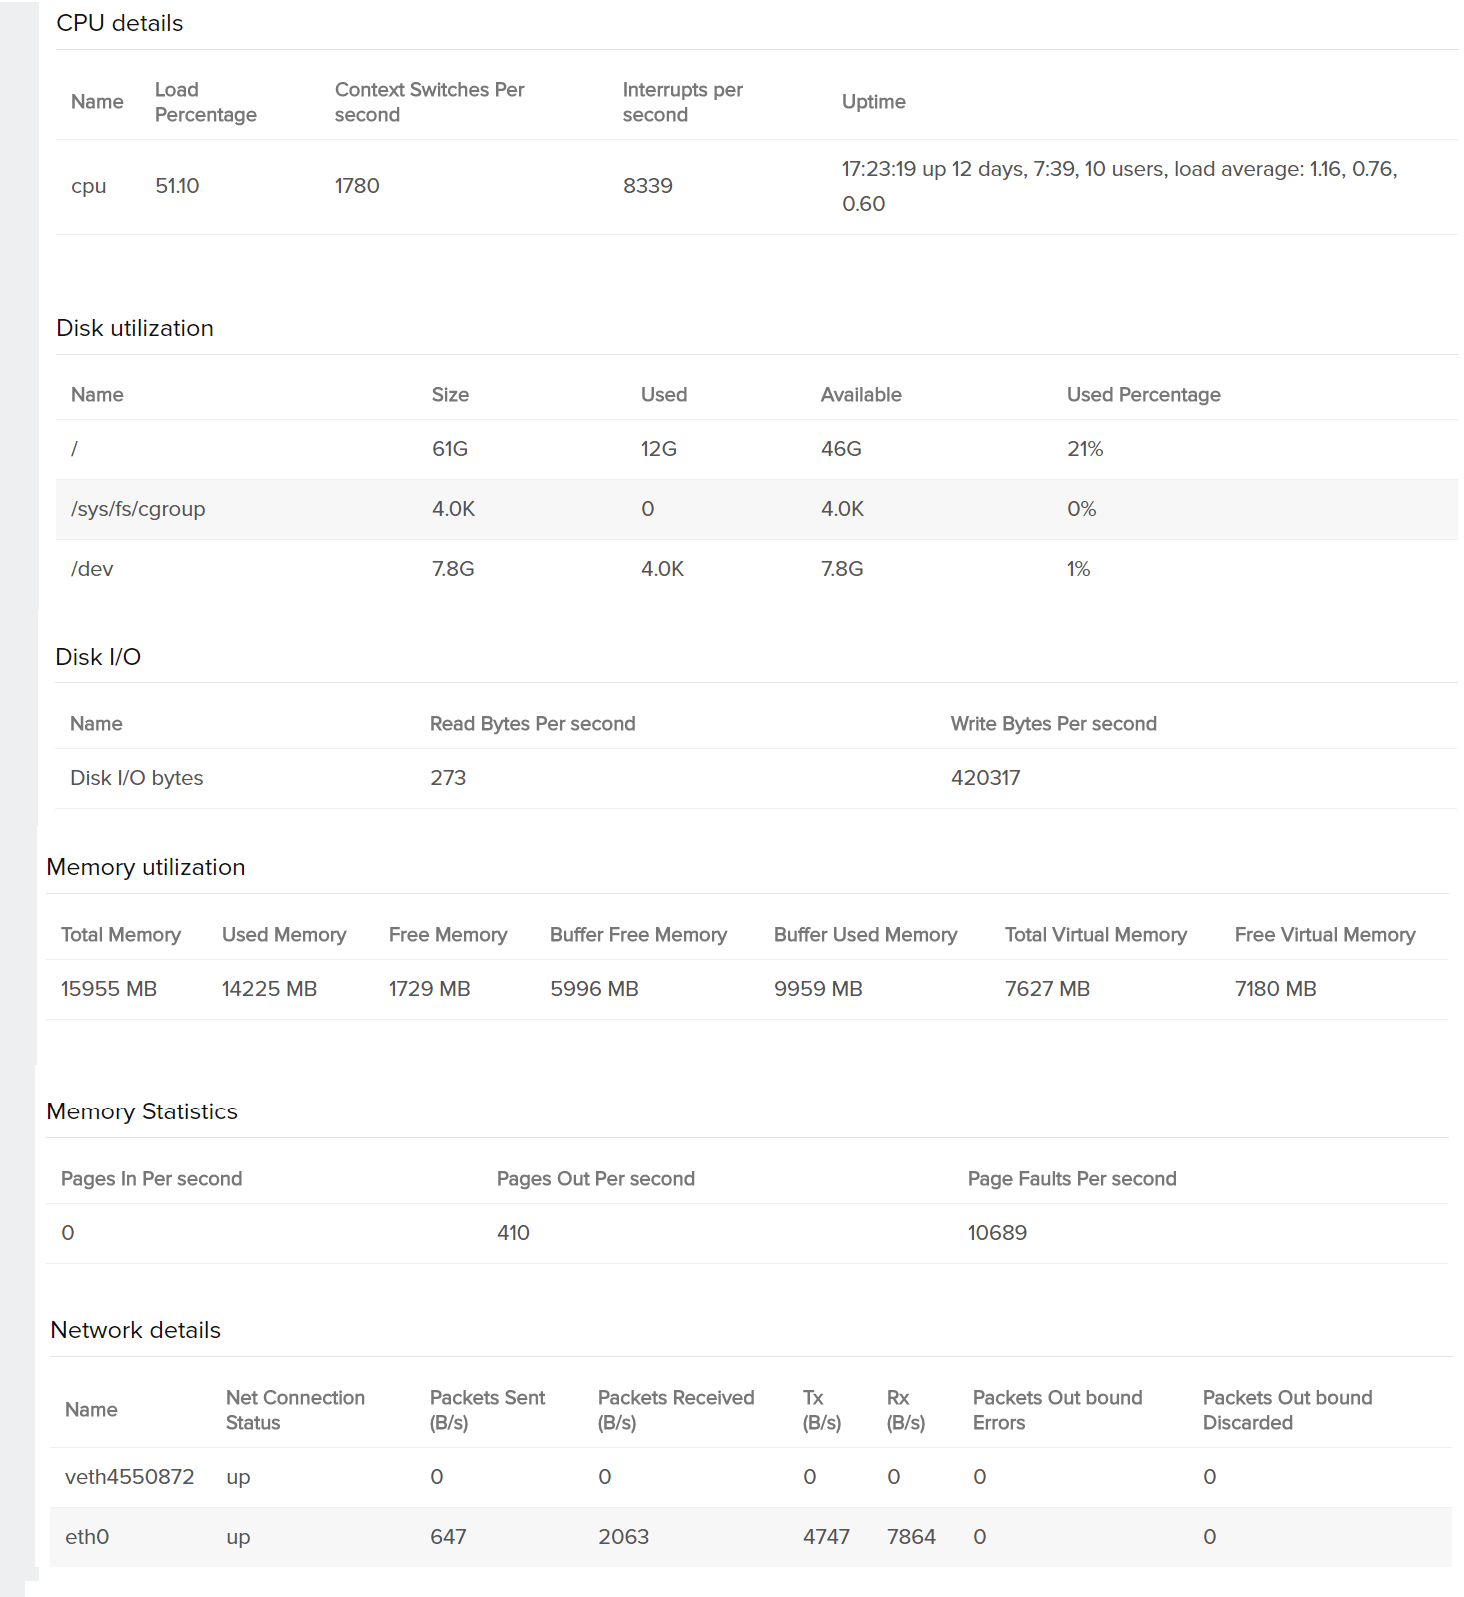
- Trace Route: To enable inclusion of trace route analysis in the RCA, the user has to provide firewall access for taking trace route of the plus.site24x7.com domain. Enabling this will let the user to drill down to the actual reason behind connectivity issues and take corrective actions at the earliest

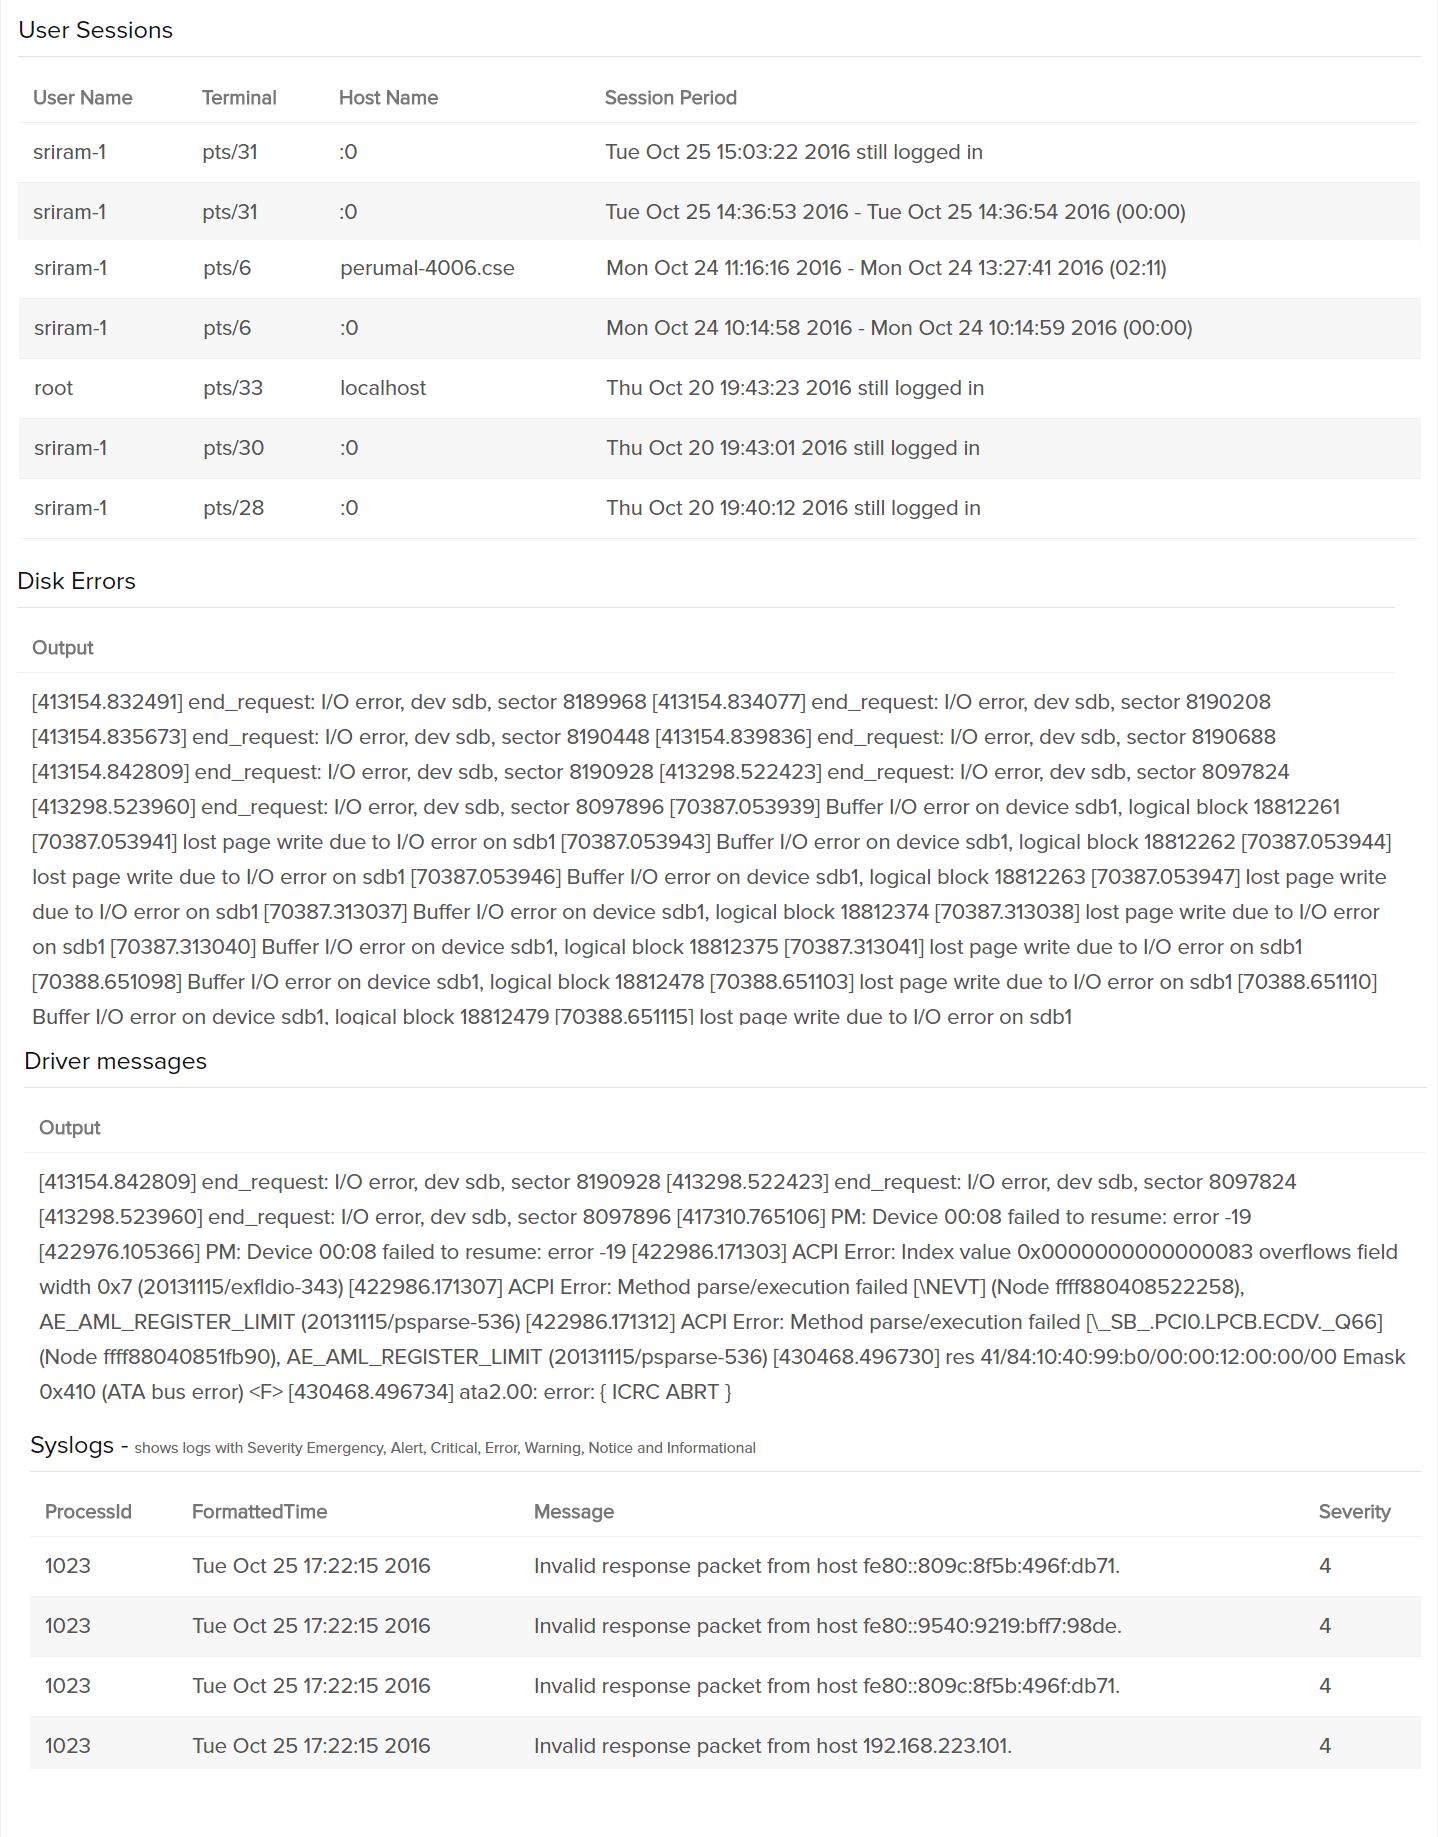
- User Sessions: The number of active users on that server are categorized
- Disk Errors: Disk errors from kernel which includes I/O error and file system errors
- Driver Messages: Error messages from kernel will be listed here
- Syslogs: The process ID of that particular syslog, error message, the formatted time and the severity level are stated
Ask Zia
Use Ask Zia to quickly analyze root causes, gain insights, and troubleshoot issues efficiently.
