Monitor & Optimize Java Application Performance
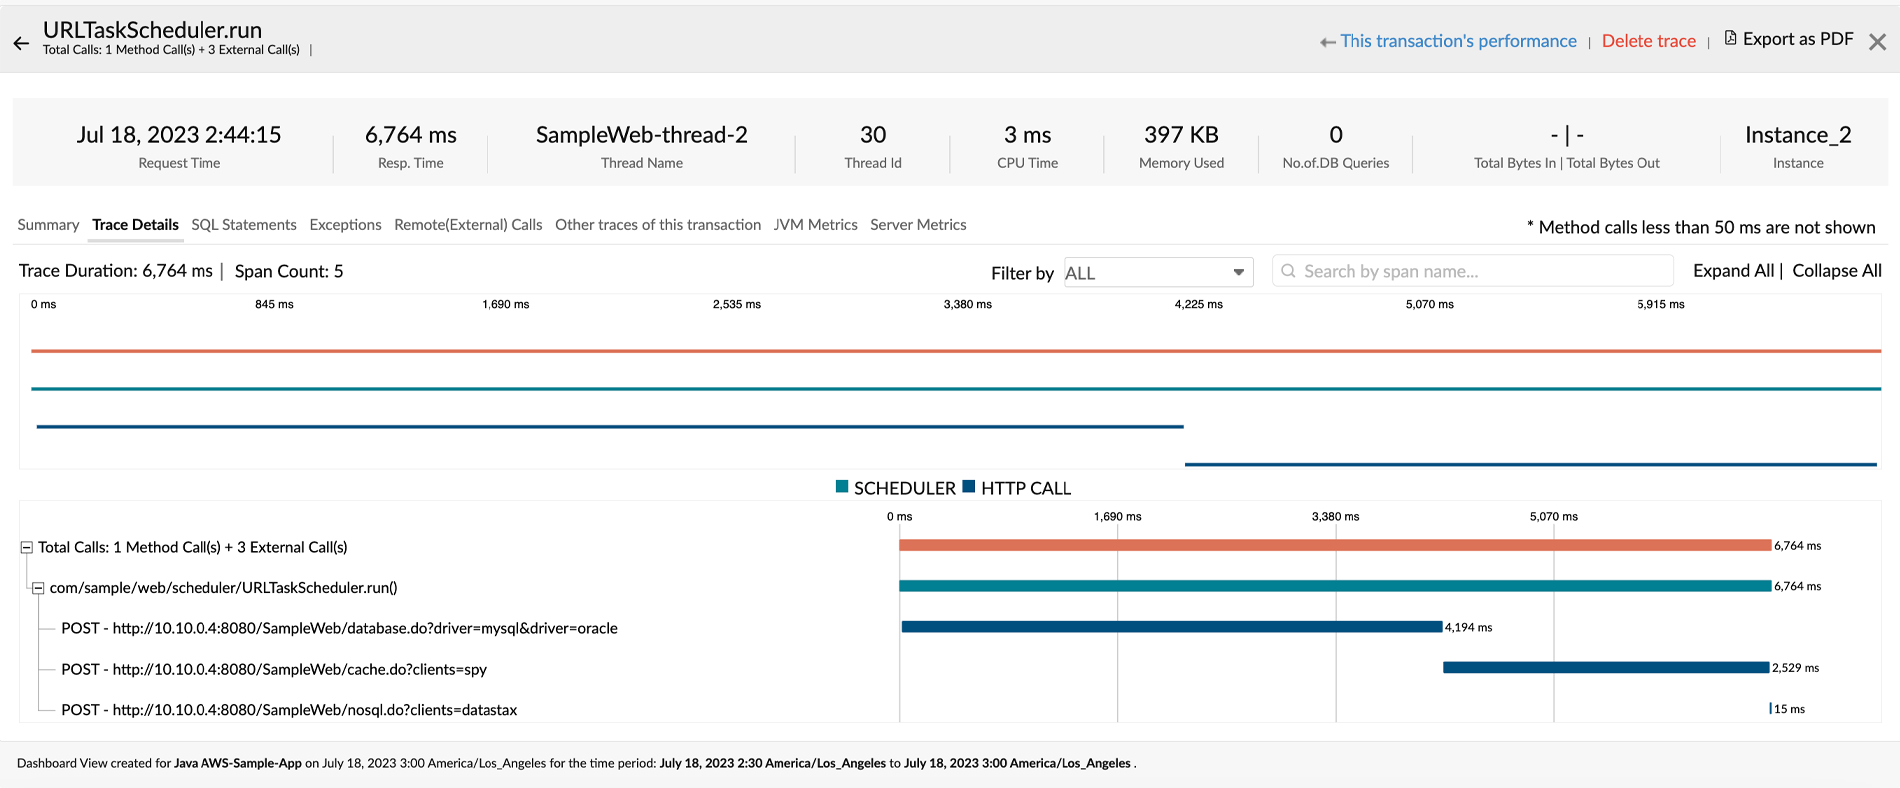
Identify slow traces.
Developers can easily identify slow internal invocations (methods) in the Java code and view the entire pathway in a tree view. The trace will chart the sequence of invocations of the URL inclusive of user defined methods.
You can also view the SQL queries involved in such transactions along with its stacktrace .
Evaluate performance of database calls.
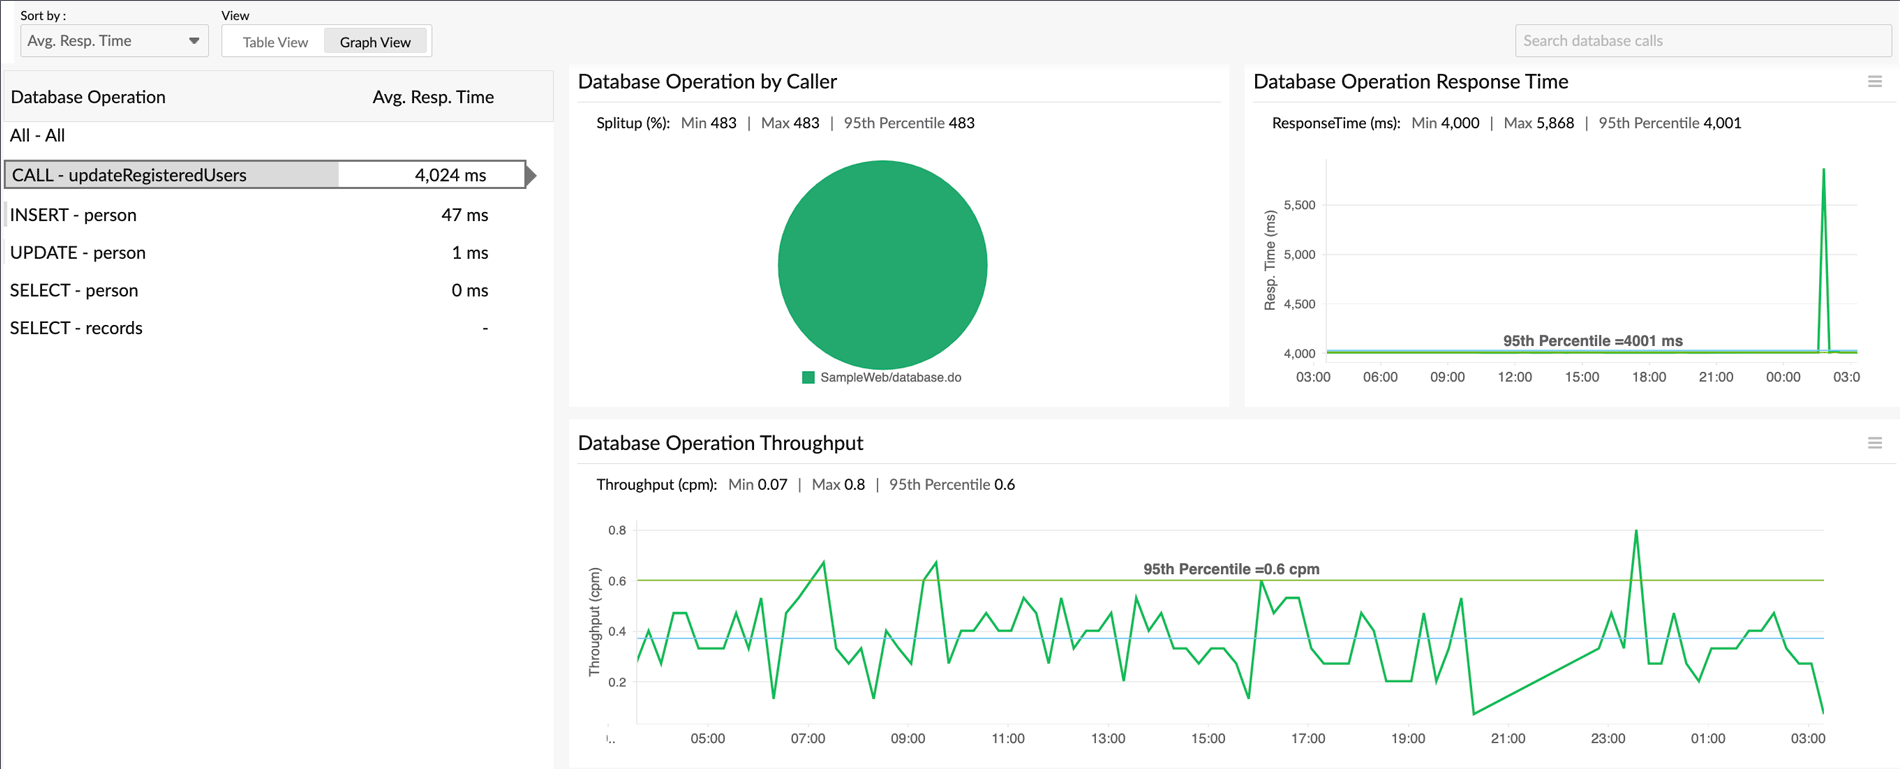
Opting to move a part of your database tables to in-memory cache like Memcached, Couchbase or Redis? Make your decision based on relevant data and stats such as:
- The most hit database tables.
- The busiest table and the most performed SQL Operation on the table.
- Web transactions issuing SQL calls.
- The most executed database operations with its response time.
Get detailed performance metrics to identify slow database calls, database usage and overall performance of the database furnished with detailed graphical and tabular representations.
Analyze your JVM metrics.
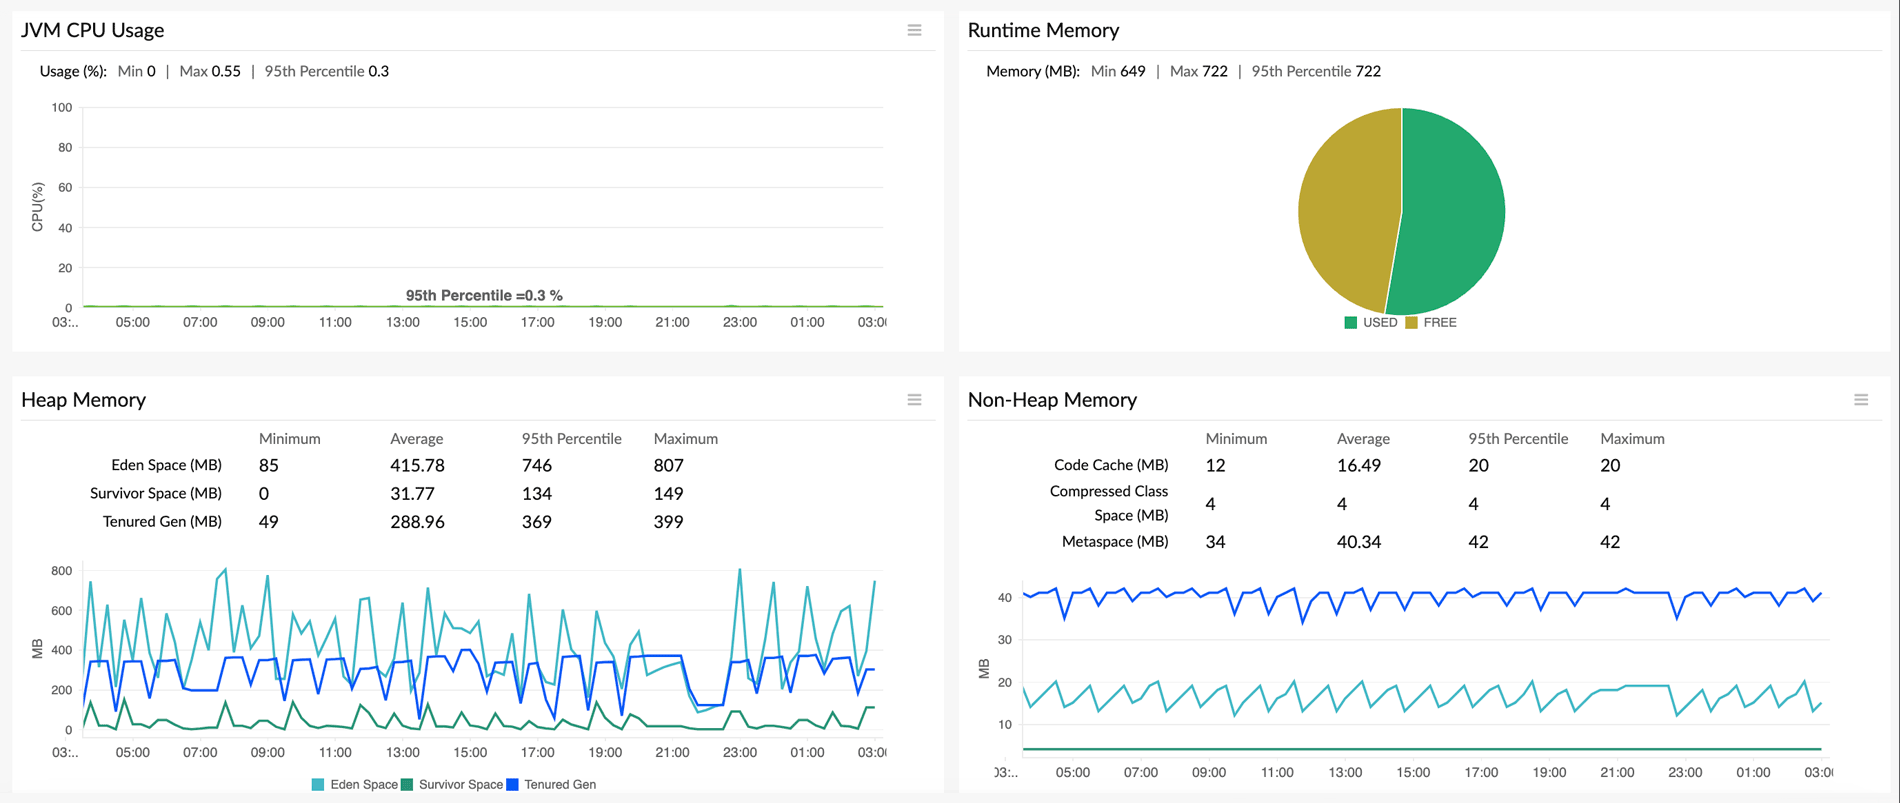
Monitor critical parameters of JVM like JVM CPU usage count, memory usage, GC count, GC time and thread summary. Configure threshold values for your JVM metrics and get alerted whenever there is an outage.
Monitor your custom Java components.
Develop wider insights into your applications and effortlessly track performance of specific features or modules. Custom Instrumentation for Java agent can be done either by using Java Innotations or through a Configuration File.
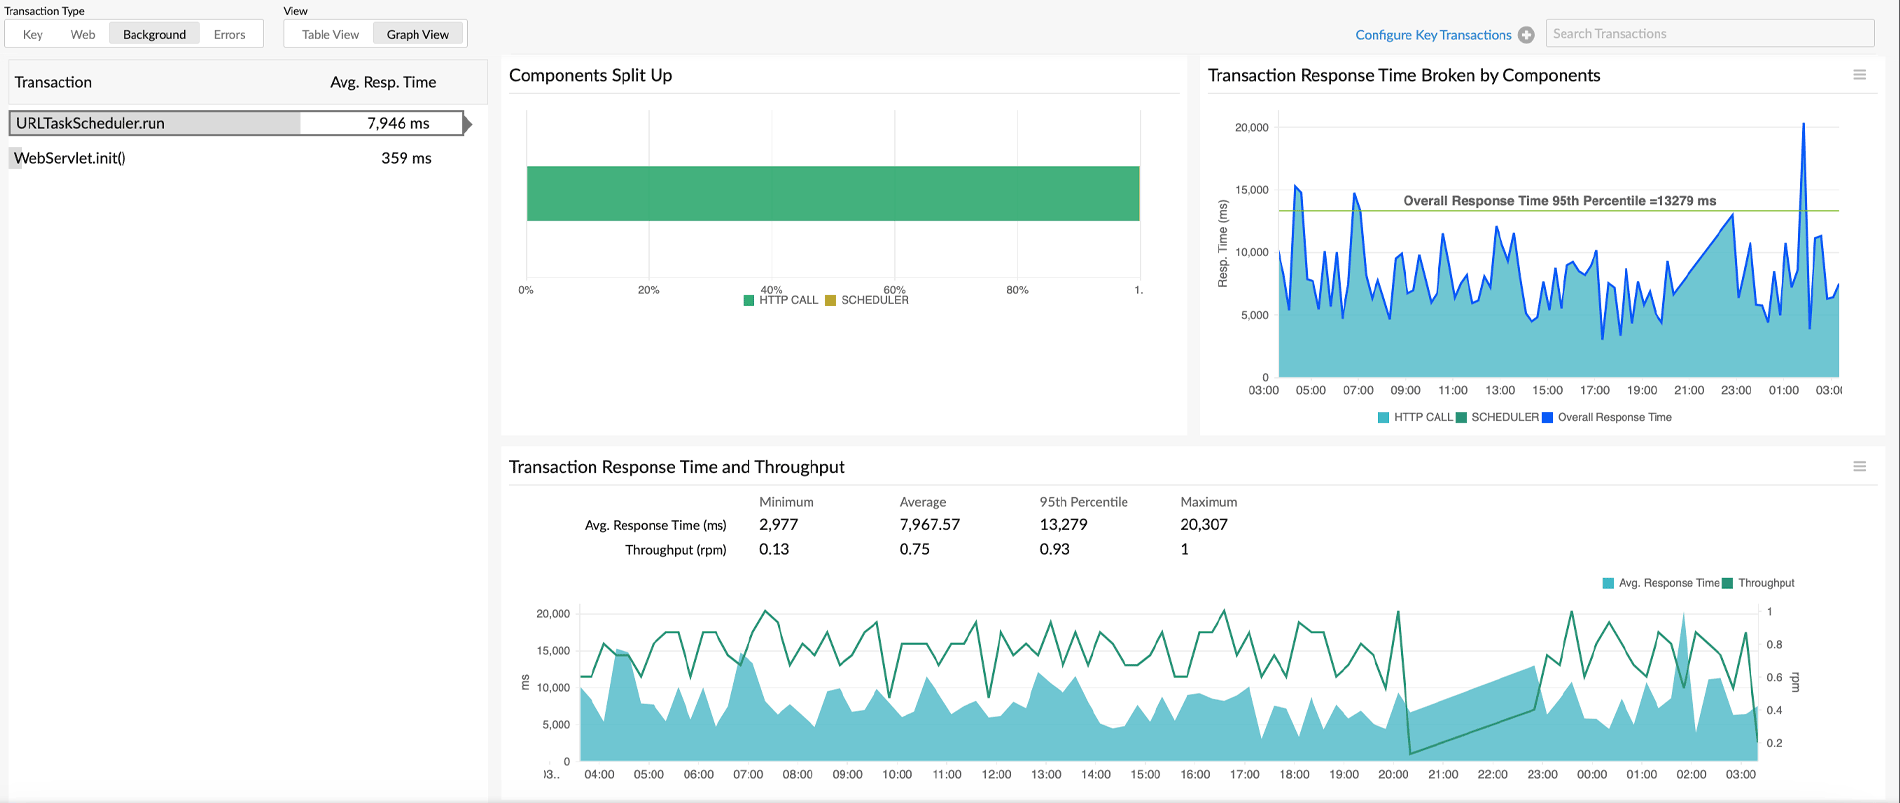
Track background transactions.
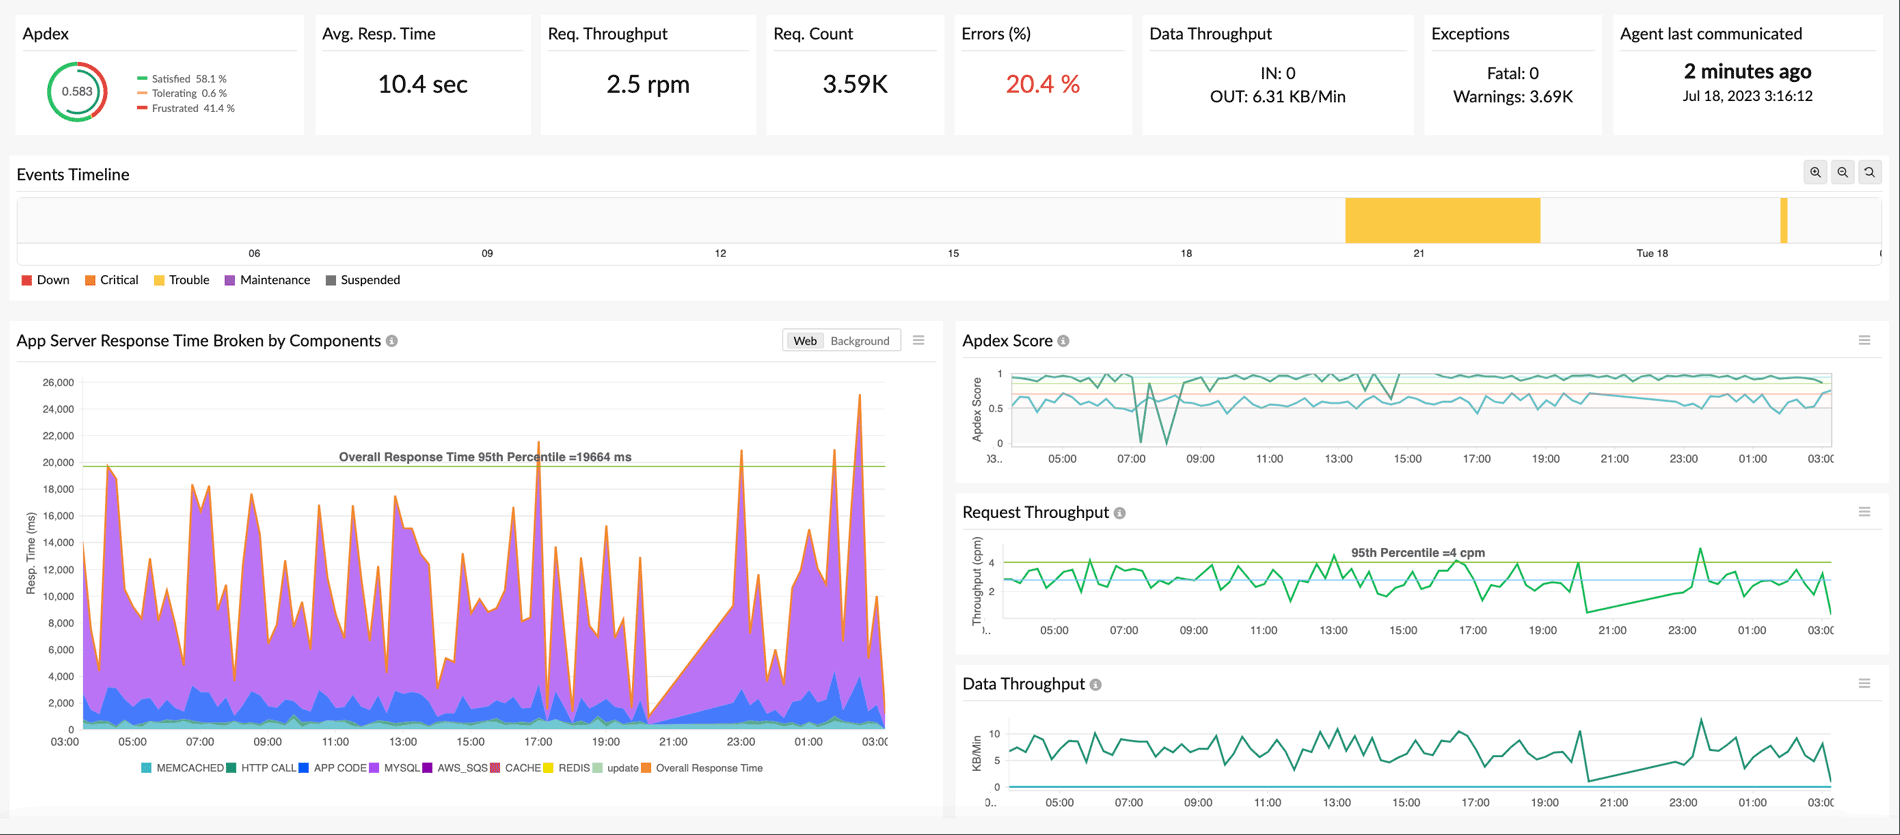
Apart from web transactions, track the various background tasks run by applications such as those associated with maintenance, schedulers, messaging etc.
Additional features in Java APM
- With upto 15 different services supported, monitor all applications accessing your AWS environment.
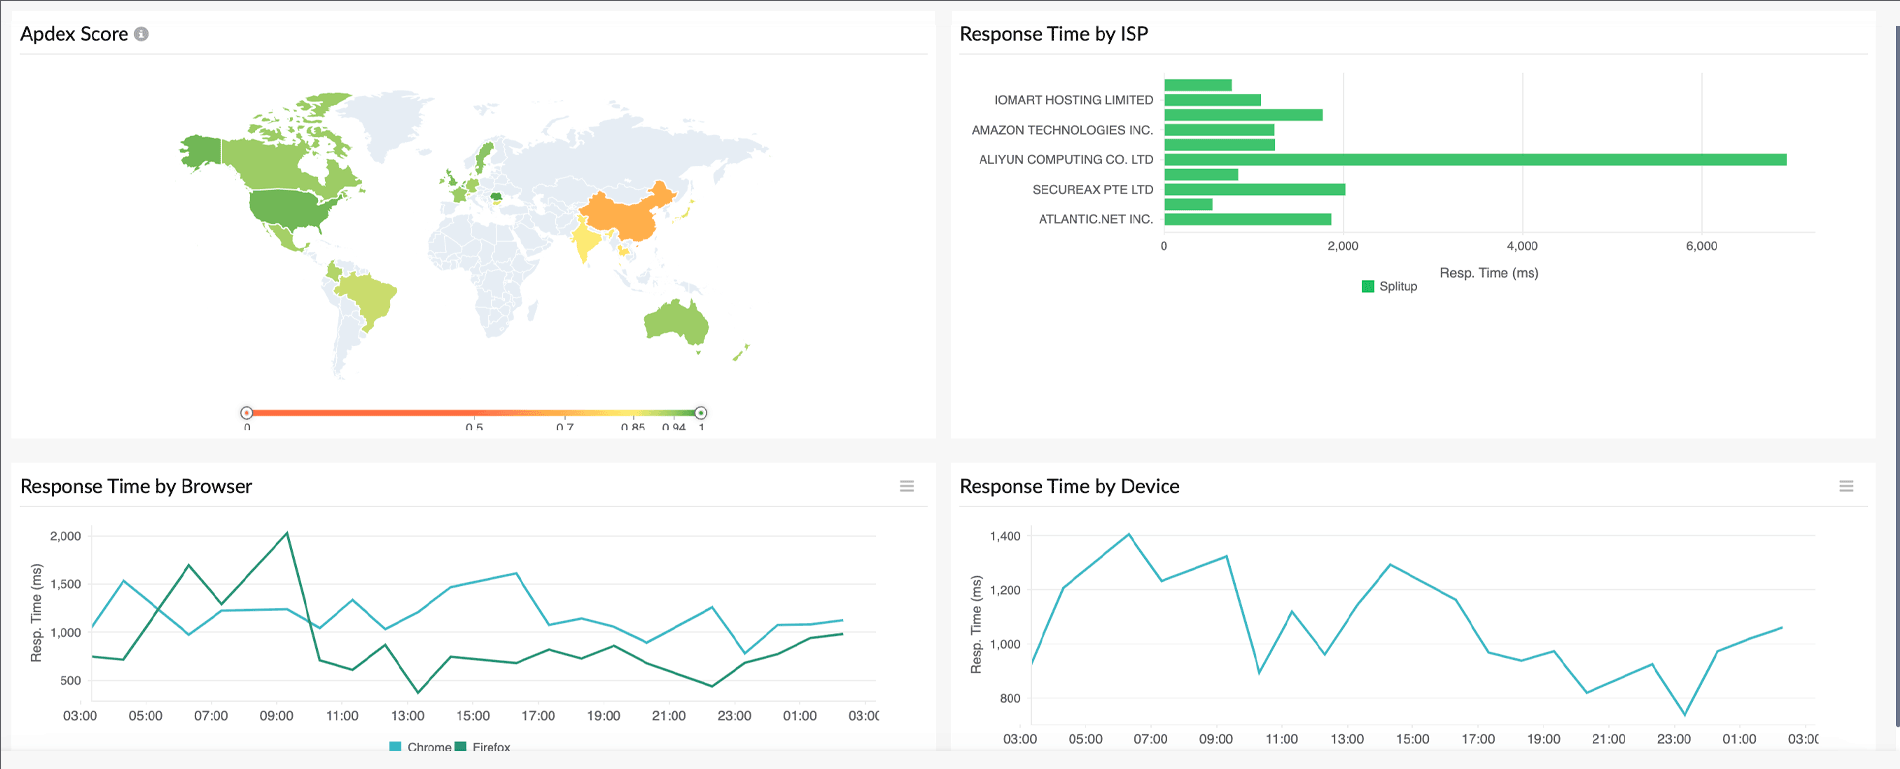
- Integrate APM Insight with RUM and enhance your end user experience.
- Combine APM Insight with Site24x7 Server Monitoring to increase your Java environment monitoring capabilities.
Site24x7's Java monitoring tool supports a wide variety of application servers.
An overview of Java monitoring
1. What is Java monitoring?
Java Monitoring involves actively observing and tracking Java application performance, including server surveillance. It focuses on tracing crucial JVM metrics across platforms like Apache Tomcat, JBoss, GlassFish, and WildFly. This process aids in identifying and fixing errors, thereby improving the user experience.
2. Why is Java performance monitoring important?
Java monitoring tools are essential for understanding and enhancing the performance of Java applications by addressing issues native to them. A Java monitoring tool is important because:
- They allow developers to analyze critical JVM metrics such as CPU and memory usage. This helps in addressing issues like application crashes or slow performance.
- They streamline troubleshooting, making it more efficient in both the pre-production and post-production stages of an application.
- They provide distributed tracing capabilities that help identify the root cause of issues in a microservices architecture.
- They utilize service maps to analyze the impact of remote services like databases and cache systems on the Java application.
3. How does a Java application monitoring tool work?
Users can actively utilize a Java monitoring tool to monitor method-level performance by instrumenting Java applications and gathering and analyzing performance-related data. Instrumentation involves marking the start and end time of a method to capture information on the time spent executing it. Furthermore, you can collect other essential metrics such as arguments passed or SQL queries and aggregate them within a processed request or API, enabling monitoring of your Java application's performance.
While Java applications include built-in tools like JProfiler and VisualVM to assist in performance monitoring, these tools do not provide support for troubleshooting errors, debugging slowness, or identifying problematic methods. Therefore, a Java monitoring tool becomes essential to ensure the seamless performance of a Java application.
4. What are the benefits of having a Java monitoring tool?
Java application performance monitoring tool offers several benefits, facilitating the tracking of unique metrics of your Java application in real-time.
- Allows monitoring of various application-specific metrics such as JVM CPU usage count, memory utilization, garbage collection count and time, and thread summary.
- Enables identification of slow traces, improving anomaly detection.
- Offers AI-powered alerts for proactive monitoring.
- Utilizes Java Management Extensions (JMX) metrics for better management and performance enhancement of your Java application.
5. Why should you choose Site24x7 as your Java performance monitoring tool?
Site24x7's Java performance monitoring tool not only aids in standard response time tracking but also provides distributed tracing to track a single request hopping between various microservices. Our Java monitoring tool allows you to integrate with external servers, like databases and web services, to show performance data. It can also be combined with Site24x7's server monitoring to increase your Java application environment's monitoring capabilities.

