Modern cloud infrastructure requires cloud-scale monitoring. Azure Monitoring collaborates with other Azure services to gather and analyze data on the performance, health, and availability of your applications, infrastructure, and resources. The service offers extensive features for creating custom metrics, tracking performance, logging events, generating alerts, and presenting data and analytics.
For businesses moving to the cloud, Azure Monitoring is critical to ensuring reliability and security.
In this white paper, we will discuss in depth different monitoring strategies, Azure monitoring solutions including for containerized applications, and how to build a robust monitoring solution for Azure services.
Organizations must consider their needs and goals when designing a cloud monitoring strategy. In a real-world use case of an enterprise migrating to Azure, this strategy involves:
Following these steps is key to ensuring optimal performance, high availability, and timely detection of issues in an Azure environment.
Due to their differences, monitoring tactics for public, private, and hybrid cloud deployment models may vary.
The goal is to optimize performance, availability, and security in a public cloud environment while ensuring efficient operations and meeting business objectives.
Monitoring tools and agents should collect performance statistics, logs, and security details for private cloud monitoring, including on-premises workers. Resource utilization, application performance, and security should determine monitoring policies and thresholds.
Tracking private cloud virtual machines, storage, network activities, and other infrastructure is crucial. Organizations can implement services such as Azure Arc for monitoring private clouds. Integrating infrastructure management and configuration tools can additionally automate provisioning, monitoring, and scalability.
This entails the use of both private and public cloud monitoring software. Organizations should leverage tools to integrate monitoring data from both on-site and cloud resources into one platform. This enables you to analyze hybrid infrastructure resource utilization, application performance, and security.
Gaining insightful information and successfully managing your Azure resources and applications both depend on gathering the appropriate data for Azure monitoring.
Start by defining your monitoring goals and then select the relevant Azure components to monitor. Organizations should implement the following services to optimize application/resource performance and security in your Azure environment:
Organizations should also incorporate third-party technologies to improve monitoring and collect data from multiple sources.
Email, SMS, or webhooks are all available for sending Azure alerts. After receiving an alert, you can review monitoring data, logs, and other related metrics to find the root cause of a problem. The services listed above all assist organizations in this process, after which they must decide upon the appropriate response level and remediation. This could include scaling resources, restarting services, changing configurations, or automating remediation.
Alerts may also mandate escalation to higher-level support or specialist teams for further investigation or action.
Having incident response policies in place and following best practices will expedite issue resolution.
Azure Monitor is Azure’s primary solution for monitoring. However, there are other native Azure services for this purpose, along with third-party monitoring solutions that work in combination with Azure, such as ManageEngine’s Site24x7.
Azure Monitor collects and analyzes performance metrics from Azure resources for a unified monitoring experience. It includes Log Analytics for log data analysis and Application Insights for performance monitoring.
With Azure Monitor, users can set up alerts, customize dashboards, and visualize data. It additionally integrates with other Azure services, supports security monitoring, and permits integration with third-party tools.
Azure Logic Apps allows for the collection of monitoring data from Azure services and tools including Azure Monitor and Log Analytics. It can receive alerts, trigger workflows based on specific conditions, and automate remediation tasks, as well as generate reports and visual dashboards based on monitoring data.
Azure Logic Apps offers a comprehensive and flexible tool for monitoring and managing applications in Azure.
Azure Automation creates and executes PowerShell runbooks for monitoring tasks. It integrates with Azure Monitor, Log Analytics, and other services to collect metrics, trigger actions, and generate reports.
Azure Automation can also automate tasks for scheduled execution and create workflows based on your requirements.
Organizations can onboard non-Azure resources for monitoring using Azure Arc. By integrating with Azure Monitor, lightweight agents collect telemetry data, which can then be stored and analyzed using Azure Log Analytics and Azure Monitor Metrics. Organizations can also configure alerts and notifications, while Azure Policy ensures governance and compliance.
Azure Arc provides a centralized view of Azure-native and Arc-enabled resources, with enhanced security monitoring capabilities through integration with other Azure services.
Azure Event Hubs enables the ingestion of telemetry data, offering scalability and reliability. Integration with Azure Stream Analytics and Azure Monitor allows for real-time data processing, insight generation, and proactive monitoring; it also ensures the security and compliance of monitoring data.
For long-term data retention, Azure Event Hubs can be connected to Azure Storage or Data Lake Storage.
Site24x7 automates the discovery and monitoring of Azure resources, providing real-time monitoring, customizable alerts, and notifications. It ensures continuous resource availability, along with performance monitoring features, while integration with Azure AD guarantees secure access control.
Site24x7 also comes with predefined templates to assist in compliance monitoring and extensive support for monitoring applications and infrastructure from different platforms.
Further capabilities include:
Additionally, Azure Kubernetes Service (AKS) can monitor via an agent installation on the cluster, providing detailed metrics on CPU, memory, disk, network, and control plane metrics. The agent also collects Kubernetes events and container logs, which is helpful for developers and DevOps engineers to fine-tune applications and troubleshoot incidents.
Monitoring container applications is critical for ensuring the availability of services. Azure provides monitoring services for detailed visibility to help identify potential issues.
Azure containerized applications improve deployment flexibility, scalability, and resource consumption. Through integration with Azure services and DevOps methods, they simplify application lifecycle management, resource management, and application deployment.
Here's an overview of containerized applications in Microsoft Azure:
Organizations must pay attention to several important areas when monitoring Azure containerized apps to ensure availability, performance, security, and proactive issue response and optimization.
Say an e-commerce enterprise deploys containerized software using AKS. Looking to optimize performance and discover UX issues, they leverage Azure Monitor to keep track of and receive alerts on the following metrics:
These measurements and Azure Monitor Insights allow the organization to proactively identify and resolve performance issues, manage resource allocation, and create a seamless user experience.
Containerization has become an important part of launching apps quickly and easily. However, organizations must monitor it closely for proper functioning and reliability.
The Site24x7 cloud-based monitoring system offers comprehensive monitoring features for Azure container services:
This allows organizations to react rapidly to emergencies with real-time alerts and efficiently troubleshoot by using Azure Monitor. Site24x7’s customizable reporting and dashboards additionally show Azure container services' health, proactively monitoring and optimizing containerized applications for smooth and efficient operation.
 Fig. 1: Azure Kubernetes monitoring with Site24x7
 Fig. 2: Azure Kubernetes Service metrics with Site24x7
The Application Insights SDK allows organizations to monitor containerized applications. Telemetry data is collected for troubleshooting, while distributed tracing lets you detect performance bottlenecks and dependencies by tracking requests as they pass through your application.
Azure Monitor collects container-level metrics, including CPU usage, network traffic, memory utilization, and disk I/O, to indicate resource consumption and performance. With a range of services under its umbrella, it monitors container activity, application behavior, and troubleshooting.
Azure Container insights analyzes data from container workloads running in AKS, detecting abnormal container metrics and threshold breaches. This helps developers and administrators troubleshoot and fix issues faster.
Azure Container insights workbooks let organizations visualize metrics on a dashboard and create custom reports. Azure Log Analytics supports container log and metric correlation, data analysis, and log querying. The connection between the Log Analytics workspace and Container insights improves containerized application troubleshooting and diagnostics.
You can also set up alerts and action groups under Azure Monitor. Automated stakeholder notifications, corrective actions, and scaling all help resolve issues and maintain container performance.
 Fig. 3: Azure Kubernetes Service monitoring with Azure Monitor
 Fig. 4: Azure Kubernetes Service metrics monitoring
Fig. 5: Pod and container monitoring for AKS
Fig. 4: Azure Kubernetes Service metrics monitoring
Fig. 5: Pod and container monitoring for AKS
Organizations can also implement cloud-native monitoring technologies such as Grafana, Prometheus, and Loki to monitor Azure container services.
Inside the Kubernetes cluster, you can configure Grafana, Prometheus, and Loki and then gather metrics via the exporters. To take things one step further, the Prometheus Operator allows you to provision a powerful monitoring solution within Azure Kubernetes Service. Prometheus sets up alerting rules for real-time problem solutions. These technologies enhance Azure container services for improved containerized application visibility, proactive monitoring, and troubleshooting.
There are different deployment approaches for installing the Kube Prometheus Stack, the most common one being a Helm deployment. Following is an example of using a Helm chart to deploy the Kube Prometheus Stack:
 Fig. 6: Monitoring Kubernetes with Prometheus
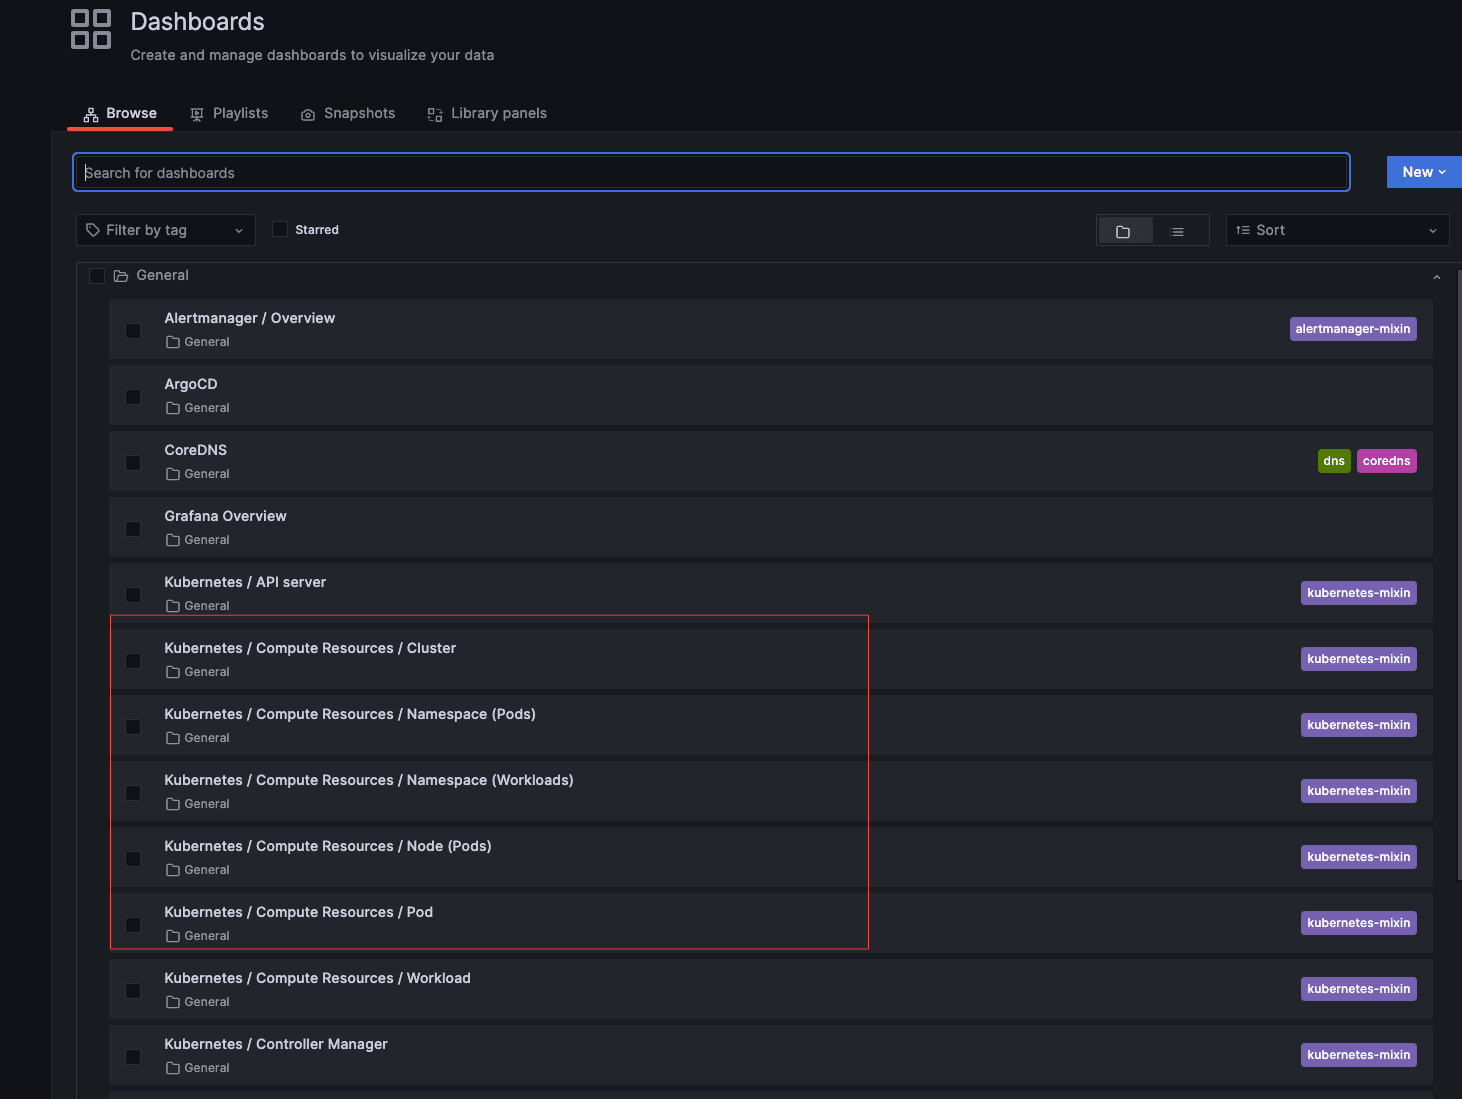 Fig. 7: Prometheus dashboards for Kubernetes
 Fig. 8: Metrics monitoring with Prometheus
 Fig. 9: Cluster-level metrics monitoring with Grafana
Azure Managed Prometheus and Azure Managed Grafana integrate with Azure Monitor, allowing you to monitor Azure container services without maintaining infrastructure. These solutions simplify the deployment, configuration, and scaling of Azure services, as well as your interaction with them, so that you can focus on gathering meaningful data and ensuring the performance and availability of your containerized programs.
Ability to scale for high workloads, allowing you to track and measure container apps of any size and provide a configuration to set thresholds and be alerted to any anomalies via email or webhooks
An enterprise application can additionally use the Azure Prometheus/Grafana managed service to monitor AKS. This allows organizations to visualize metrics in depth and observe the behavior of the application and resources.
The Azure Managed Prometheus/Grafana service provides pre-built dashboards with useful metrics, although organizations can also create custom ones.
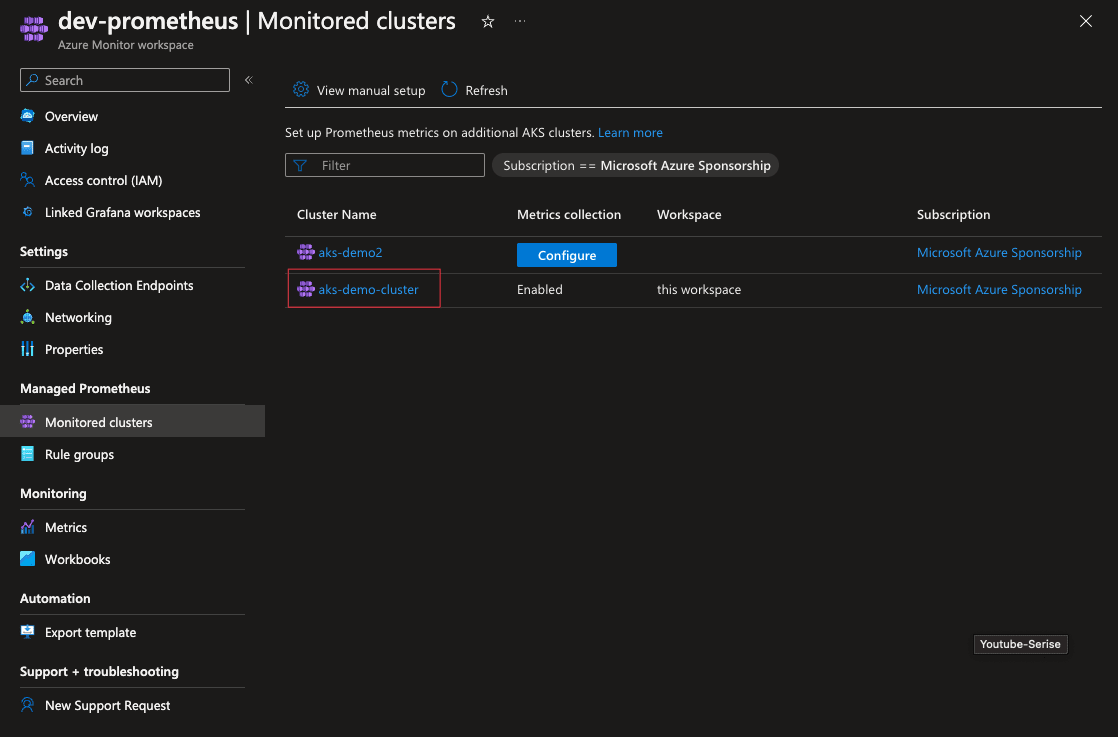 Fig. 10: Azure Managed Prometheus for Azure Kubernetes
 Fig. 11: Azure Managed Prometheus dashboard
 Fig. 12: Data connector for Azure Managed Prometheus
The built-in observability tools of Azure Container Apps let you monitor your container app's health throughout its lifecycle.
These tools include the following:
 Fig. 13: Azure Container Apps metrics
 Fig. 14: Azure Container Apps logs
With the integration of Site24x7, you can monitor your container applications with precise metrics, make adjustments to thresholds, and receive immediate notifications if there is an alert.
Site24x7 supports the following metrics for Azure Container Apps:
Configuring Azure container application alerts and automation involves setting up monitoring rules, selecting alert criteria, and automating actions based on those warnings.
Organizations must properly define metrics and log alerts to monitor container application availability, performance, and health. Setting Azure Monitor thresholds or conditions based on specific time intervals and other characteristics will also alert you when certain measurements or events diverge.
Based on your automation needs, you can choose email, SMS, webhooks, Logic Apps, Azure Functions, or third-party integrations to receive notifications via Azure Monitor in a timely fashion.
Logic Apps and Azure Functions allow organizations to automate alert-triggered tasks, such as scaling container instances, automating restarts, alerting teams or ticketing systems, or running bespoke scripts to fix issues.
 Fig. 15: Azure alerts for containerized apps
Monitoring containerized apps requires multiple steps. Following best practices will help ensure efficient monitoring and optimal performance when it comes to monitoring Azure containerized apps.
First, gather measurements on container functionality, efficiency, and resource use. This will include disk I/O, network traffic, CPU utilization, memory usage, and application-specific data. Azure Monitor and Prometheus help gather and analyze these metrics.
Finding application issues requires monitoring application logs. Check your containerized apps' logs for errors and abnormal events. Loki and Azure Monitor can collect and analyze these logs for efficient and timely debugging.
Tracking containerized app behavior and performance requires baselines. You can quickly spot performance or security issues by monitoring metrics and comparing them to these baselines.
Setting up alerts for thresholds, unexpected behavior, and log events is crucial. Establish conditions for certain log events or thresholds, along with alerts for important resources such as CPU, memory, and network consumption.
Custom dashboards aggregate containerized app metrics and logs. Implement Grafana or Azure Monitor workbooks dashboards to monitor and troubleshoot.
Autoscaling lets you modify container instances depending on the resources being utilized or how much demand your application is experiencing. Organizations can set up automated scaling based on CPU use or request rates.
Azure platform-as-a-service (PaaS) and serverless services help developers build and deploy modern apps more quickly by abstracting infrastructure management so they can focus on writing code and creating value. Azure's PaaS and serverless services can build web apps, orchestrate workflows, and handle event-driven structures.
Azure App Service is a managed PaaS solution that streamlines development and deployment processes through seamless integration with Azure DevOps and CI/CD tools; it also offers a user-friendly interface and CLI tools for efficient management.
Users get support for multiple programming languages and frameworks, scalability options, and integration with various Azure services. The service also prioritizes security and compliance alongside robust monitoring and diagnostics.
Monitoring the right metrics will provide insights into your application’s functionality, performance, and user experience to optimize performance and scalability:
Due to the integration support that Site24x7 provides with Azure App Service, organizations can now monitor their hosted applications with accurate metrics, define thresholds, and receive quick notifications whenever there is a threshold breach.
The full list of metrics collected by Site24x7's Azure App Service monitor is available here.
 Fig. 16: Azure Web Apps application map
The application map in the image above shows the different connections to an application. For example, this application connects to Azure Storage as well as an external database from MongoDB. You can additionally view the performance of connections and drill down to identify any issues with them.
Azure Functions enable event-driven application development. They are easy to manage and develop, have built-in monitoring and diagnostics, and interact with CI/CD workflows.
When monitoring Azure Functions, it is important to track metrics for performance and behavior analysis, such as:
Monitoring these metrics provides insights into capacity planning, performance optimization, fault tolerance, scalability needs, and overall application health.
Metric data is collected every minute via Site24x7's Azure Functions monitoring, while function status is gathered every five minutes.
The full list of metrics that Site24x7 monitors is available here.
\Azure database services offer managed data storage and management. As a fully managed relational database, Azure SQL Database comes with intelligence and high availability. Azure Cosmos DB is a globally distributed database service that enables fast, scalable applications.
Azure also manages PostgreSQL, MySQL, and MariaDB databases with automatic backups, scaling, and monitoring. Azure Synapse Analytics offers organizations both big data and data warehousing services, while Azure Cache for Redis provides high-performance in-memory caching.
These Azure data storage and analytics services provide flexibility, scalability, and management.
Organizations need to track performance metrics including:
By proactively monitoring these areas, you can address performance issues, optimize resource utilization, maintain database security and data integrity, and ensure the smooth operation of your Azure databases.
Azure serverless and PaaS services require a clear strategy and best practices to maintain systems as well as optimize Azure efficiency and effectiveness.
Defining baselines will allow you to understand normal activity and quickly spot anomalies, while proactive alerts will ensure timely notifications.
Azure Monitor allows for centralized monitoring and easy troubleshooting, while distributed tracing lets you uncover service performance bottlenecks and optimize your ecosystem.
Keeping an eye on autoscaling and resource use will maximize performance and efficiency. Monitoring also detects and prevents unlawful access for security purposes.
Exploring your logs enables you to pinpoint faults and troubleshoot them effectively. Performance testing and monitoring data uncover latent possibilities and optimize services.
To extend Azure's administration and monitoring capabilities to multi-cloud and hybrid cloud systems, Microsoft Azure has developed Azure Arc. By integrating this consolidated platform with Azure Monitor, users can monitor resources, regardless of their location, across various on-premises and cloud providers.
Azure Arc provides organizations with centralized management under a single Azure interface, as well as automation, policy enforcement, security monitoring, and scalability for hybrid workloads.
The service enables the monitoring and gathering of metrics, logs, and telemetry data from various resources, including databases, Kubernetes clusters, and virtual machines, across multiple cloud platforms and on-premises architectures.
Azure Arc allows organizations to consistently apply governance controls and enforce standards. You can also automate capabilities such as updating servers and running business workflows through Azure Automation and Azure Logic Apps for streamlined operations.
 Fig. 17: Azure Arc integration
 Fig. 18: Azure Arc VM with service map
 Fig. 19: Azure Arc metrics
Azure's cloud-scale monitoring gives organizations the tools and capabilities required to manage and monitor their cloud-based assets and applications efficiently. With tools such as Azure Monitor, Azure Application Insights, and Azure Log Analytics.
Azure provides a full array of monitoring services that allow for real-time visibility, proactive alerting, and an in-depth understanding of the performance, availability, and security of cloud installations.
Organizations can implement these services to optimize their cloud deployments to give their consumers an enhanced user experience.
Site24x7 integrates seamlessly with Azure Monitor to provide unified visibility into your cloud-scale analytics. It collects metrics, logs, and performance data from various Azure services using CloudWatch APIs, presenting them in a single dashboard.
Yes, Site24x7 allows you to monitor both on-premises infrastructure and multi-cloud environments. It complements Azure Arc to provide a comprehensive view of your hybrid workloads.
Yes, Site24x7 supports monitoring for Azure containerized applications. It offers dedicated monitoring for Azure Kubernetes Service (AKS) and Azure Container Apps, tracking metrics like CPU, memory, and network traffic, along with container health and logs.