Identify and eliminate bottlenecks in your application for optimized performance.
Java's memory management, or automatic cleanup, sounds almost perfect. Unlike C/C++, you don't need to manually free the memory that you have allocated in your code. In Java, when an object no longer has any variables referencing it (*ie* reference count = 0), it becomes eligible for garbage collection. The Java virtual machine (JVM) runs the garbage collector periodically to free such memory for other uses.
However, this doesn't solve all memory problems in your Java application. This is especially true if you have a large application that uses Collections, pipes, and others, which, if not managed correctly, can result in inordinately large memory usage or memory leaks.
As JVM's automatic garbage collection doesn't guarantee that the objects will be recycled, understanding how to manage memory in Java is crucial. A developer needs to ensure that the code handles the objects optimally and makes them eligible for garbage collection when they are no longer required.
By the end of this article, you'll understand the common causes of an OutOfMemoryError in a Java application and how to detect those causes and avoid common mistakes. You'll also learn how to analyze heap dumps to debug and fix the memory issues in your Java application.
This section examines Java's most important memory stores: the stack, heap, and metaspace.
An OutOfMemoryError exception may be thrown for any of these memory stores, and JVM will display a message with the name of the store with that problem. The following is an example of this error on the heap:
Exception in thread "main" java.lang.OutOfMemoryError: Java heap space
Managing memory in Java applications requires an understanding of these different stores.
The stack memory is allocated at runtime for each thread. It stores the primitives, variables declared within a method, and references to the objects on the heap. The stack variables have visibility known as the scope of those variables. Thus, the variables declared within a method are not accessible outside it. Stack uses a last in, first out (LIFO) approach to remove (pop out) those variables when the method returns. Developers must watch out for the deep recursive function calls that may cause StackOverflowError when JVM runs out of stack space.
Besides deep recursive calls, creating a large number of threads can also cause memory issues since each thread has its own stack memory.
Heap is the most important memory store that Java developers need to consider when managing memory. Heap is dynamic—it allocates objects with the new keyword and keeps those objects in memory as long as they are referenced in the code. The garbage collector uses the mark-and-sweep algorithm(https://en.wikipedia.org/wiki/Tracing_garbage_collection#Na%C3%AFve_mark-and-sweep) to recycle the objects and free up heap memory. Developers must ensure that object references are explicitly assigned to null when they are no longer required. Likewise, the Collections (lists, maps, etc.) can grow significantly in production with large data; hence, they must be handled in batches to ensure optimal memory usage.
Java allows optional JVM parameters for setting the minimum and maximum sizes for the heap. For example, -Xms512m and -Xmx1024m specify the minimum as 512 MB and the maximum as 1 GB heap sizes for the application.
Developers must also ensure that they are effectively removing references to the objects and closing connections when they are no longer required. Memory issues crop up when there are errors in the code that deals with these memory stores.
Metaspace is a memory store for class metadata and static data that replaced the older PermGen from Java 8 onward. It is allocated from the native memory (off-heap). OutOfMemoryError issues can occur on metaspace if some classes are loaded multiple times. These problems will be discussed in more depth later in this article.
An optional JVM parameter MaxMetaspaceSize may be used to specify its size. For example, -XX:MetaspaceSize=256m specifies a maximum 256 MB size for the metaspace. In the absence of this parameter, the metaspace is limited by the native memory itself.
Broadly speaking, memory issues arise due to poor resource management and inadequate resource allocations.
Memory issues in Java can have symptoms such as excessive memory usage, where the heap grows abnormally as the Java application runs. The application may also become sluggish due to an underlying memory issue (such as inadequate heap allocation or memory leak), requiring the garbage collector to run frequently.
The usual suspects for these memory problems are Java Collections or rather inappropriate use of these data structures (list, map, etc.). They are discussed in detail in subsequent sections. Some memory problems may also arise due to pipes, large memory-mapped files, or open resources/connections.
The following sections examine the top five memory issues in Java, their causes, and how to resolve them.
Memory leaks occur due to unintentional object references that are erroneously kept in the application even when they are no longer required. This prevents those objects from being garbage collected. Slowly, the accidental leak grows over time and occupies a significant portion of the heap space. This, in turn, forces the garbage collector to run frequently, and the application may crash with the exception: OutOfMemoryError.
The Java application servers use the threads via thread pools, so they are never garbage collected. Hence, the developers must ensure that their code cleans up the thread-local variables (especially Collections) properly. Some memory leaks in Java Collections (map implementations, such as HashMap and Hashtable) may also occur due to incorrect implementation of equals/hashCode methods(https://stackoverflow.com/q/1894377/311786) in the application code. The contract between these two methods specifies that if two objects are equal, they must produce the same hashCode. However, the converse is not true. Any map interface implementation (say, HashMap) uses the hashCode as the key for the object lookup. When the hashCode() method is not explicitly implemented, or if it is incorrectly implemented in the code, the code will not be able to find the object(s) in the HashMap. Moreover, the code will keep adding new objects instead of overwriting the old object, resulting in a memory leak. To avoid this, the developers must use unit tests for the equals contract to ensure that the equals/hashCode methods are implemented correctly.
High memory usage typically occurs when the Java objects and Collections are allowed to grow without an adequate check in the code. This can be handled effectively using correct batch sizes for the Collections and ensuring they do not grow beyond a predetermined value. Alternatively, consider increasing the maximum heap size for the memory requirement of your Java application.
The following code snippet illustrates high memory usage:
public class Main {

	public static void main(String[] args) throws Exception {
  	  List users = new ArrayList<>();
  	  for (int i = 0; i < 25000000; i++) {
  		  users.add(new User("user-" + i, "address-" + i));
  	  }
  	  System.out.println("Created " + users.size()/1000000 + "M users.");
	}
}
class User {
	String name;
	String address;

	public User(String _name, String _address){
  	  name = _name;
  	  address = _address;
	}
}
============== OUTPUT ================
java.lang.OutOfMemoryError: Java heap space
Dumping heap to java_pid1056.hprof ...
Heap dump file created [2906668209 bytes in 25.721 secs]
Exception in thread "main" java.lang.OutOfMemoryError: Java heap space
The previous code adds User objects to an ArrayList in a loop for 25 million iterations. The code then crashes with an OutOfMemoryError on the heap.
A java application may run into an OutOfMemoryError on metaspace if there is a memory leak in the class loader. This memory issue is considerably different from the frequently seen memory problems with the Java objects on the heap. The classes are referenced by their class loader. They are not garbage collected unless the class loader itself is garbage collected, which takes place when the application server unloads the application.
The class loader–related memory issue may arise when duplicate classes are loaded by multiple ClassLoader instances. This usually arises with multiple deployments on the application server when classes are not unloaded during the undeploy (https://en.wiktionary.org/wiki/undeploy) process. Since these issues could be in the ClassLoader library code (some of them may have bugs(https://github.com/classgraph/classgraph/issues/376) as well), developers must ensure that the classes are unloaded before they redeploy their application (it may sometimes require a restart of the application server itself).
Occasionally, this issue may also occur if the size specified by the JVM parameter MaxMetaspaceSize is lower than the application requirement. This can be easily fixed by specifying the appropriate size for that parameter.
In modern Java applications, JSON or XML streams are often parsed to populate the data in Collections, databases, and others. If the application code only uses relatively smaller JSON/XML files/streams during development, it may face memory issues in production when those streams are larger. This is all the more valid for the JSON/XML chunks that are autogenerated and sent over Apache Kafka(https://kafka.apache.org/), RabbitMQ(https://www.rabbitmq.com/), or others.
For example, your application may use a larger Kafka message size in the production, and this could force the code to handle a much larger JSON chunk. This can be handled proactively by parsing such chunks in batches.
However, in some cases, you may need to change the parser itself. The Document Object Model (DOM) parser, for example, reads the entire XML chunk in memory. It's useful for small to medium XML data but consumes more memory for larger data. In comparison, the Simple API for XML (SAX) parser uses an event-driven, sequential approach to handle the XML data and consumes less memory. Thus, depending on the application requirements, a part of the code should be refactored to use the SAX parser instead of the DOM parser to handle larger XML streams efficiently.
Some code (legacy or otherwise) in a Java application may still use the finalize() method (deprecated since Java 9) for the cleanup work, such as releasing resources, closing file handles, and closing DB connections. The JVM calls the finalize() method on all the eligible objects before they are garbage collected, and their occupied space is returned to the heap memory.
However, the cleanup process itself might take longer. If there are a large number of eligible objects with time-consuming finalize() implementations, they will be marked and queued up for finalization for a long time. In this case, the JVM might crash with an OutOfMemoryError.
Since there is no guarantee when or even if the finalization will run at all, the best approach is to avoid finalize() implementations completely. Such implementations make the system fragile, and such code must be refactored carefully by the architect of the system. One approach could be to use the AutoCloseable interface for such objects with the try-with-resources(https://docs.oracle.com/javase/tutorial/essential/exceptions/tryResourceClose.html) statement:
class AutoCloseResource implements AutoCloseable {
    // other code

    @Override
    public void close() {
   	 // closure/clean-up code
    }
}

public void useAutoCloseResource(){
 // AutoCloseResource.close() will be called on try-with-resources completion
   	 System.out.println("Using try-with-resources block to check AutoCloseable");
   	 // use AutoCloseResource
    }
}
Despite all the precautions and best approaches, a Java application may run into an OutOfMemoryError, and you might be required to figure out its root cause(s).
Heap dumps provide the most helpful diagnostic data while debugging an OutOfMemoryError or memory leaks in a Java application. Dumps can help to detect single-object memory leaks, objects pending finalization, and so on. This section explores how to collect and analyze diagnostic data from heap dumps.
You can collect a heap dump with any of the following approaches or tools:
- JVM parameter: Heap dumps can be obtained by passing this parameter to the JVM: -XX:+HeapDumpOnOutOfMemoryError. An additional JVM parameter allows you to specify the file path for the heap dump: -XX:HeapDumpPath=path. This is a preferred option in the production environment since it does not have overheads, and it could help debug memory leak issues as and when they occur.
- jmap: This is a Java command line tool to obtain heap dump by process ID. Usage: jmap -dump:live,format=b,file=<file-name> <pid>.
- jcmd: This is another Java command line tool. Usage: jcmd .</pre>
- JConsole: This is a Java GUI tool; unlike jhat, this one still ships with JDK-9 and later. This can be invoked as bin/jconsole from the command line, and you can attach it to the Java application process by specifying its PID. The heap dump can be obtained from the MBeans tab under HotSpotDiagnostic - dumpHeap.
The following image shows the JConsole with heap memory usage. See how the heap memory usage grows as the User objects get added to the list in the loop (see earlier code snippet):
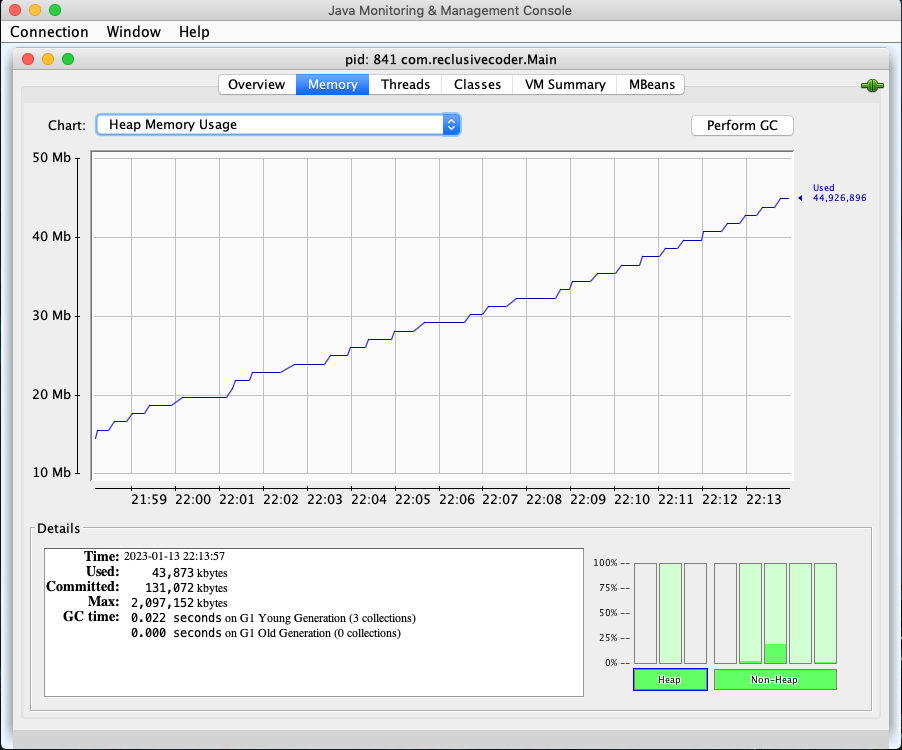 Fig 1. JConsole: Heap Memory Usage
Once you obtain the heap dump (using any approach listed earlier), it can be analyzed using a free tool such as Eclipse Memory Analyzer(https://www.eclipse.org/mat/downloads.php) for troubleshooting the memory leak issues in your Java application. The charts in this section are based on the code example used in the "High Memory Usage" section.
* Pie chart: The following image shows the Eclipse Memory Analyzer overview when the heap dump file is opened. As you can see, one object (users list) in this pie chart occupies almost the entire circle. You can list objects with outgoing references from this tab:
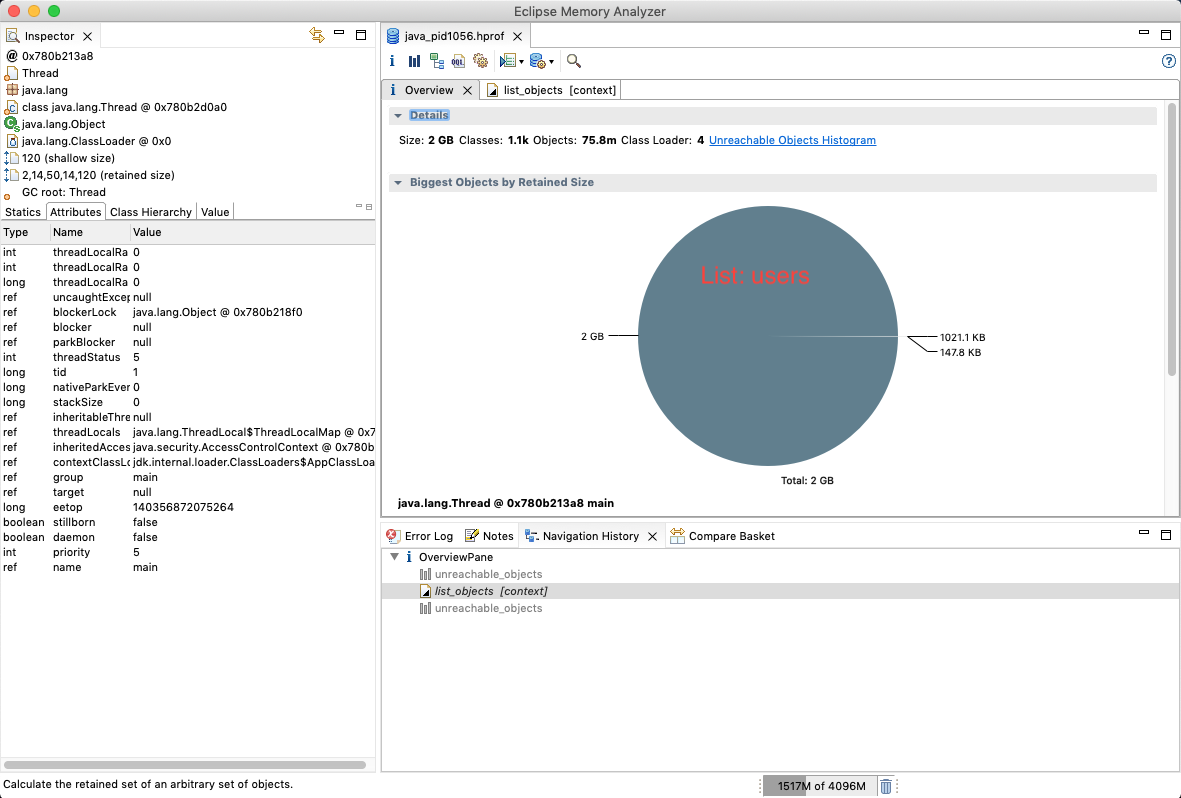 Fig 2. Eclipse Memory Analyzer: Pie Chart
* **List objects:** This second image of the Eclipse Memory Analyzer shows the list of objects occupying the maximum space on the heap, eventually resulting in OutOfMemoryError. It is the ArrayList of User objects. That is, the list of users (Java Collection) that is populated in a loop in the code snippet earlier. This is how you can detect the primary reason for the memory leak from the heap dump using the memory analyzer:
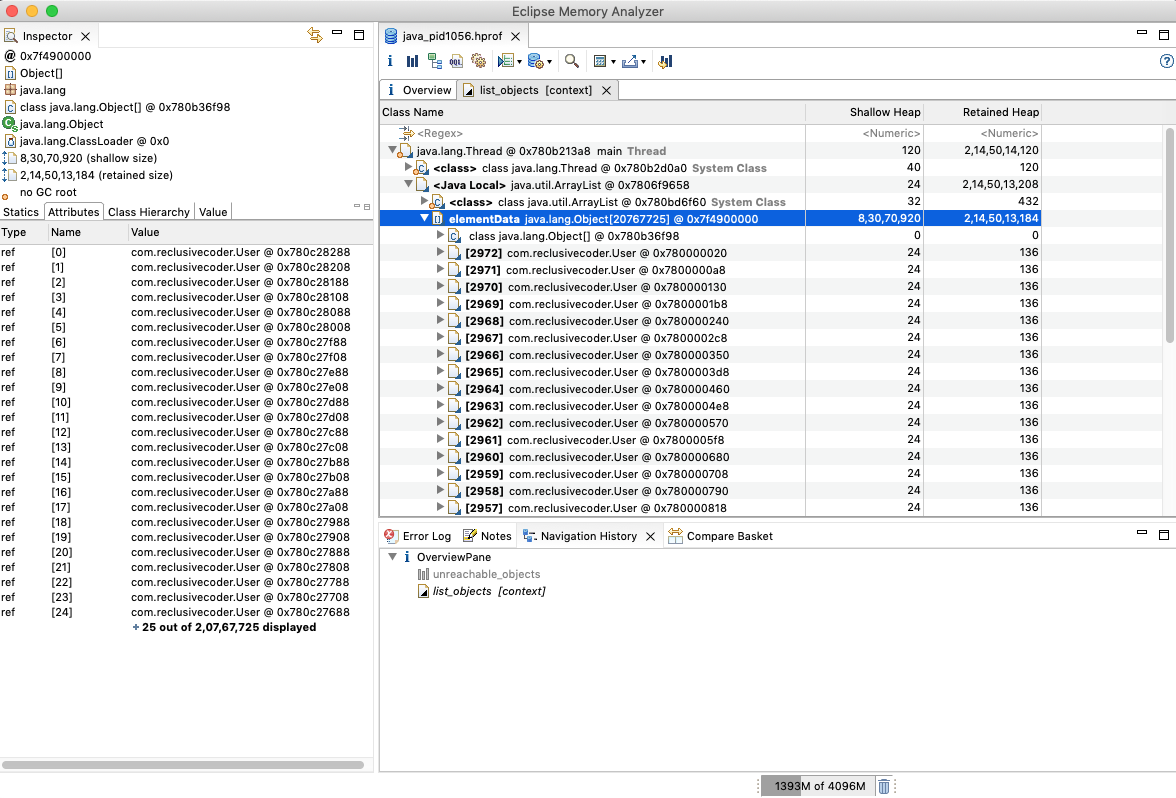 Fig 3. Eclipse Memory Analyzer: List Objects
This article discussed memory management in Java and how automatic garbage collection works.
The article delved into the top five memory issues in Java applications, their probable causes, and how they can be handled.
Lastly, the article explored heap dumps and how to examine the diagnostic data for debugging memory issues. It discussed an example of analyzing a heap dump to detect the primary cause of the memory leak and associated OutOfMemoryError.
For larger Java applications with massive codebases, it's quite difficult and time-consuming to obtain such heap dumps and analyze them carefully. In such cases, Java application monitoring tools can provide useful insights by tracking the key parameters of JVM across multiple platforms. They can show not only memory usage but also many other helpful JVM metrics. You can monitor your Java applications with the Site24x7 Java Application Performance Monitoring tool.
Manish Hatwalne
Site24x7's Java APM agent monitors heap and non-heap memory utilization continuously, offering clear visibility into memory trends and helping you preempt OutOfMemoryErrors.
Site24x7 tracks memory-intensive transactions and provides distributed tracing, allowing developers to identify components and slow methods that are driving up memory usage.
Yes, you can configure custom thresholds for JVM memory metrics in Site24x7 to receive instant alerts via SMS, email, or integrations like Slack when usage spikes.
