Check the health and availability of your Linux servers for optimal performance with Site24x7's Linux monitoring tool.
Network performance analysis is the review of network statistics and metrics carried out to provide system administrators with information about the current network status.
Network systems are complex to their core: They’re made up of multiple elements, from network devices, such as network cables or modems, to network protocols.
Moreover, network performance can be adversely affected by problems with the services or software on the network. For instance, we might face network performance issues even if we invest in high-quality network cables or devices for the production server.
To address network performance problems, we need to:
Linux network performance issues start with Ethernet cards and their configuration present in a Linux server.
Ethernet cards, also known as Ethernet network interface cards, refer to a card installed in a Linux server that enables devices to communicate with the server via a local area network (LAN) using Ethernet for network data transmission. Ethernet cards are made up of two partitions: a physical partition and a logical one. There are two hardware groups in the former; these are the signaling components and media components. A signaling component is responsible for sending and receiving network signals over media components. On the other hand, media components are used to build up a physical medium to transfer the Ethernet signals.
The logical partition, meanwhile, contains a set of rules and standards that allow devices to communicate with Ethernet network systems.
As to metrics, there are two that network administrators should keep an eye on, as they reveal performance issues with Ethernet cards: maximum bandwidth and lost frames.
Traditionally, Ethernet bandwidth is 10 megabits per second. Now, Ethernet cables support up to 100 megabits per second or even 1,000 megabits per second for Gigabit Ethernet.
The bandwidth usage of Ethernet cards can be limited by the network interface configuration. However, if the maximum bandwidth value is set too low, the performance of the Ethernet network will be impacted. If network administrators find out that the value of the maximum bandwidth is below 100 megabits per second, they should take a look at the Ethernet network configuration for the current limited bandwidth value.
Lost frames are frames that are sent in an Ethernet network but cannot reach the targeted network node. If there are several lost frames detected when monitoring the network, there might be some conflicts in the Ethernet switch configuration.
If network administrators manually set up a switch port in full-duplex mode (used when two-way communication in-network is required, from source to target and from target to source), then they disable auto-negotiation on that port to prevent the Ethernet switch from automatically connecting to other devices for security purposes. If parallel detection is already enabled, it will set an auto-negotiating interface connected to that port to set it in half-duplex mode. As a result, a duplex mismatch occurs because you have both half-duplex mode (only one-way communication in-network between a source and a target) and full-duplex mode in the Ethernet network, which can lead to lost frames and low-performance issues.
After checking the performance metrics for Ethernet network interface cards, we also need to examine other common performance metrics such as availability, response time, and network latency. A network system with high-speed data transfer won’t do any good if it also comes with significant data loss.
System administrators should first focus on availability when evaluating network performance. The simplest way to check the availability of a network is by using ping command line tools.
For example, use the ping command to check the state of the network server in the development environment:
ping 10.100.53.41
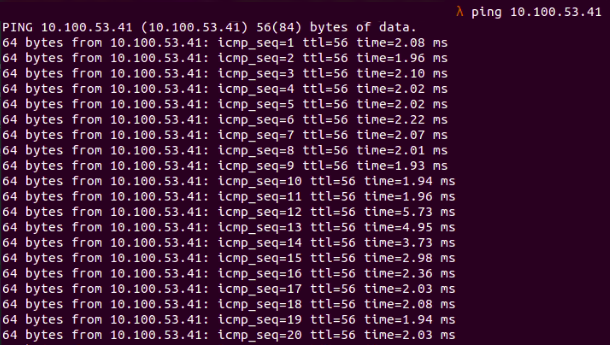 Fig. 1:
 ping command to the local development environment
Network availability indicates that the network server is accessible. However, it doesn’t tell much about the network’s overall performance. From the customers’ perspective, whether or not the request reaches the server is irrelevant.
In addition, clients expect a fast response time from the server—no longer than 3 seconds—or else they might go look for a different product. This is why collecting and analyzing metrics on response time is crucial.
There are certain factors that can affect the response time between a client and server, including:
To collect response time metrics, consider ping commands. As seen in figure 1, with a ping command to the development server, the response time is shown in milliseconds:
64 bytes from 10.100.53.41: icmp_seq=1 ttl=56 time=2.08 ms
For more granular details about the response time—for example, the path packets are taking at any given time—use the traceroute command line tool:
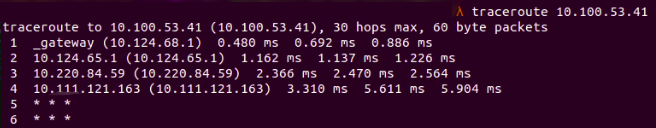 Fig. 2:
 traceroute to development server shows transferred packets
The traceroute command provides insights into how packets are sent from source to target by showing the stops in between and the time it takes for the packets to reach each stop.
The network utilization metric shows how the network system uses bandwidth and helps us determine if there’s anything we can do to optimize this. If network traffic is high, we need to add bandwidth; if it is low, we can save on network bandwidth and invest elsewhere.
When we choose an internet service plan for our home or office, the first thing we tend to look for is network bandwidth. In general, this tells us the maximum speed for uploads and downloads over a connection. The amount of bandwidth available between two network endpoints can significantly affect the overall performance of a network.
The quantity of data that gets transferred from the source to the destination in a specific period of time is called network throughput. Collecting metrics for network throughput allows system administrators to locate any bottlenecks between clients and servers that would slow down network performance.
Network latency indicates the time it takes for a packet to reach its destination and return to its source—this is also known as delay time.
Jitter is an important metric that shows any inconsistencies in the latency. For example, latency may usually be low, but then can suddenly rise. When this occurs, it’s a strong indication that we might be dealing with a network performance issue.
Data loss refers to the number of packets dropped or lost in transmission and delivery over the network. Network errors are exceptions recorded while data is transmitted over the network. Examples of network errors could be connection refused, connection timeout, or reset.
Connectivity metrics indicate whether the connection between the source and the target is working. Improper or malfunctioning connections on the network can adversely affect the entire organization.
Network performance metrics give us insightful data on how the network system works and whether there is any room for optimization. Without network performance metrics, we can’t know if the current system is running properly. This can lead to fatal network-related problems cropping up undetected, which will greatly affect the overall system architecture and user experience.
Moreover, detailed network metrics help system administrators understand end users’ demands and how these users interact with the system. Based on these metrics, network administrators can create an adaptive network that meets future business requirements.
Several network performance monitoring tools, such as tcpdump, iftop, and vnstat, support visualization and can provide an overview of the current status of network performance.
tcpdumptcpdump is a network package analysis tool for detecting and troubleshooting network performance issues. We can use tcpdump in different cases, such as when we need to extract HTTP user agents or HTTP request URLs:
sudo tcpdump -nn -A -s1500 -l | grep "User-Agent:
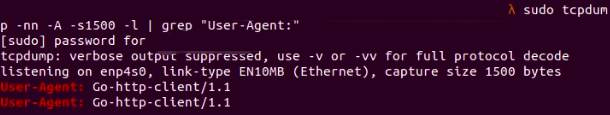 Fig. 3:
 tcpdump combined with grep to filter for “User-Agent”
sudo tcpdump -s 0 -v -n -l | egrep -i "POST /|GET /|Host:"
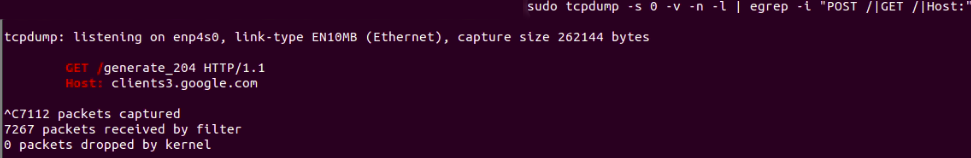 Fig. 4:
 tcpdump combined with egrep to display HTTP request URL
iftopThe iftop command is a tool for real-time monitoring of Linux network bandwidth that counts all IP packets passing through the filter. For example, to sort output by source address:
sudo iftop -o source
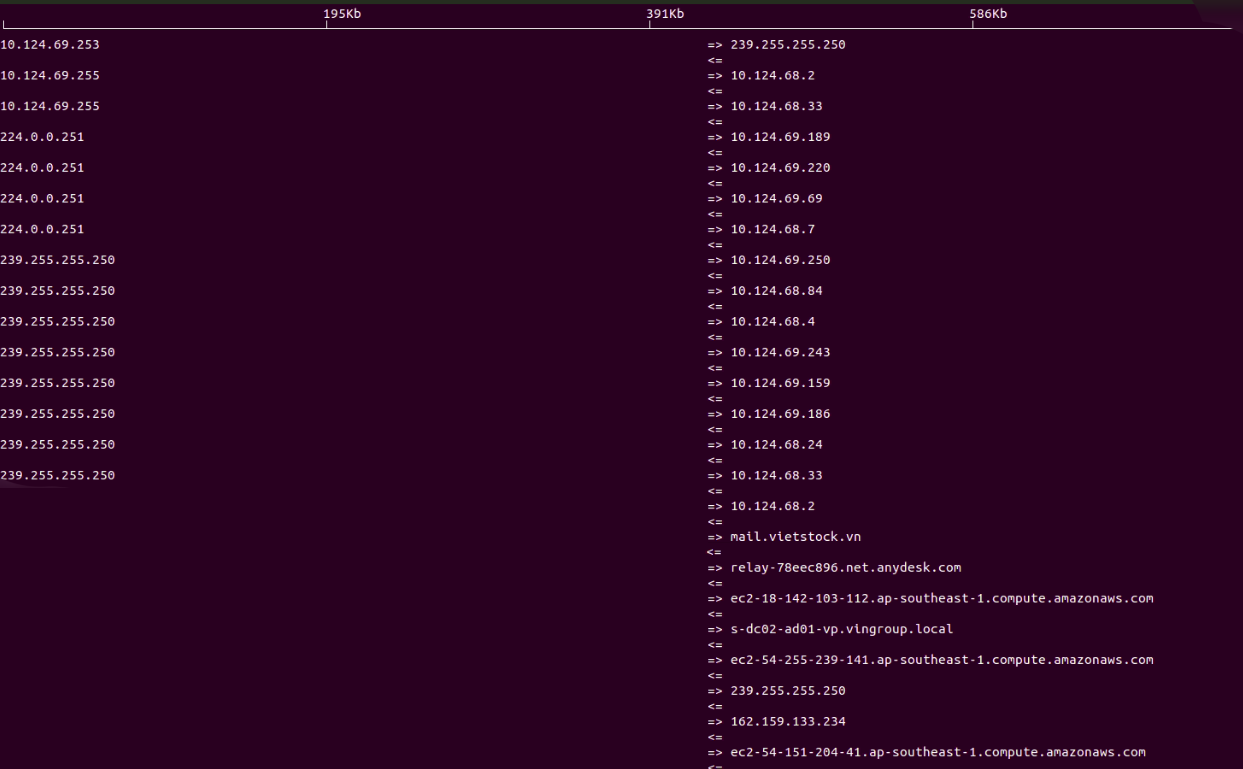 Fig. 5:
 iftop showing IP packets sorted by source
To display the text interface without ncurses:
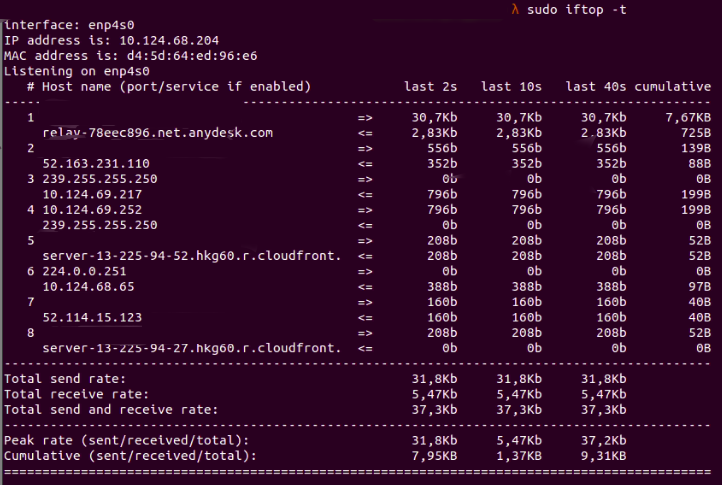 Fig. 6: Display interface without
 ncurses
vnstatvnstat is a popular command line tool used to monitor network parameters, such as bandwidth or traffic going through a network. For example, if we want to get the daily stats of the enp4s0 interface:
vnstat -d -i wlo1
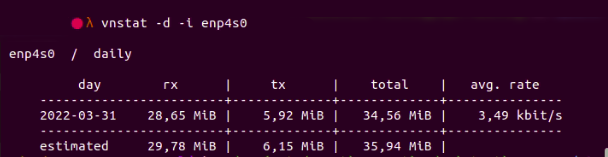 Fig. 7:
 vnstat shows the stats of a network interface
In this next scenario, we’re using Ubuntu as the server for software development. We notice that the development server cannot access the internet. What steps should we take to handle the problem as quickly as possible and allow the developers to get back to work?
First, let’s see if the development server can ping Google:
ping google.com
 Fig. 8:
 ping to google.com failed
We’ve established that we cannot reach google.com. Next, we should check the status of each network interface to see if any of them are down:
ip addr
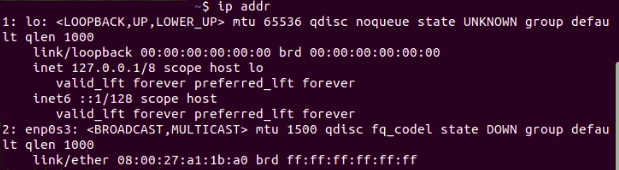 Fig. 9: Checking the status of network interfaces
From the console output, we can see that the status of network interface enp0s3 is DOWN.
The internet is accessible via the enp0s3 network interface—if it’s down, it makes sense that we cannot access the internet.
Let’s try to bring up the network interface enp0s3 to see whether it fixes our internet connection problem:
sudo ifconfig enp0s3 up
Check for ping google.com again:
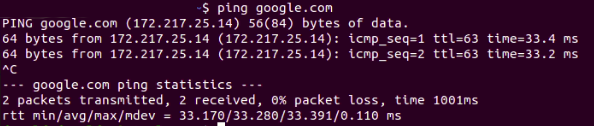 Fig. 10: Able to ping google.com
The network connectivity problem is now resolved.
Troubleshooting Linux network performance issues is an often complex task. It takes a lot of hands-on practice and deep overall knowledge of the software product. For example, we need to know which service requests are sent directly to the MySQL database or which service is applied using caching data in Redis.
This article provides enough information for you to feel confident when troubleshooting Linux network performance issues.
Site24x7 provides comprehensive network monitoring that tracks bandwidth utilization, network traffic, and interface-level errors, giving you immediate visibility into network bottlenecks.
Site24x7 does NOT use global monitoring locations for network latency monitoring. Network monitoring uses agents, SNMP, or direct device polling to measure latency and response times.
Site24x7 tracks dropped packets and network errors, allowing you to configure thresholds and receive alerts before end-users experience connectivity problems.
