Check the health and availability of your Linux servers for optimal performance with Site24x7's Linux monitoring tool.
Though it may be overwhelming at first, the top command can become one of the most useful tools in your arsenal. That’s why it’s one of the most-used commands by system administrators
At a high level, top shows administrators how long the computer has been up and running, the number of users logged in, the average load on the CPU, the memory information, and a list of running tasks. Familiarizing yourself with these metrics and the top interface will allow you to understand how your system is performing, and will help you predict and prevent failures.
In this post, we’ll look at all the information that top provides. We’ll also explore the options by which you can filter and sort processes so you can easily find the process you’re looking for.
But before we dive into metrics, we first need to familiarize ourselves with the user interface.
Different versions of top have different UIs. For example, the screenshot in figure 1 below is from a Linux computer, Ubuntu 18.04 specifically, while the one in figure 2 is from a MacBook Pro running MacOS Monterey. We can easily see the differences in these UIs, including disk and network usage in the MacOS version, and a lot more columns in the task area. For this article, we’ll be looking at the Ubuntu version of top.
 Fig. 1: Top command UI on Ubuntu 18.04
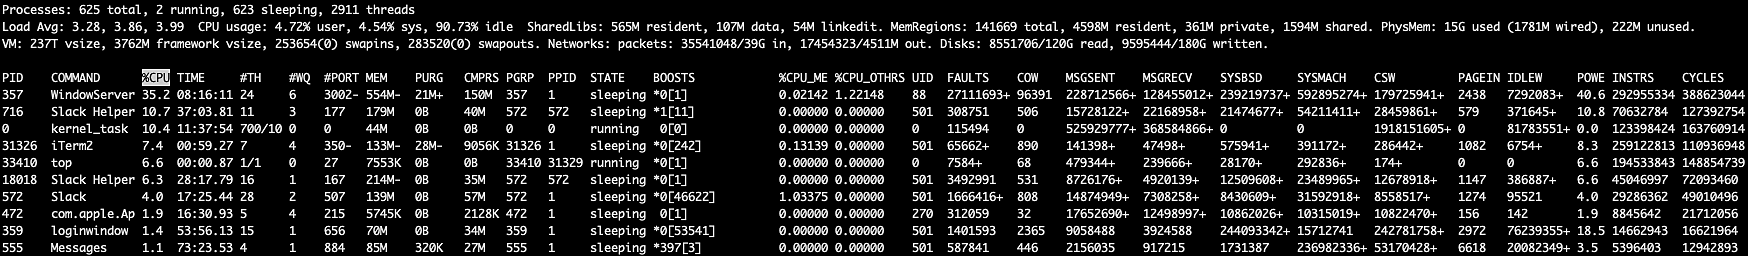 Fig. 2: Top command UI on MacOS Monterey
The top UI can be divided into two main areas, the dashboard and the task area. The dashboard is where we get all of the information we need at a very high level, while the task area gives us a specific list of all the running tasks and the amount of system resources they're consuming.
The dashboard gives us a summary of everything going on in the system and should provide enough information for a system administrator to identify potential issues. The dashboard can be divided into five different areas.
The first line in the dashboard gives us the time, how long the system has been running, the number of users logged in, and the average load on the CPU.
From figure 3, we see this computer has been up for 847 days. The next part of the line tells us that there's currently one user logged in. The next segment gives us the average load on the CPU in the last one minute, five minutes, and 15 minutes.
The second line gives us the number of tasks currently running.
From figure 4, we see there are 92 tasks—of which one is running, 55 are sleeping, and none are stopped or in the zombie state.
The third line is all about CPU.
As we see from figure 5, line three gives us a lot of information. Let's look at each piece individually:
Line 4 gives us a complete overview of memory resources.
As you can see in figure 6, we get the total amount of memory available, the amount of memory free, amount of memory used, and the amount of memory buffered or cached. Note that these memory numbers are in kibibytes (ozanerhansha.medium.com/kilobytes-vs-kibibytes-d77eb2ff6c2a), as indicated in the screenshot.
The last line gives us information about the swap memory.
There are four metrics here as well—total, free, used, and available swap memory. The available swap memory includes the expected recoverable memory from caches as well, and these numbers are also in kibibytes.
The next main area in the top UI is the task area. Let's look at all the information we get from the task area in more detail.
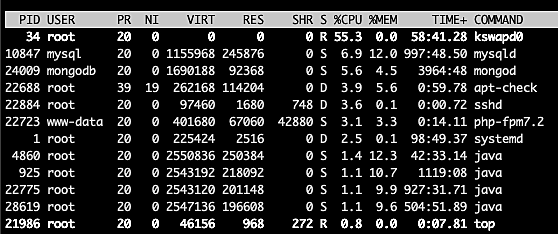 Fig. 8: Task area of the top command
We see from figure 8 that there are 12 columns in the task area. Here's what each one of them tells us:
Now that we understand the various pieces of information we get from the top command, let's see a few examples of how we can use this to perform various operations.
Using top, we can identify the process we want to kill and get the corresponding PID. We then use the key k to kill that process. For example, suppose we want to kill the mysql process from figure 8, where we see that the PID is 10847. To kill this process, run top and hit the key K. As shown in figure 9, top will ask for the PID. Enter 10847, and top will kill the process.
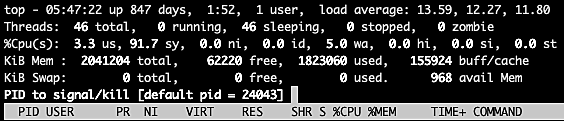 Fig. 9: Kill a process using the top command
Sorting processes in the task area help us identify the processes taking up more memory or consuming a lot of CPU. The tasks list can be sorted by fields such as %MEM or %CPU, using the o (override-sort-field) option.
 Fig. 10: Task area sorted by percentage of memory used
In figure 10, the processes are sorted by the percentage of memory used in descending order. The syntax is as follows:
top -o +%MEM
The + indicates descending order, and - indicates ascending order. We can do similar sorting on the %CPU field using the following command:
top -o +%CPU
We can list all the threads of a process using top with a couple of options. For example, if we want to list all the threads of MongoDB running on our computer, we can do that with the following command (assuming PID of MongoDB is 24009):
top -H -p 24009
As we see from figure 11 below, only threads for the MongoDB process are listed in the task area.
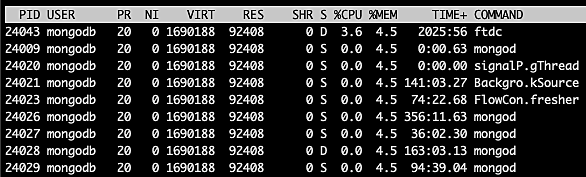 Fig. 11: Listing only MongoDB threads
Option H will turn on the threads mode while option p will list the threads only for the given process.
We can get the full path of processes running in top, as shown in figure 12 below:
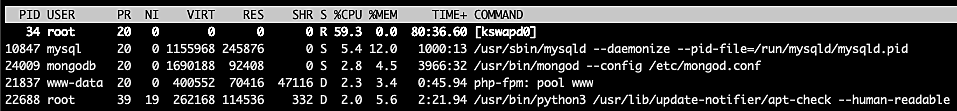 Fig. 12: Showing full path of processes
To get these paths, use the option c, as follows:
top -c
top’s forest view gives a parent-child, hierarchical view of the process, as shown in figure 13.
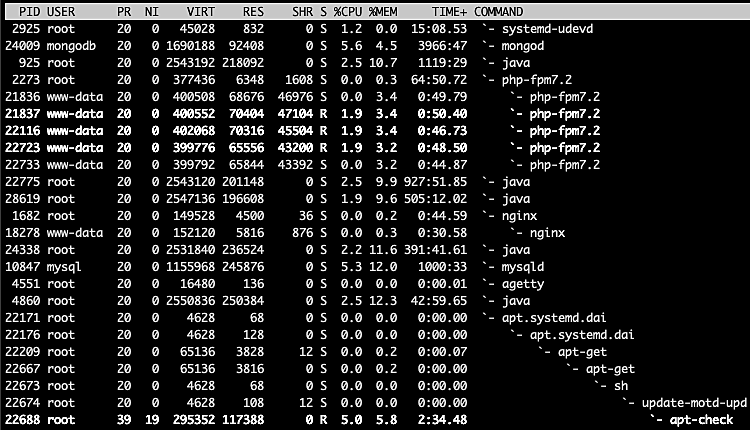 Fig. 13: Forest view in the top command
To generate this view, run top and hit the V (upper case V) key to turn it on.
We can also filter the tasks list to show processes for a particular user.
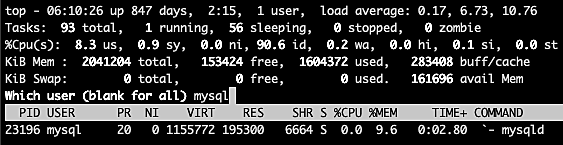 Fig. 14: Filtering processes for a user
To do this, we’ll run top, then hit the U key. We'll see a prompt in the interface to enter a username. Leaving it blank will show processes for all users. In figure 14, we've listed the processes for user mysql.
We’ve shown here that top is one of the most powerful and feature-rich tools for a system administrator. Understanding the information the command provides, as well as the various options and filters available, will help you identify the cause for any issue and easily kill the process if needed.
As with anything, gaining an intuition for top requires practice, but the effort will pay off.
Yes, Site24x7 Linux monitoring agent continuously collects and visualizes CPU, memory, swap, and process-level metrics, providing a historical view that top cannot. Site24x7 also supports dynamic thresholds (AI-based anomaly detection) to automatically alert you when resource consumption exceeds normal patterns.
Site24x7 automatically discovers and tracks all running processes, alerting you when specific services consume excessive CPU or memory. This saves you from constant manual monitoring and provides historical trends for analysis.
Yes, Site24x7 provides a unified, centralized dashboard where you can view health and performance metrics across all your Linux servers simultaneously. The dashboard offers comprehensive insights into CPU, memory, and process metrics, similar to what top provides but with additional historical data and alerting capabilities.
