Baseline your servers and optimize your applications with Site24x7 SQL monitoring tool.
Optimizing slow SQL queries for large datasets
Large datasets can pose a significant challenge to SQL performance. As the size of the dataset increases, SQL queries become slower and less efficient. Responses become sluggish, and the applicationperformance suffers. End users get frustrated, their productivity plummets and database maintenance costs rise.
When you optimize SQL queries, you can significantly improve the application’s performance. This hands-on article reviews several techniques to enhance SQL Server query performance for large datasets.
Improving SQL Server query performance on large datasets
To learn how to improve SQL Server query performance on large tables, you’ll first need to create the dataset. Then, you’ll need to identify, analyze, and optimize slow-running queries.
Prerequisites
To complete this tutorial, ensure you have the following:
- Microsoft SQL Server
- Azure Data Studio (Mac) or Microsoft SQL Server Management Studio (Windows)
- A database
Although this tutorial uses Azure Data Studio to execute all the SQL query examples, the steps are the same for using SQL Server Management Studio on Windows.
Step 1: Create the large dataset
First, you need a large dataset to explore all the techniques in this article. Using the SQL query below, create a sales table with one million rows of randomly generated data:
CREATE TABLE sales (
    id INT IDENTITY(1,1),
    customer_name VARCHAR(100),
    product_name VARCHAR(100),
    sale_amount DECIMAL(10,2),
    sale_date DATE
    sale_date DATE
)

DECLARE @i INT = 1

WHILE @i <= 1000000
BEGIN
    INSERT INTO sales (customer_name, product_name, sale_amount, sale_date)
    VALUES (CONCAT('Customer', @i), CONCAT('Product', FLOOR(RAND()*(10-1+1)+1)),
FLOOR(RAND()*(1000-100+1)+100), DATEADD(day, -FLOOR(RAND()*(365-1+1)+1), GETDATE()))
    SET @i = @i + 1
END
Step 2: Identify slow-running queries
Once you have the dataset, it’s time to optimize SQL queries. Your first step is to identify slow-running queries.
You can use the sys.dm_exec_requests system dynamic management view (DMV) in SQL to find these queries. This view provides plenty of information about the running queries, including status, CPU time, and total elapsed time. Monitoring those metrics helps you identify the slow queries.
For example, examine the following query that retrieves customer names and their total sales amounts for the year 2023 from the sales table:
SELECT customer_name, SUM(sale_amount) AS total_sales
FROM sales
WHERE YEAR(sale_date) = 2023
GROUP BY customer_name
Once the query is running, use the sys.dm_exec_requests DMV to view the query’s progress:
SELECT r.session_id, r.status, r.total_elapsed_time, r.cpu_time, r.wait_time, r.command
FROM sys.dm_exec_requests r
CROSS APPLY sys.dm_exec_sql_text(r.sql_handle)
WHERE status != 'sleeping'
This action returns a list of active queries on the server with their total elapsed time and CPU time. Evaluate those stats to determine if your query is running slowly:
 Fig. 1: Identifying slow-running SQL queries
The example query above returns stats like a total_elapsed_time of 1,178 milliseconds and a cpu_time of 1,736 milliseconds. If these times seem unusually long for your specific application, you can optimize the query to improve its performance.
Waiting versus running queries
SQL queries fall into two categories: waiting and running. Understanding their differences is crucial for optimizing query performance.
A running query actively uses system resources, including CPU, memory, and disk I/O. A waiting query waits for another query to finish or for system resources to become available.
Running and waiting queries can both impact your database’s performance. Waiting queries can block other queries, slowing running queries and response time. Optimizing both types of queries help improve SQL Server performance on large datasets.
Step 3: Analyze and optimize slow-running queries
Now that you've identified slow-running queries, the next step is to improve them. You can incorporate a few best practices into the SQL queries to improve their performance on large datasets.
Limiting returned data
To optimize SQL queries when working with large datasets, consider limiting the data these queries return via window functions or pagination.
Window functions can group, aggregate, and limit data from large datasets. For example, a sales table may have a million rows, and you want to show 10 records per page. Use the ROW_NUMBER() window function to assign row numbers and filter based on the desired page, like in the code below:
DECLARE @page_number AS INT;
SET @page_number = 2;

WITH numbered_sales AS (
   SELECT *, ROW_NUMBER() OVER(ORDER BY sale_date) AS row_num
   FROM sales
)
SELECT * FROM numbered_sales
WHERE row_num > 10 * (@page_number - 1) AND row_num <= 10 * @page_number
This code returns 10 records on page two:
 Fig. 2: Limiting data using a window function
Alternatively, pagination divides requests into smaller sets to limit the data the query returns, improving the query’s performance. The code below returns only 10 rows at a time:
DECLARE @page_number AS INT;
SET @page_number = 2;

SELECT *
FROM sales
ORDER BY sale_date
OFFSET (@page_number - 1) * 10 ROWS
FETCH NEXT 10 ROWS ONLY
These data-limiting techniques can significantly improve SQL query performance when working with large datasets.
Indexing
Indexing is a critical technique for improving SQL query performance on large tables. It creates pointers to the table’s data, accelerating data retrieval. Indexes are handy when dealing with large datasets, as they help pinpoint where the query should search for the information, reducing the amount of data the query must scan.
However, creating indexes on all the table columns isn't always the best solution. It's essential to identify and then create missing indexes or fix incorrect ones. You can use the execution plan that SQL Server Management Studio or Azure Data Studio provides while running a query. The execution plan gives a Missing Index warning, so you know which one to fix.
For example, suppose you want to retrieve a single customer name from your sales table. You might have to scan a million rows to find the customer named “Customer10098.” Running this query can waste time and resources if an index is missing. Instead of focusing on the target column, the query must scan all that data to find what it needs.
You can use the execution plan to identify and create the missing index. First, press CTRL + M on Windows or CMD + M on Mac to open the execution plan. Then, run the query below:
SELECT *
FROM sales
WHERE customer_name = 'Customer10098'
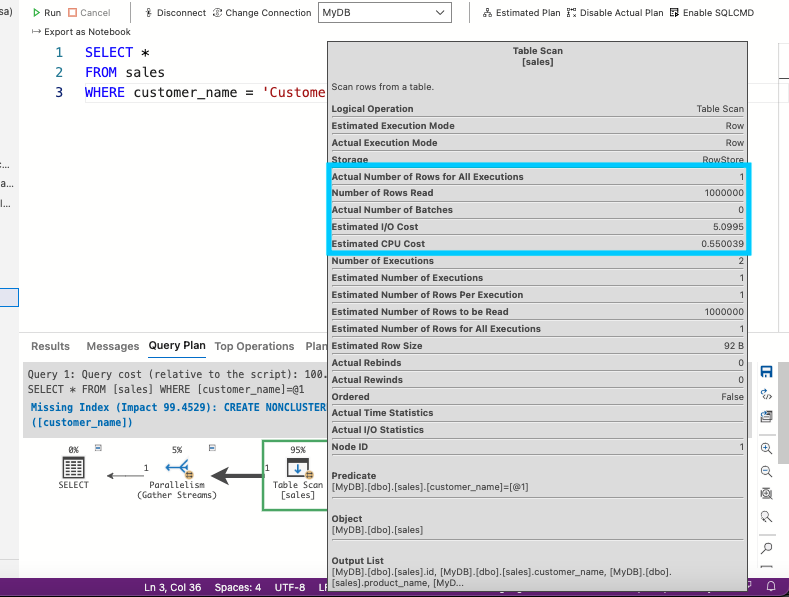
After running the query, the execution plan shows that the Table Scan operation used 95% of the overall query cost. Click Table Scan operation. This example shows that the query read 1,000,000 rows, which is more than needed:
 Fig. 3: Performing a table scan operation
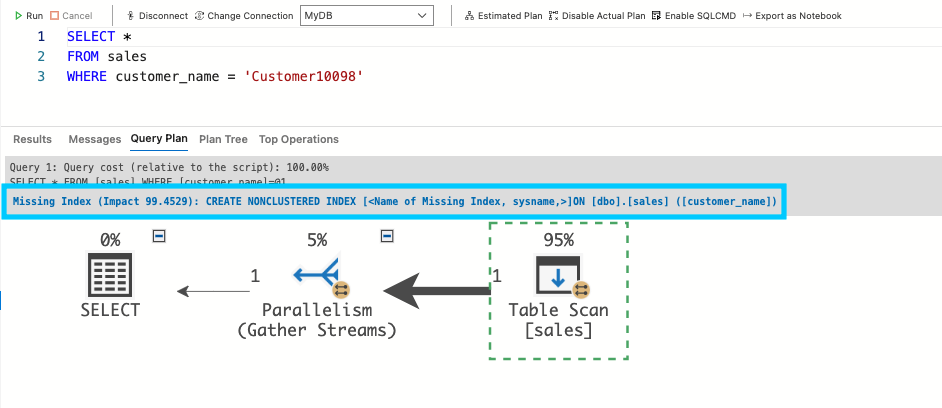
Creating an index on the customer_name column will optimize the query. The execution plan shows a Missing Index warning and suggests how to make the index:
 Fig. 4: Identifying the missing index
Click the Missing Index warning to view the example code for creating the index:
 Fig. 5: The missing index suggestion
You can make two types of indexes to improve queries: clustered and non-clustered. A table can only have one clustered index, which decides the data’s physical order. A non-clustered index is separate from the table, storing a copy of the indexed columns and pointing to the original data.
Clustered indexes are ideal for frequently searched columns, such as primary keys, that often join tables. Non-clustered indexes are useful for columns that queries commonly search but not necessarily for joining tables. This example uses a non-clustered index.
To create the index, uncomment the code that the query processor suggested. Be sure to replace MyDB with your database’s name:
USE [MyDB]
GO
CREATE NONCLUSTERED INDEX [ix_customer_name]
ON [dbo].[sales] ([customer_name])
GO
After creating the index, rerun the query and compare the statistics to see the query’s improved performance:
SELECT *
FROM sales
WHERE customer_name = 'Customer10098'
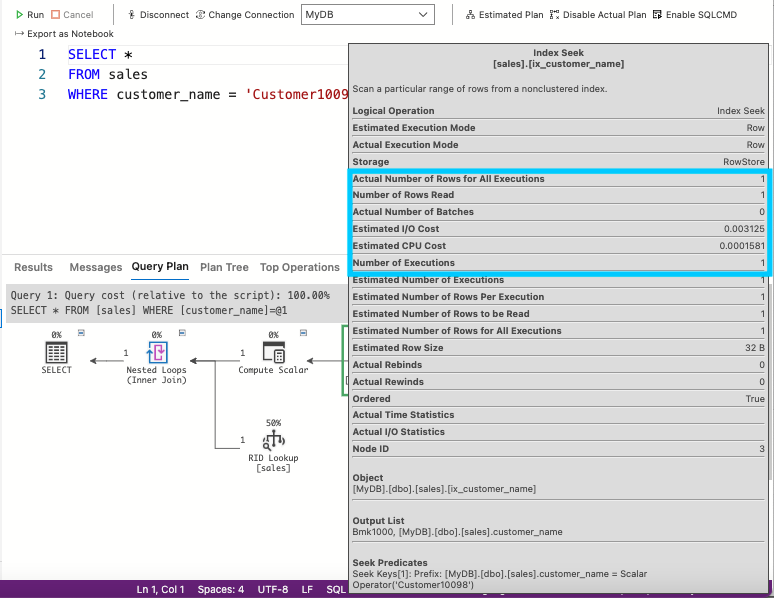
This approach displays the same statistics as before, such as the Number of Rows Read. However, this time, it shows the query read 1 row instead of 1,000,000:
 Fig. 6: Displaying the statistics
The statistics show that the number of reads, CPU cost, and I/O cost have decreased significantly. The query is now using the index and performing much better.
Parallel execution
Parallel execution improves the performance of SQL Server queries by running large queries on multiple CPUs, dividing the work among processors to process large amounts of data more efficiently.
The MAXDOP value determines the maximum number of logical processors for the query. It’s 0 by default. So, to enable parallel query execution and boost query processing time, set the MAXDOP option to a value greater than 1.
For example, the code below has parallel execution disabled, with the MAXDOP option set to 1. This setting limits the number of processors that can run the query, increasing the time to process the request:
-- Disable parallel query execution
SELECT customer_name, SUM(sale_amount) AS total_sales
FROM sales
WHERE YEAR(sale_date) = 2023
GROUP BY customer_name
OPTION (MAXDOP 1)
 Fig. 7: Disabling parallel execution
Stats will show that the total_elapsed_time and cpu_time are high.
To optimize this query, increase the number of processors. Set the MAXDOP option to a value higher than 1 using the code below:
-- Enable parallel query execution
SELECT customer_name, SUM (sale_amount) AS total_sales
FROM sales
WHERE YEAR (sale_date) = 2023
GROUP BY customer_name
OPTION (MAXDOP 4)
The code has MAXDOP set to 4, so SQL Server can use up to 4 processors to execute a query.
Query design impacts the effectiveness of parallel execution. Large queries that involve sorting, grouping, or joining operations are good candidates for parallelization.
To optimize queries for this parallel execution approach, simplify the query structure, use appropriate indexes, avoid blocking operations, and use suitable data types. Combining these techniques with parallel query execution can reduce the query processing time and improve overall system performance.
Conclusion
Optimizing SQL queries for large datasets is essential for improving application performance. Identify slow-running queries, then use window functions and pagination, indexing, and parallel execution to help these SQL queries run faster. Remember to optimize queries for parallel execution and choose the appropriate index type for your dataset.
When your queries run as fast as possible, your end users quickly get the information they need and remain productive.
FAQs
1. How does Site24x7 identify slow SQL queries?
Site24x7 APM Insight agents (for Java, .NET, PHP, etc.) automatically trace database calls. They capture the exact SQL statements that take the longest to execute and display them with execution time and call counts.
2. Can I see which application transaction triggered a slow query?
Yes, Site24x7 provides end-to-end transaction tracing. You can drill down from a slow web transaction directly to the specific database query causing the delay.
3. Does Site24x7 support monitoring specific database servers?
Site24x7 offers dedicated plugins and integrations for major databases like MySQL, PostgreSQL, SQL Server, and Oracle to monitor server-level health, buffer usage, and connection stats alongside query performance.
