Performance issues in Azure SQL Server can be a significant hindrance. A sluggish database can bring your entire service to a halt.
Slowdowns are often easily noticeable but identifying their causes can be challenging. With many metrics to monitor and various diagnostic methods, it can be overwhelming to navigate and troubleshoot SQL Server performance slowdowns.
However, diagnosing and alleviating these problems can become a manageable task once you understand common performance issues that arise in Azure SQL Server and familiarize yourself with best practices for determining the root cause.
This article explores the most common performance problems in SQL Server and best practices for diagnosing and resolving these issues.
To troubleshoot performance bottlenecks in a database, you must identify the root cause and find ways to resolve it. This section explores types of performance bottlenecks and the best ways to optimize your query and reduce its complexity. Finally, it reviews effective tools for diagnosing performance issues in Azure SQL Server.
Performance bottlenecks can be broadly classified into two categories: running and waiting.
Running bottlenecks occur while a query is compiling or executing, resulting in a delay. The most common causes of running delays are insufficient or overused resources or poorly designed queries.
For example, if your query is trying to retrieve large amounts of data from a single table and the server needs more memory to process the query, you may experience running delays. Running bottlenecks also occur if your query has complex calculations or uses multiple joins and sub-queries, causing the server to spend more time compiling the query.
Waiting bottlenecks prevent the query from executing as it waits for other resources to become available. Some common causes of waiting issues include blocking, I/O, memory grants, and tempdb usage. tempdb is a system database that stores temporary objects created during the execution of a query, such as temporary tables, temporary stored procedures, and variables.
For example, if a query is waiting for a resource lock to be released, it will cause a waiting issue. Similarly, if a query requires a large amount of memory and the database lacks sufficient memory, the query may wait for the memory grant, causing a waiting issue. If a query generates a substantial amount of temporary data that needs to be stored in the tempdb, it may cause the database to wait for available disk space in the tempdb, leading to delays.
Monitoring and understanding the behavior of the query and its resource usage is important when trying to diagnose and alleviate SQL Server performance issues. This information can help you identify the specific cause of the performance issue and determine the most appropriate course of action to resolve the issue.
While experiencing a running delay, you may need to optimize your query to reduce its complexity or minimize the amount of data it retrieves. In contrast, a waiting issue may indicate that you need to allocate additional resources. You can accomplish this by creating additional memory or disk space, designating more resources to the database, or modifying your query to reduce resource usage.
Diagnosing performance problems can be challenging, but monitoring resource metrics in the Azure portal provides valuable insights into the root cause of the issue. In addition to following best practices for diagnosing performance issues, you can use tools like Site24x7's Azure Monitoring tool to help. It offers comprehensive monitoring of over 100 Azure services, providing detailed insights on the availability and performance of your entire Azure cloud infrastructure. The tool enables near real-time monitoring, with status update alerts and out-of-the-box reports to help you stay on top of critical issues.
But effective SQL Server performance starts with you. The following sections review how you can use the Azure Portal to diagnose performance problems and ensure that your Azure SQL Server operates optimally.
The Azure Portal is one of the most effective tools for diagnosing performance issues in your SQL Server. It provides real-time visibility into the performance of your database, including metrics for CPU, memory, I/O, deadlocks, and more.
A workload that uses a lot of CPU or IO resources could mean that it needs more resources to run effectively. For example, if your CPU usage is constantly high, then your database needs more CPU power to handle the workload. High usage could also mean your queries should be optimized to run more efficiently.
You can monitor resource metrics in the Metrics view inside the Azure Portal. Reviewing performance metrics gives you visibility into the behavior of your database over time, enabling you to easily identify trends and patterns that may be causing performance issues.
Query Performance Insight is a powerful tool in the Azure Portal that identifies which queries consume the most resources and running time in your workload. It provides several metrics and visualization tools to help you isolate the cause of performance issues. Its performance analysis dashboard provides information on the slowest queries, query wait statistics, and performance statistics by database. You can also view a detailed breakdown of resource usage, including CPU, memory, and I/O utilization, which helps identify performance bottlenecks and resolve slowdowns.
In addition to identifying performance problems, Query Performance Insight also offers query-tuning recommendations. You can examine the performance of individual queries based on CPU consumption, duration, and execution count and view the resource utilization history. Query Performance Insight also allows you to track a query ID and view the Query Store — a prerequisite for Query Performance Insight — for more specific information about a query.
The Query Store provides a repository for query execution statistics. It collects and retains execution statistics for queries, which can then be used to monitor and identify performance issues.
You can view the performance data for individual queries using the Query Store, including the execution count, average execution time, and total execution time. This information enables you to identify and optimize slow-performing queries for better performance. In this way, the Query Store enables you to compare query plan performance and revert to a previous query plan if a new plan causes performance regression.
Assuming you have Query Store and Query Performance Insight enabled on your SQL Server, you can use the following steps to track and diagnose a slow-running query. Note the exact steps may vary depending on the specifics of your scenario.
In the Azure Portal, navigate to your SQL database and select Query Performance Insights.
Go to the Resource Consuming Queries tab. When you open it, it will show a list of the top five queries by CPU, Data I/O, and Log I/O.
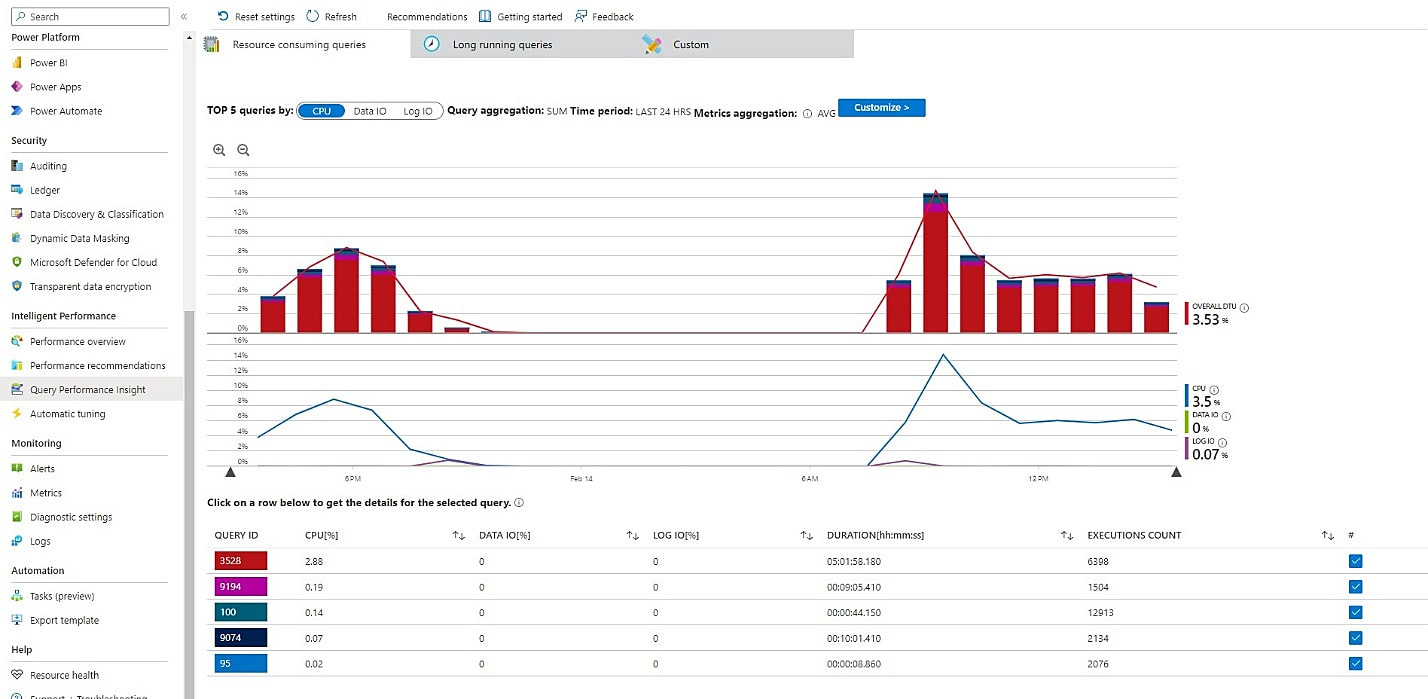 Fig. 1: View the top 5 queries by CPU, Data I/O, and Log I/O in Query Performance Insight
You can get a closer look at a specific time range using the zoom icons to change the observed interval.
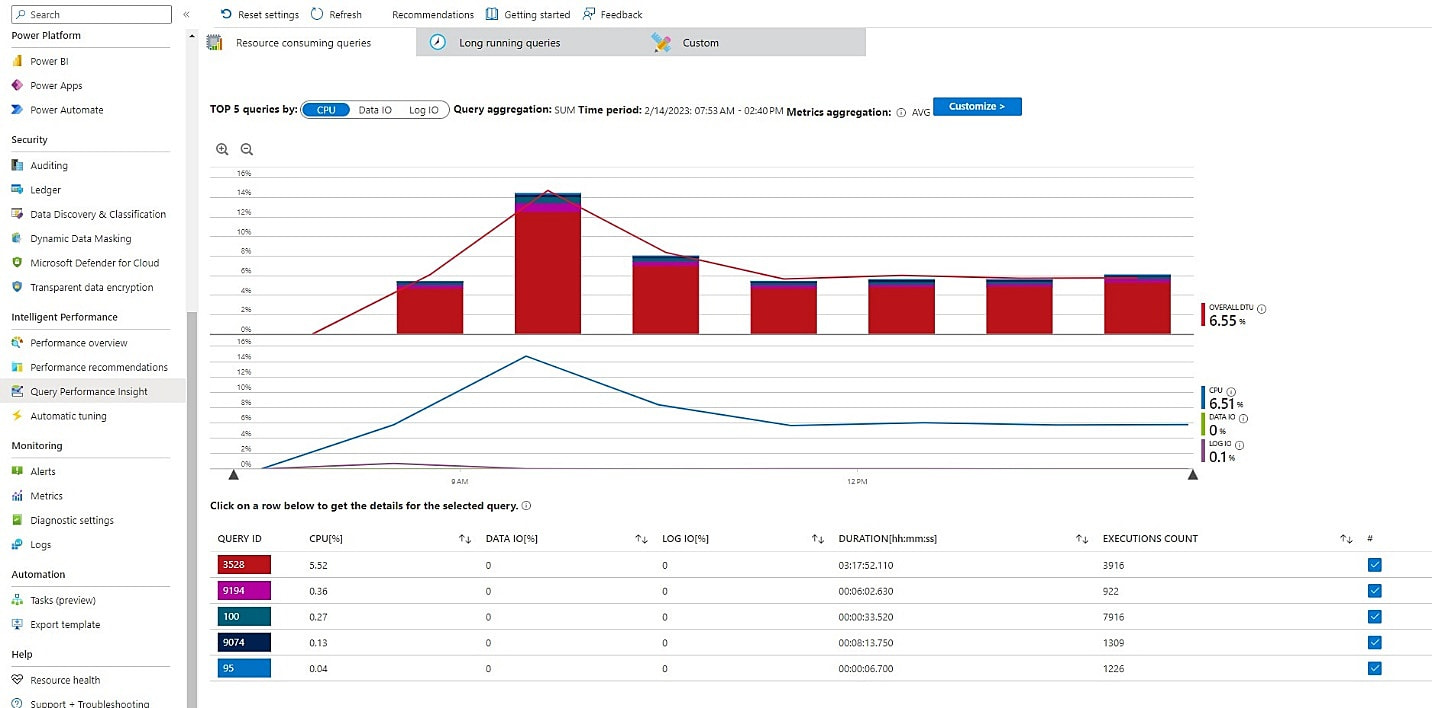 Fig. 2: Zoom into a specific window to view the top resource-consuming queries of a specific time interval
Here, you can observe that the first query with Query ID 3528 consumes 5.53% CPU resource. When you select the first query, the Query Performance Insight provides the following details:
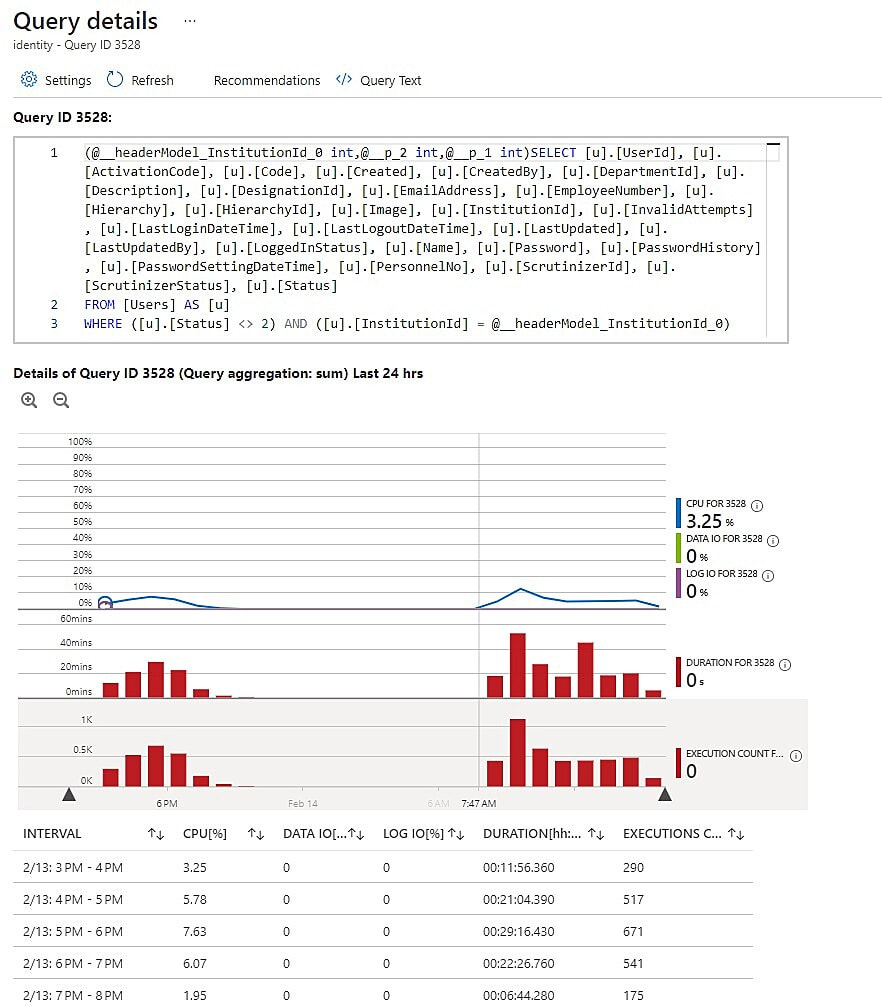 Fig. 3: View fine-grained and aggregated details for a particular query inside Query Performance Insight
Review the query text to see if any poorly designed queries or redundant operations can be optimized and use this information to diagnose the problem with the query. If the execution plan shows a high-cost operation, such as a table scan, consider adding an index to improve performance. If performance metrics show the query consumes many CUP resources, consider using Query Store for performance-tuning recommendations.
In addition to Query Performance Insight and Query Store, Azure also provides Performance Recommendations to help customers optimize their SQL Server performance. Performance Recommendations analyzes database usage patterns and provides actionable insights to improve performance. These recommendations are based on best practices from Microsoft and the SQL Server community and can help customers identify and address Query Store and Azure SQL issues.
For example, Performance Recommendations might suggest creating an index for a frequently queried table or modifying the max degree of parallelism setting to improve query performance. By following these recommendations, customers can ensure their SQL Server runs optimally and avoid issues related to Query Store and Azure SQL.
Troubleshooting performance issues in Azure SQL Server requires a thorough understanding of the underlying causes of the problem. To diagnose and correct performance issues, it’s important to leverage tools and techniques that allow you to monitor resource metrics from inside the Azure Portal. Query Performance Insights and Query Store allow you to track query performance and make performance-tuning recommendations.
Drilling down into the details provided by these tools enables you to identify the root cause of problems and take the necessary steps to improve Azure SQL Server performance. Using powerful tools inside the Azure Portal, such as Query Performance Insight and Query Store, you can identify the top queries that consume the most resources and use these recommendations to tune queries. Azure SQL Server provides fast and reliable performance for your applications.
Yes, Site24x7's Azure SQL monitoring provides deep visibility into query performance, helping you identify top resource-consuming queries and long-running statements.
Site24x7 tracks DTU (Database Transaction Unit) consumption in real-time, alerting you when usage approaches your plan's limit so you can scale resources before performance degrades.
Yes, Site24x7 tracks deadlock-related metrics in Azure SQL Database and alerts you when deadlock counts spike, enabling you to investigate and resolve concurrency issues promptly.