Comprehensive Cisco VPN device monitoring
Automatically discover and add your Cisco site-to-site and remote access VPNs, and other VPN devices, for monitoring. Site24x7 automatically associates added devices with the templates from its huge list of supported devices. You can also add any device, and monitor any metric using its OID, with custom SNMP monitoring.
Configure thresholds and alerts, create maps, set SNMP traps, create custom reports, and more with Site24x7, and stay on top of your virtual private network.
Tell us what you need in our Firewall Analyzer
Take the survey
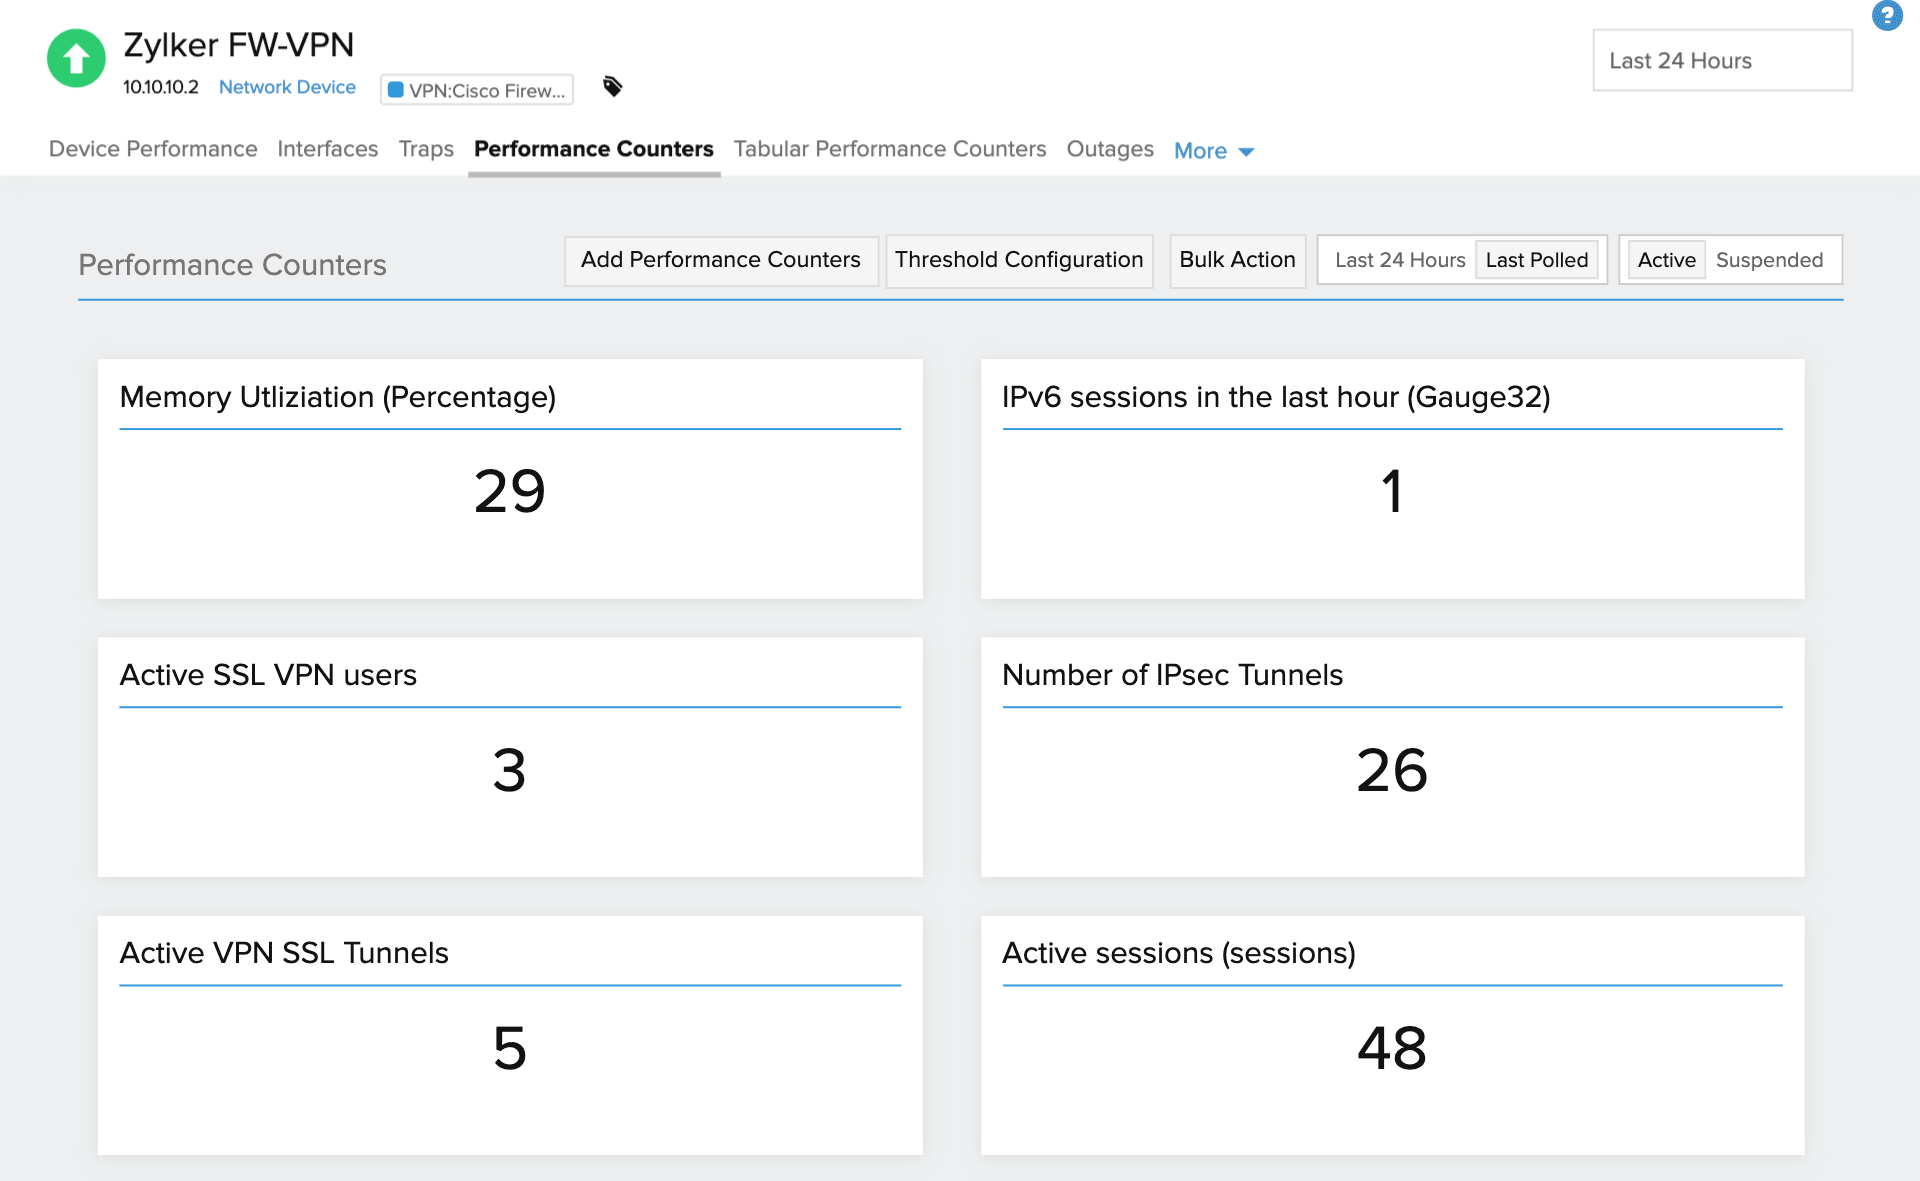
Is your VPN working optimally?
VPN devices are prone to issues like “Error received from secure gateway,” “Session could not be established,” and “Login denied, unauthorized connection mechanism, contact your administrator”. Many things can cause these errors, like shared keys, firewall software errors, and some router and firmware combinations. To identify and fix these errors in a timely manner, you should monitor your Cisco VPN performance using different SNMP performance metrics. Here's a partial list of the metrics we provide by default:
| Metric | Description | OID |
|---|---|---|
| Tunnel octets in | The total number of octets transferred inside the tunnel. | .1.3.6.1.4.1.9.9.171.1.2.3.1.19 |
| Tunnel octets out | The total number of octets transferred outside the tunnel. | .1.3.6.1.4.1.9.9.171.1.2.3.1.27 |
| Tunnel packets in | The total number of data packets transferred inside the tunnel. | .1.3.6.1.4.1.9.9.171.1.2.3.1.20 |
| Tunnel packets out | The total number of data packets transferred outside the tunnel. | .1.3.6.1.4.1.9.9.171.1.2.3.1.28 |
| Tunnel dropped packets in | The total number of data packets transferred inside the tunnel that were dropped. | .1.3.6.1.4.1.9.9.171.1.2.3.1.21 |
| VPN tunnel bytes in (delta) | The total number of octets received by an Internet Protocol Security (IPsec) phase 2 tunnel. This value is accumulated before determining whether or not the packet should be decompressed. | .1.3.6.1.4.1.9.9.171.1.3.2.1.26.1 |
| VPN tunnel bytes out (delta) | The total number of octets sent by an IPsec phase 2 tunnel. This value is accumulated after determining whether or not the packet should be compressed. | .1.3.6.1.4.1.9.9.171.1.3.2.1.39.1 |
| VPN tunnel status | The status of the MIB table row. This object can be used to bring the tunnel down by setting the value of this object to destroy(2). When the value is set to destroy(2), the SA bundle is destroyed and this row is deleted from the table. When this MIB value is queried, the value of active(1) is always returned if the instance exists. This object cannot be used to create an MIB table row. | .1.3.6.1.4.1.9.9.171.1.3.2.1.51.1 |
| Active IPsec VPN sessions | The number of active IPsec sessions. | 1.3.6.1.4.1.9.9.171.1.3.1.1.0 |
| VPN session count | The number of active sessions. A session, a connection terminating on the managed entity, is established to provide remote access connectivity to a user. A session is said to be active if it is ready to carry application traffic between the user and the managed entity. A session that is not active is defined as dormant. | .1.3.6.1.4.1.9.9.392.1.3.1.0 |
| Total clientless only web VPN sessions | The total number of clientless web VPN sessions, i.e. the connection between a remote access VPN tunnel and a Cisco device is using a web browser instead of a software or hardware client. | .1.3.6.1.4.1.9.9.392.1.3.38.0 - .1.3.6.1.4.1.9.9.392.1.3.35.0 |
| SSL VPN connections | The number of active Secure Sockets Layer (SSL) VPN sessions. | .1.3.6.1.4.1.9.9.392.1.3.35.0 |
| Active web VPN sessions | The number of active web VPN sessions. | .1.3.6.1.4.1.9.9.392.1.3.38.0 |
| Current VPN session count | The number of active sessions. | .1.3.6.1.4.1.9.9.392.1.3.1.0 |
| Peak concurrent web VPN sessions | The number of peak concurrent web VPN sessions since the system has been up. | .1.3.6.1.4.1.9.9.392.1.3.40.0 |
Custom SNMP monitoring for Cisco VPN devices
In addition to the default device templates and metrics available, you can also monitor any metric of your choice by specifying its OID and adding custom performance counters. Choose a suitable MIB file and import OIDs directly. Here's a sample list of custom metrics and OIDs.
| Metric | Description | OID |
|---|---|---|
| SVC peak concurrent sessions | The number of peak concurrent switch virtual circuit (SVC) sessions since the system has been up. | .1.3.6.1.4.1.9.9.392.1.3.37.0 |
| Number of users | The number of users who have active sessions. | .1.3.6.1.4.1.9.9.392.1.3.3.0 |
| Number of total failures | The number of failed attempts to establish sessions within the last five minutes. | .1.3.6.1.4.1.9.9.392.1.4.1.1.0 |
| Number of declined sessions | The number of session setup attempts, counted since the last time the notification “ciscoRasTooManyFailedAuths” was issued, that were declined due to authentication or authorization failure. | .1.3.6.1.4.1.9.9.392.1.4.1.2.0 |
For the above metrics, CISCO-IPSEC-FLOW-MONITOR-MIB and CISCO-REMOTE-ACCESS-MONITOR-MIB can be used.
Get more than just performance data
Scalability
Scales to monitor thousands of network devices
Network Discovery
Add multiple devices at once using an IP range
Alerts and Reports
Get timely downtime alerts, and view reports with graphs
High Availability
Ensure high network availability by optimizing bandwidth allocation