Real-time analytics and NETGEAR performance management
Monitor, analyze, and manage your network devices for their status, availability, and performance. With the automatic discovery, all you have to do is just connect to your devices' SNMP MIBs to get started.
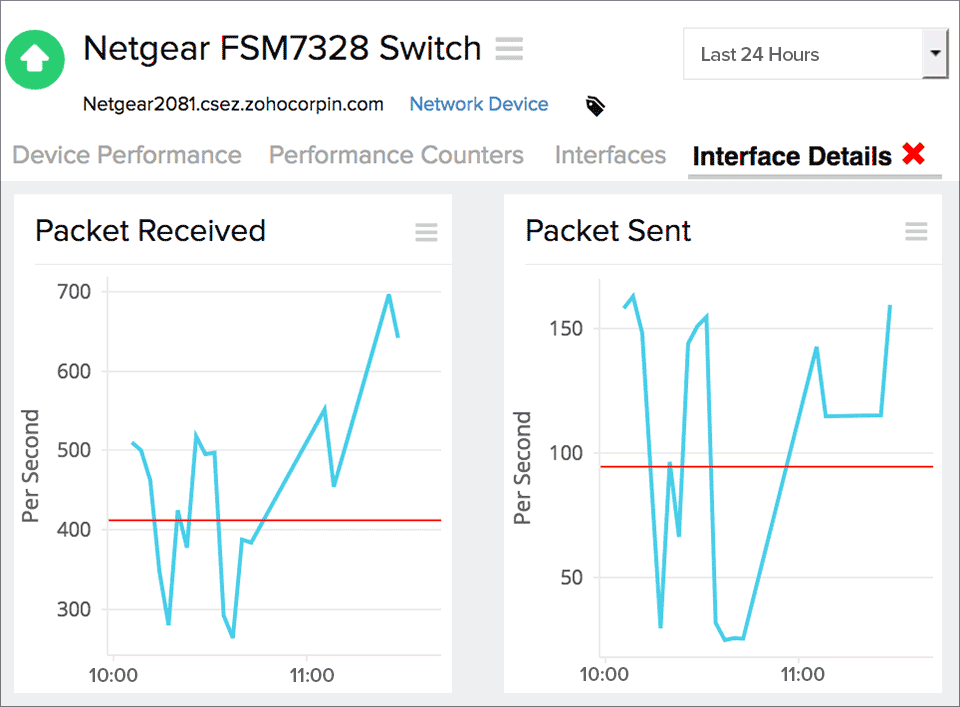
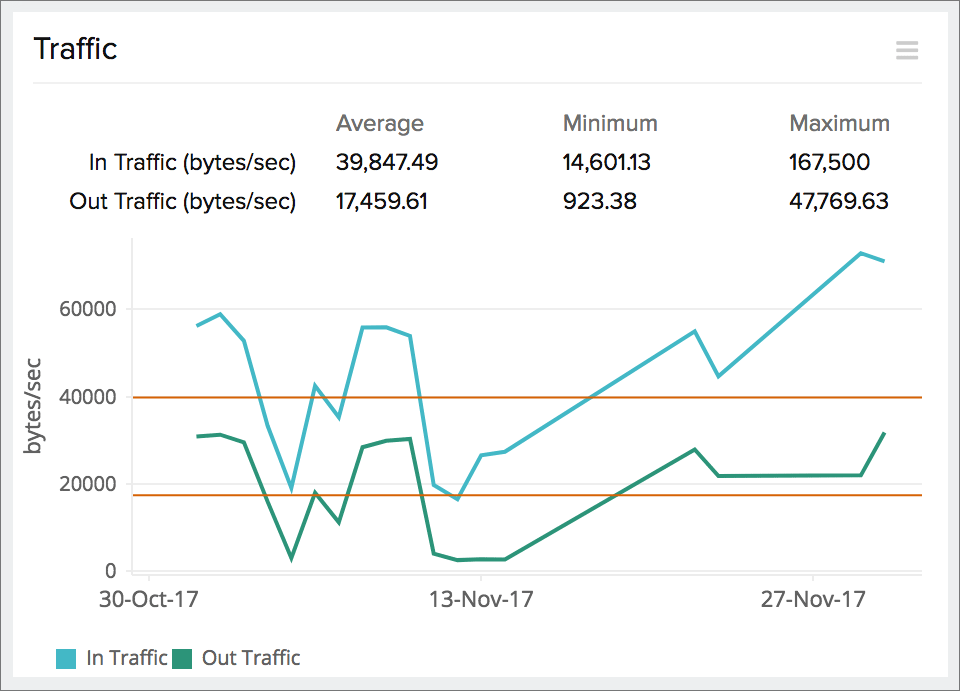
You can track traffic and all other performance counters at the interface level. Stay on top of outages with instant alerts on your mobile device for a complete network management.
NETGEAR performance monitoring metrics
Bandwidth Metrics
- Drop events statistics
- Total number of collisions
CPU Metrics
- CPU utilization
- CPU utilization (UCD SNMP MIB)
Memory Metrics
- Disk utilization
- Free disk space in GB and MB
- Jabber packets
- Memory utilization
- Memory utilization (UCD SNMP MIB)
- Number of fragments
- Oversized packets
- Packets received
- Packets to BC address
- Packets to MC address
- Undersized packets
- Used disk space in GB and MB
Other Metrics
- Partition details of the device (%)
- Process count
- Total number of octets
Out-of-the-box support for NETGEAR devices
In addition to supporting the following devices, you can monitor 'n' number of them by creating custom device templates.
- Netgear FVS338 Router
- Netgear FSM726 Switch
- Netgear FSM7328 Switch
- Netgear GSM7224 Switch
- Netgear GS716T Gigabit Switch
- Netgear FS728TPv2 Switch
- Netgear FSM700S Switch
- Netgear GS724Tv3 Switch
- Netgear GS748T Switch
- Netgear GS748TP Switch
- Netgear GSM7212 Switch
- Netgear GMS7224v2 Switch
- Netgear SRX5308 Firewall
- Netgear FVX538 Firewall
- Netgear ProSafe Wireless AccessPoint WG302
- Netgear Access Point
How Site24x7 monitors NETGEAR devices?
- Automatically discovers SNMP devices by connecting to its MIB.
- Chooses from over 10,000 default templates or allows you to customize based on your requirements.
- Thoroughly monitors key metrics at the interface level.
- Allows you to add over 100 performance counters of your choice.
- Sends processed SNMP trap messages from your devices.
- Creates layer 2 maps and topology maps.
- Sends prompt alerts about downtime.
- Displays graphs of key performance stats.
- Generates predefined and customizable reports.
Get more than just performance data
Scalability
Scales to monitor thousands of network devices
Network Discovery
Add multiple devices at once using an IP range
Alerts and Reports
Get timely downtime alerts, and view reports with graphs
High Availability
Ensure high network availability by optimizing bandwidth allocation